Ethereum's decision timeMy stance of course is I am embarrassed, but we have two scenarios here to play out in my opinion and it's quite clear what I have drawn here. I believe lower this week but only time will tell
Cryptomarket

US vs China: should we be worried?Another ''Buy the rumor''? What EVERY trader should have in mind amid US-China Trade talks:
1. Beijing balks at enforcement or verification terms
China could reject U.S.‑demanded mechanisms for monitoring compliance, such as agricultural purchase tracking or fentanyl control checkpoints.
Past talks collapsed over the same issue, the U.S. insisting on verification, China citing sovereignty .
If Beijing signals “framework only, no enforcement,” Washington may treat it as stalling and re‑activate the 155 % tariff threat for Nov 1 .
2. Rare‑earth or tech export retaliation
China still holds leverage through critical‑mineral exports. If it re‑tightens rare‑earth or semiconductor‑material shipments, Washington could impose new export controls on Chinese tech, reigniting escalation.
That “supply‑chain weaponization” was what caused the early‑October market sell‑off and would likely repeat—hurting metals, EV, and chip stocks first.
3. Unexpected Trump pivot under political pressure
Analysts warn that Trump tends to shift abruptly when domestic optics change.
A new social‑media statement accusing Beijing of backsliding could nullify the deal narrative overnight .
Morgan Stanley’s Mike Wilson noted that any such reversal could trigger a 10–15 % equity correction due to “positioning unwind and tariff risk repricing” .
4. National‑security or Taiwan language slips
The framework explicitly avoids defense issues, but if Trump or Xi reference Taiwan or South China Sea policy during press remarks, it could politicize the summit and freeze trade clauses .
5. Market complacency and over‑positioning
Even with a signed “mini‑deal,” markets may have already priced it in.
JPMorgan research warns that a “buy‑the‑rumor, sell‑the‑news” reaction is likely if investors had pre‑emptively rotated into cyclicals .
Thin liquidity plus leveraged optimism could amplify any disappointment.
Bottom line:
Unless both leaders explicitly confirm a tariff suspension and avoid new geopolitical flashpoints, markets remain only one headline away from reversal. The biggest red flags to watch this week are (1) a stalled verification clause, (2) talk of renewed tech or rare‑earth restrictions, or (3) Trump implying that tariffs will still “go forward pending review.” Any of these could instantly shift sentiment from optimism to a fresh wave of selling.
#trade #correction #economy #finance #us #china #tariff #bitcoin #crypto #stocks #equities #trading

ZECUSDT - another leg up ahead!Keep your eyes on it — just like I told you before. Its target was $250–$280, and it actually hit $298 exactly. It then entered a temporary corrective phase, forming a falling wedge pattern.
This coin is an ideal pick for the current phase, and don’t worry — its bullish run isn’t over yet.
Next target: $360. I’ll keep posting updates about it regularly.
Best regards:
Ceciliones🎯

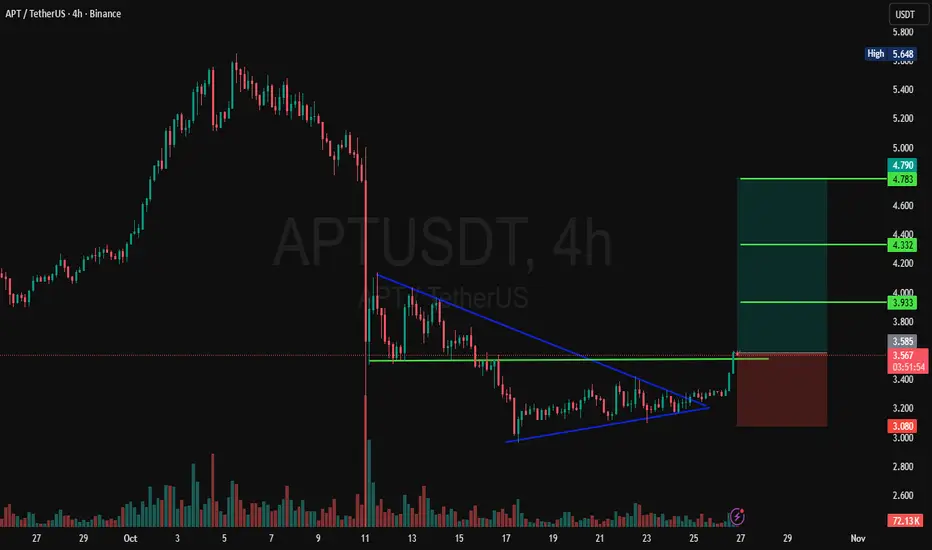
APT 4H Trade IdeaAptos looks bullish here on 4H time frame.
It has broke sideways & important level. Looks like a good accumulation done.
Entry & Exit points are on the chart.
NFA DYOR
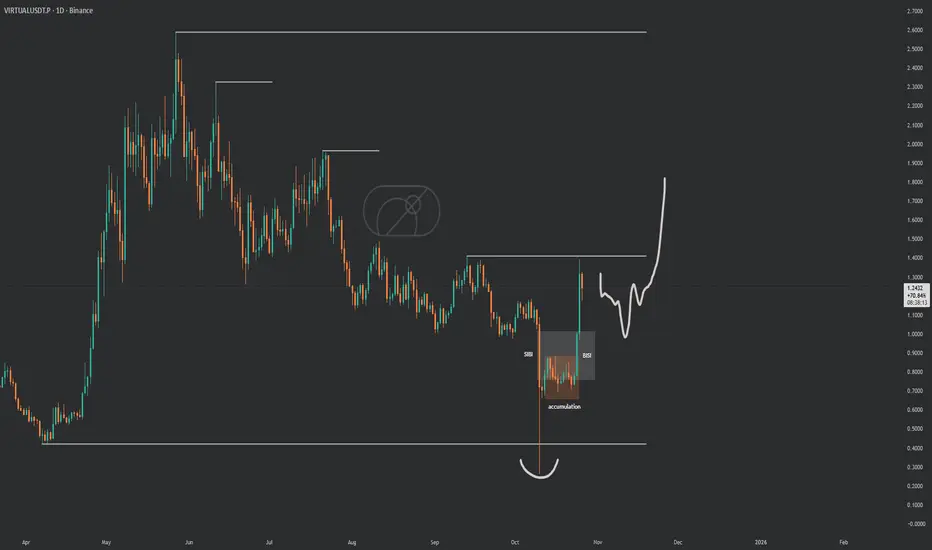
$VIRTUAL got that clean range clean price actionSPARKS:VIRTUAL got that clean range clean price action straight textbook accumulation. Lot of coins looking just like this, coiling up for the first real upside blast !If it dips to hand us $1, that's the golden entry.
new month watch list : SEED_WANDERIN_JIMZIP900:ASTER AMEX:XPL SPARKS:VIRTUAL
Inside the channel and Flies.If you look at market patterns and Bollinger bands, price always goes from high volatility to price discovery, tightens. Market shows clear direction, ie 🟢 or 🔴.
The same when using longterm charts, they fluctuate and you can almost find where the important channel gonna be.
It's psychology.
85% bullish. 15% it fails, imo.:)

USDT.D – 4H Technical Summary (Oct 26, 2025)USDT.D – 4H Technical Summary (Oct 26, 2025)
Structure: USDT Dominance has broken below the short-term BOS (Break of Structure) after multiple rejections from the premium zone, indicating a potential shift from bullish to bearish momentum.
Price Action: The dominance failed to hold above Equilibrium (≈4.84%) and is now trading toward the discount zone, signaling risk-on sentiment across crypto assets.
Moving Averages: Price is currently testing below the EMA89 (blue) while the EMA200 (yellow) sits near 4.70% — a key area for reaction. A clean break below this confluence would reinforce further downside.
Liquidity Zones:
Immediate support: 4.70% (discount / EMA confluence)
Next target: 4.40% – 4.20% (strong demand & previous accumulation zone)
Resistance: 4.90% – 5.00% (equilibrium retest / prior supply)
Momentum: The stochastic oscillator remains in the oversold region, hinting at a possible short-term bounce, but structure favors continued downside after retracements.
Trading Plan:
Bias: Bearish – expecting further decline in USDT dominance.
Scenario: Watch for minor pullback to 4.85% – 4.90% to confirm rejection before continuation lower.
Targets: 4.70% → 4.40%.
Invalidation: Sustained move back above 5.00%.
➡️ Outlook: Weakening USDT dominance supports bullish continuation for Bitcoin and altcoins as capital rotates out of stable assets into risk-on markets.

BTCUSDT – 1H Technical Summary (Oct 26, 2025)Structure: Bitcoin continues to respect the ascending channel, showing consistent higher highs and higher lows — confirming bullish structure.
Liquidity: Price broke above PDH (~112,800) and tapped into the premium / weak high zone (~114,000), suggesting buy-side liquidity has been taken.
Momentum: Strong bullish impulse candle with high volume; stochastic in the overbought zone → possible short-term consolidation before continuation.
Key Levels:
Support: 111,800 – 112,000 (Equilibrium / PDH retest zone)
Resistance: 114,000 – 115,000 (premium supply area)
Trading Plan:
Look for pullback buys near 112,000 – 112,500 zone.
Targets: 114,800 → 116,000 → 118,000 (channel top / PWH).
Stop-Loss: Below 111,000 (below structure & equilibrium).
➡️ Bias: Bullish – favoring buy setups on pullbacks while price stays above 111K support.

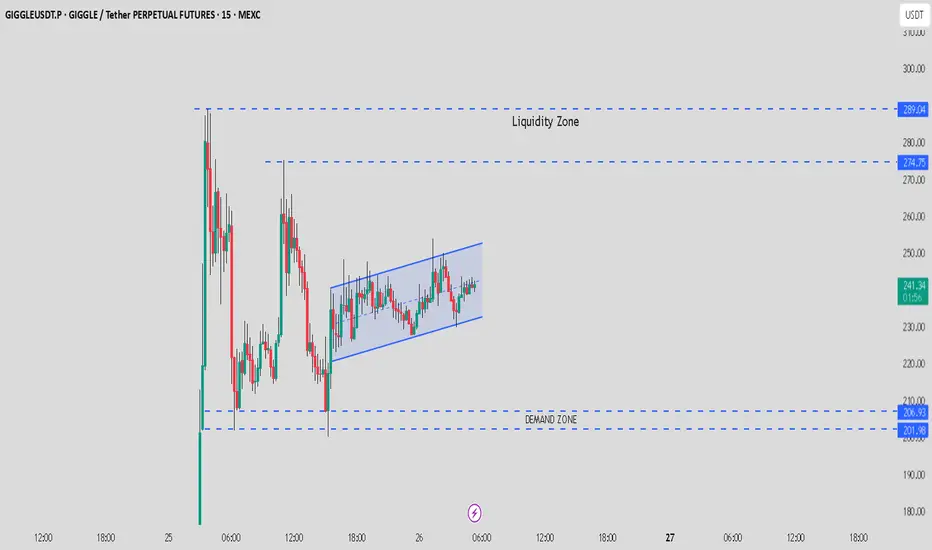
GIGGLE / USDT at decision point- Watch for breakout or breakdownGIGGLE is currently trading within a rising channel, and price action suggests a possible breakout or breakdown ahead.
Bullish Scenario: A strong breakout above the channel could lead to a rally towards $275 – $289.
Bearish Scenario: A breakdown below the channel may push price towards the demand zone at $205.
Always wait for confirmation before entering and manage risk wisely. DYOR before making any trade decisions.
General Market OutlookHello, I want to talk about markets in general before the week start.
The Federal Reserve is trying to navigate with limited data. Recently, after Governor Waller used ADP data without authorization, the Fed lost access to ADP’s high-frequency employment data as well.
CPI and core CPI both came in at 3%, slightly below market expectations but in line with Cleveland Fed and Bloomberg models. With inflation not overheating, there is little reason for the Fed to delay rate cuts in its remaining two meetings this year, though these cuts are likely already priced in. The real focus will be on what FED will do in 2026.
This week brings meetings from the Fed, ECB, BOJ, and BOC, while the Trump–Xi talks will take center stage. For me, the most important event will be the US–China negotiations. China holds a structural advantage: its exports have remained resilient despite US tariffs, supported by rising trade with South America, Africa, the EU, and South Asia. Meanwhile, the US remains heavily dependent on China for rare earths, a situation unlikely to change soon. However, China’s top priority remains its economy, which should keep the door open for compromise and negotiations.
Also, keep an eye on the shutdown situation and upcoming earnings reports.
US bond yield is falling, now a battle around 4% is ongoing for 10-y yield. If it bounced from 3.85% trendline dollar might try to recover, but so far I don't see any reason for a dollar jump, rather the tight range between the trendline from 2011 and 100 resistance likely to continue.
EURUSD is trying to recover with slighlty bullish trend but this trend could turn into flag formation easily if dollar index to make a move towards 100. I expect EURUSD to continue recover with strong data from EU and weaker data from US. If shutdown extends further, both stock market and dollar might turn bearish.
There’s nothing new to add for USDJPY beyond the previous analysis. If the base case scenario unfolds, it will support the dollar index retesting its trendline in the coming weeks.
Nasdaq is still trending high with insane amount of AI investments and better than expected earnings. High valuations, shutdown and China fears are not in the spotlight yet. As long as Nasdaq trend channel continues, no reason to back out bullishness, but careful if it break because corrections often came very hard.
Crypto market is yet to recover after the massive sudden crash. Bitcoin is less effected, but still has a problem. If 114k regained, maybe signs of recovery will be more clear. But the danger is not over yet.
My base case for gold to hold above 4000 and recover towards 4250. 4160 is a key resistance this week. I expect gold is getting to a long term peak, likely to hit before the year end but still has some way to go. I will write about Silver's long term cycle in a couple of days so stay tuned for that.

ETH Support Holding, But Cracks ShowingAs long as CRYPTOCAP:ETH holds the key support zone, the overall structure remains bullish and there’s nothing to worry about.
However, the technical setup is starting to weaken, a break below this support could turn things ugly, especially for altcoins.
DYOR, NFA
#PEACE
Thanks for reading! Appreciate your support and engagement 🙏

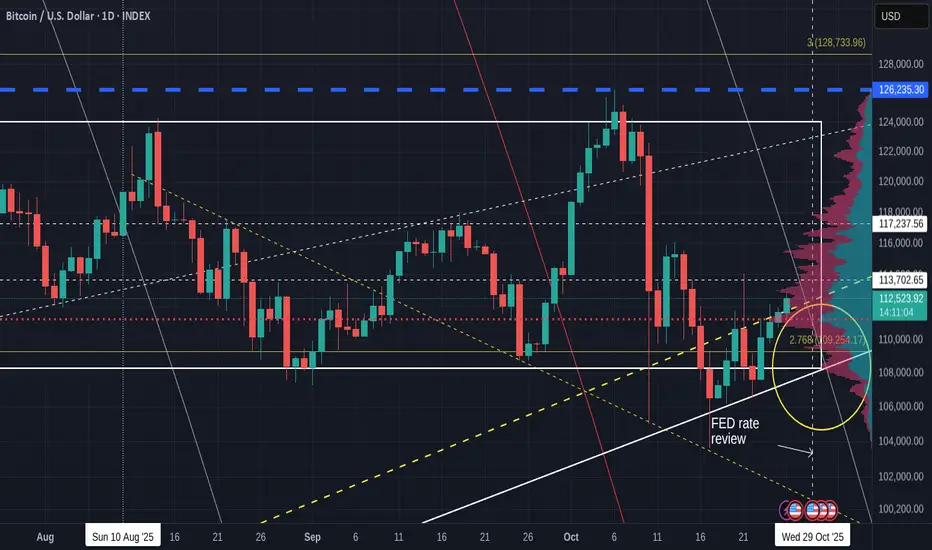
Bitcoin Daily heading towards resistance but has strength
We can see BTC PA rolling along hte top side of that circle ( which I placed 2 weeks ago and can be seen in previous posts )
PA is now heading towards that 236 Red Fib circle ( resistance ) while sitting on that dashed line of support.
PA has the ability to push through if the Bulls continue to support.
The MACD continues to rise and has now crossed its signal line. Bullish
RSI has risen above its MA and has plenty of room to continue
The Blue dash line at Top of chart is the current ATH zone and we have a tough fight to get there and pass it but I have little doubt we will.
It just may not be this month
Monthly candle is currently RED and this may scare people but we had a red october i 2012, in the middle of a bull run
I leave that there
LPT Roadmap (3D)From the point where we placed the red arrow on the chart, the LPT correction has started, and it seems to be forming a time-consuming ABC pattern, currently in the early stages of wave C.
It is expected that the price will soon move downward to complete wave C.
The best and lowest-risk investment and buying zone is the green area.
The main targets are marked on the chart.
For risk management, please don't forget stop loss and capital management
When we reach the first target, save some profit and then change the stop to entry
Comment if you have any questions
Thank You

PIPPIN/USDT — Dip Buying Zone Formed After BreakdownPIPPIN/USDT — Dip Buying Zone Formed After Breakdown 💎
After the recent breakdown, PIPPIN has entered its volume zone, which often acts as a re-accumulation area before a potential rebound.
If the price can stabilize and build strength here, this level could represent a dip-buying opportunity with the possibility of a return toward previous highs.
📊 Key Range: $0.015 – $0.024
💡 Focus: Watching for a volume confirmation or strong reversal candle to signal a bounce

ORDER / USDT gaining momentum-Watch for breakout towards $0.35ORDER is showing strong momentum and building up for a potential short-term bullish rally. A confirmed breakout above the current resistance zone could lead the price towards $0.33 – $0.35.
Momentum suggests a possible trend shift — keep a close watch and manage risk wisely.

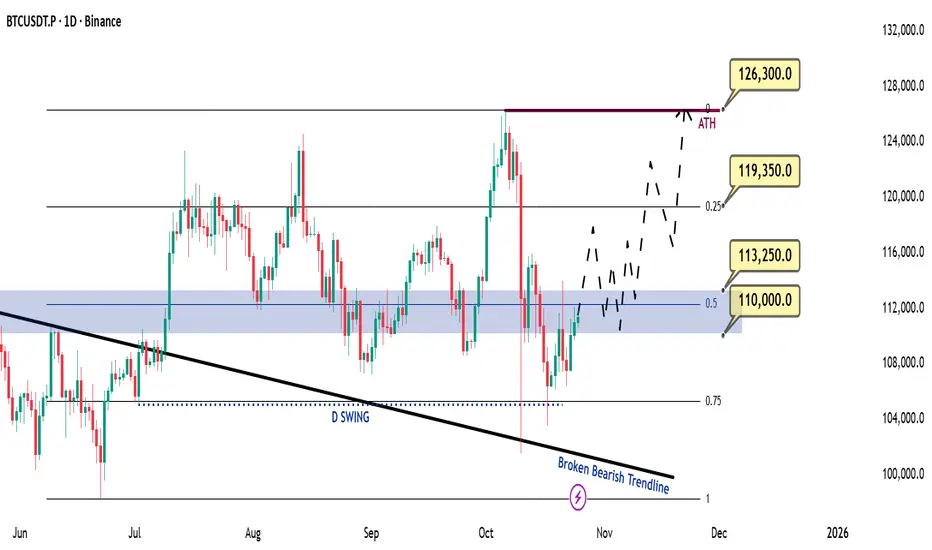
Bitcoin Game Plan – RAKZ ModelBitcoin Game Plan – RAKZ Model
📊 Market Sentiment
Bitcoin’s sentiment is currently volatile but shifting bullish due to macroeconomic and geopolitical factors.
The U.S. is entering a quantitative easing (QE) phase, which historically channels liquidity toward risk assets.
After a softer CPI print on 24/10, the FED is expected to cut rates twice (total 50 BPS) this year.
Meanwhile, improving relations between the U.S. and China ease global trade concerns, reducing macro risks.
📈 Technical Analysis
Bitcoin is currently trading within a defined range.
Price recently retraced to the bearish trendline, ran Daily Swing Liquidity, and rejected from a Higher Timeframe Demand Zone — all within the 0.75 max discount zone.
This setup suggests a potential range accumulation phase before a bullish expansion.
I’m monitoring price action closely as it consolidates, building momentum for a possible breakout.
📘 Model in Use – Range Accumulation with HTF Key Zone (RAKZ Model)
This model identifies price accumulation inside higher timeframe zones and aims to capture continuation moves once structure confirms strength.
Model Steps:
1️⃣ Identify range accumulation on HTF.
2️⃣ Wait for price to tap EQ or 0.75 zone.
3️⃣ Confirm daily close above EQ or key zone.
4️⃣ Enter on breakout or retest of the key zone.
5️⃣ Validate with LTF market structure confirmation before entry.
📌 Game Plan
Wait for a daily close above $113,250, the confluence of both the EQ of the range and a HTF Key Zone.
That daily confirmation will signal bullish continuation.
🎯 Setup Trigger
→ Daily break and close above $113,250
→ 4H structure shift on retest of $113,250
📋 Trade Management
→ Stop Loss: Daily close below $110,000
→ Targets: TP1: $119,350 TP2: $126,300 (ATH)
→ Move SL to breakeven after TP1 is reached.
💬 If this analysis helps your trading, leave a comment or follow for more detailed model-based setups every week!
⚠️ Disclaimer: This content is for educational purposes only and does not constitute financial advice. Always conduct your own research before trading.
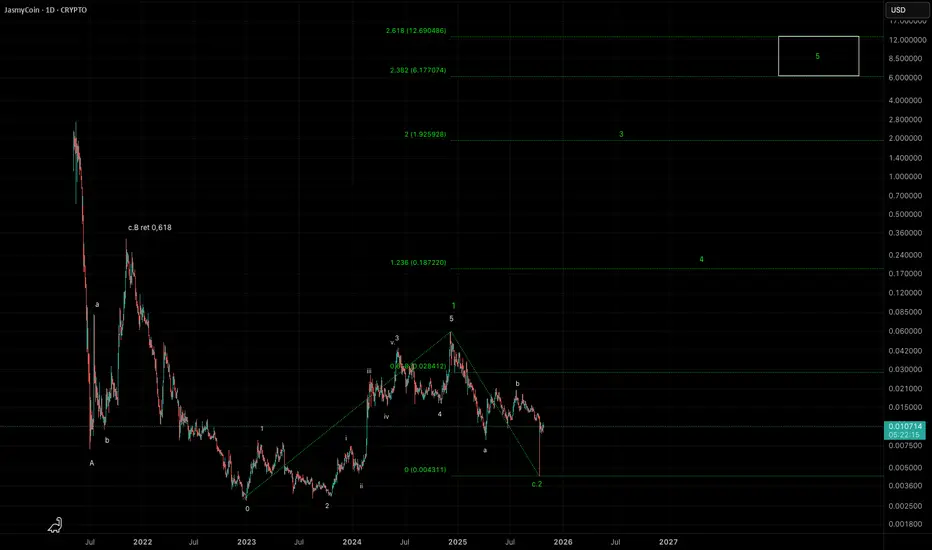
JASMY Waves 1 and 2 in place. Powerful 3rd wave up nextEverywhere we look at, JASMY has a textbook structure. First of all an ABC correction to bottom, then a beautiful wave 1, next a perfect wave 2. The chart shows a potential wave 3 in the making.
HYPE/USDT Price Heating UpGETTEX:HYPE is showing a nice bounce from the key support zone, holding that area quite well. The price is now approaching a minor resistance around the trendline.
If it manages to break and close above this line, we could see a strong upside move in the coming sessions.
DYOR, NFA
PEACE

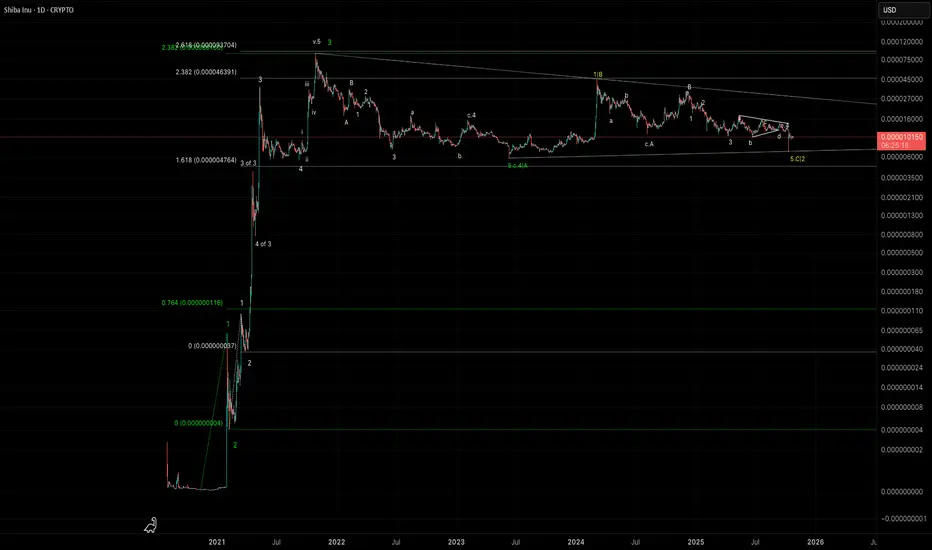
SHIBA INU, Why it needs One more highThis is my all-time elliott wave structure for SHIBA INU, and the reason why i think it needs one more high to complete 5 waves since it's creation. The structure shows how SHIBA has hit extension 2,382 to end wave 3. If we look at the internal structure —12345 white— we can see 5 waves of internal wave 3 hitting exactly the 2,618 extension. So, we have a nice confluence of 2,618 extension corresponding to all of wave 3 and 2,382 extension. SHIBA is now in a very long wave 4. Either it is a very large triangle where waves d and e are still needed or this correction is almost over. Also we have a classic bull flag. It's just a matter of time before SHIBA decides to go up and complete wave 5 to at least 2,618 extension
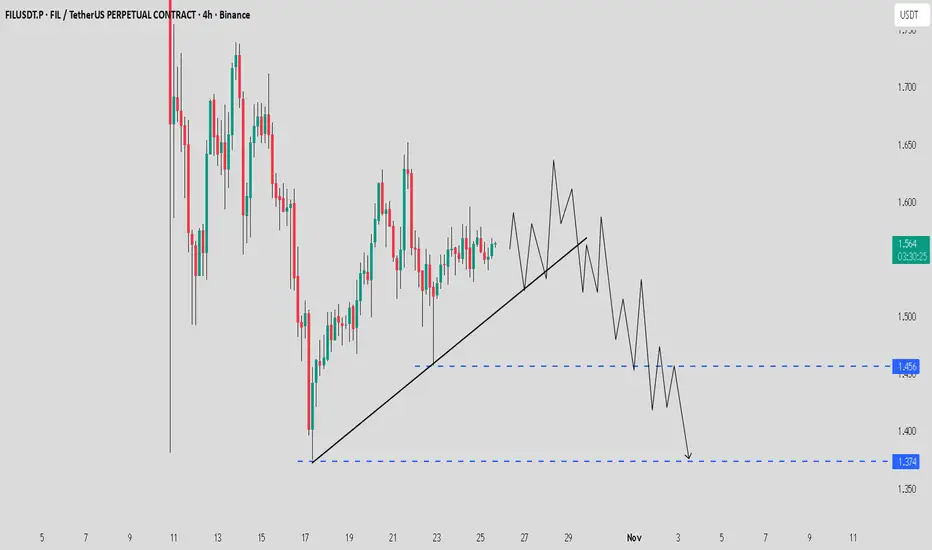
FIL / USDT Eyeing liquidity zone- Possible Reversal setup AheadFIL is showing signs of weakness and appears to be seeking liquidity below the $1.45 – $1.37 zone. If price dips into this area and absorbs liquidity, a potential reversal and trend shift to the upside could follow.
Stay patient, manage risk wisely, and watch how price reacts around the key liquidity zone.
PIPPIN/USDT — Path Toward $0.50 with 500M Market Cap PotentialPIPPIN/USDT — Path Toward $0.50 with 500M Market Cap Potential 🚀
PIPPIN is currently showing early structural strength after a long accumulation phase.
Based on current supply metrics and market behavior, a 500M market cap could push the price toward the $0.50 zone, representing a major expansion phase from current levels.
📊 Market Structure Overview:
Current base forming near $0.028
Next psychological and technical targets at $0.33 → $0.50
The $0.50 region aligns with ~500M market cap potential
If momentum continues building, PIPPIN could be entering a stage where new capital inflows drive a high-multiple move, similar to its previous historical run.
💡 Observation: The chart shows similar accumulation and volume buildup patterns seen before large runs — a breakout could mark the start of a new growth cycle.
📈 Outlook: Bullish scenario toward $0.50
🎯 Market Cap Target: 500M

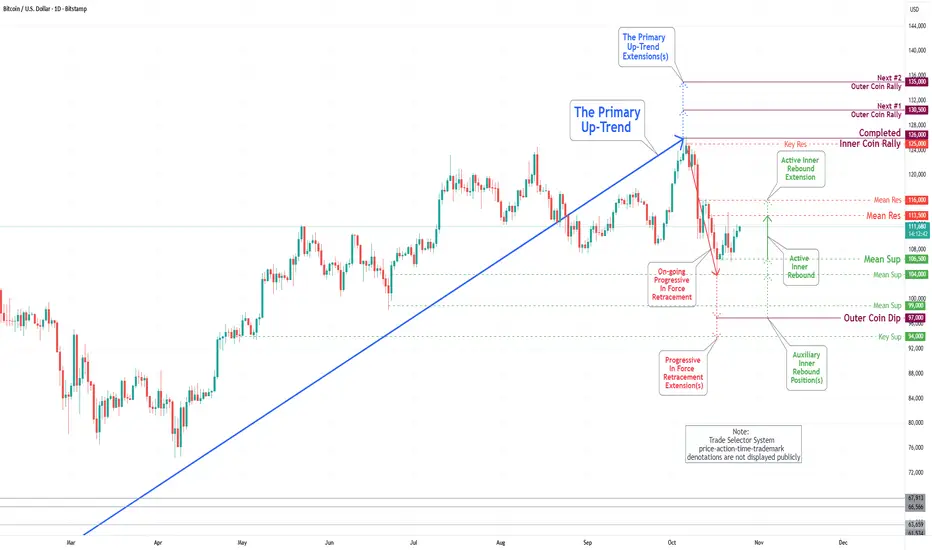
Bitcoin(BTC/USD) Daily Chart Analysis For Week of Oct 24, 2025Technical Analysis and Outlook:
In last week's trading session, the Bitcoin market experienced wild gyrations between Mean Support 106500 and the critical Mean Resistance level of 113500, as the price is currently actively fluctuating between the two.
Current market analysis indicates an initial recovery towards the Mean Resistance level of 113500, with the potential for further upward movement to the Mean Resistance level of 116000. However, it is crucial to acknowledge the possibility of a reversal at these resistance levels, which could extend to continue the Progressive In Force Retracement trend.
TradeCityPro | Bitcoin Daily Analysis #206👋 Welcome to TradeCity Pro!
Let’s move on to Bitcoin’s analysis, the market is still moving upward, so let’s review it together.
⏳ 1-Hour Timeframe
Yesterday, Bitcoin formed a resistance zone around 111463, which it touched once, and on the next attempt, it managed to break through this level.
⭐ In this bullish leg that started after the fake-out of 107486, the RSI is strongly supporting the trend and is now close to the Overbought area.
✔️ However, volume is still very low and doesn’t confirm the trend, which isn’t ideal. Since today is Saturday, overall market volume is weak, and there’s a high chance that with the start of the new weekly candle, this entire upward move could turn out to be a fake-out in the next couple of days.
✨ Still, I believe it’s worth the risk to keep the positions open that were entered at 108943 and 111463, because if the 113429 level breaks, price could start a very strong bullish move.
💥 If this upward move turns out to be fake and price stabilizes below 111463, we can consider that as a temporary bearish confirmation — in that case, price could again drop back down toward the 107486 level
📝 Final Thoughts
Stay calm, trade wisely, and let's capture the market's best opportunities!
This analysis reflects our opinions and is not financial advice.
Share your thoughts in the comments, and don’t forget to share this analysis with your friends! ❤️
