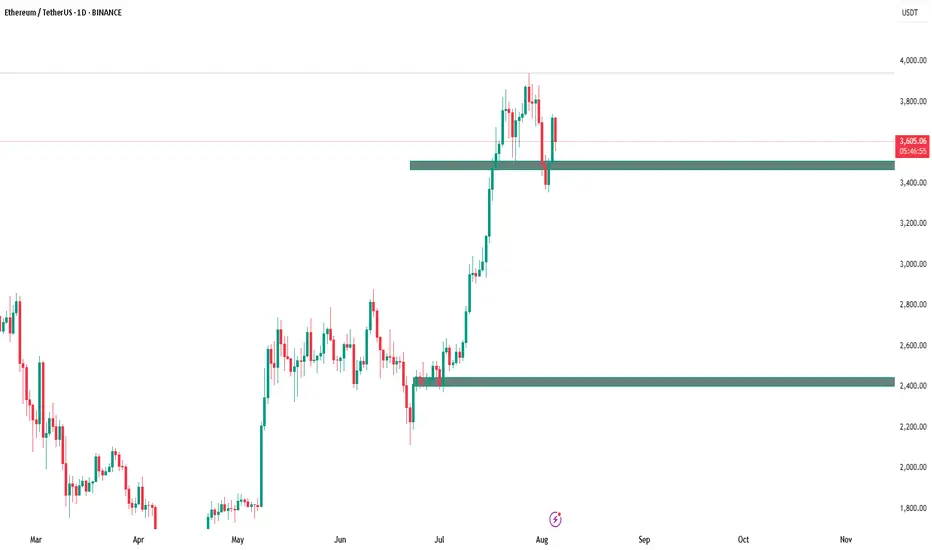
EthereumETHUSD
- Completed " 123 " Impulsive Waves
- Fibonacci Level - 161.80%
- Change of Characteristics
- Fair Value Gap
- Consolidation Phase
Cryptopickk

BTC DOWN TO 80K? Based on what we are seeing here if BTC breaks through 100K then the next level down is 80K marker and if that does not hold then 70-72K marker makes sense
However If we can make new highs and break 107K then it is possible to continue upwards
If you want a deeper dive on BTC or any other crypto or stock or commodity you have been watching comment below the stock or asset and I will send you personally an analysis of that asset.
Happy Trading
Trade Smarter Live Better
Mindbloome Exchange

ETHERIUMTHE RESULT
Follow for more Simple And accurate swing analysis on Indices, Currency, Commodities.
FETAI SURGING TO 2$ canadian by summer. Perfectly bouncing in the support resistance bull climb dating back to when the coin first came about BUY NOW

Solana driving to 176 ??? Or can we go Higher? Hi everyone
This is what I am seeing currently, let me know what you think ?
Kris/Mindbloome Exchange
Trader Smarter Live Better

ETH TO THE MOON TRADEETHUSDT Weekly Analysis | 3M & 12M Supply/Demand Zones
Currently, Ethereum (ETHUSDT) is trading around $1803, sitting close to major higher timeframe zones:
3-Month Supply/Demand Zone: ~$1691
12-Month Supply/Demand Zone: ~$1557
Price has reacted strongly near the 3M S/D zone after a multi-month decline. Holding above this zone could indicate a potential bottom formation.
Reminder:
This is not financial advice. Always do your own research and trade with proper risk management.

Bitcoin will reach $180,000 this yearBitcoin’s trajectory is unstoppable—analysts are calling for a climb to $180,000, fueled by institutional adoption, limited supply, and global economic uncertainty. With halving cycles tightening the squeeze and mainstream acceptance soaring, BTC isn’t just a store of value—it’s the financial revolution we’ve been waiting for. Buckle up, the bull run’s coming.

Bitcoin Breakout Confirmed, Aiming for $160K
Chart Analysis:
Bitcoin has just confirmed a major breakout above a key resistance zone, signaling a strong bullish continuation. Let’s dive into the details:
1.Ascending Triangle Breakout:
BTCUSD had been consolidating within an ascending triangle pattern since late 2024, with the upper resistance around $80,000 and a rising support trendline (highlighted in yellow).
The breakout above $80,000 on strong volume confirms the bullish pattern, which is typically a precursor to significant upward moves.
2. Accumulation Zone:
Before the breakout, Bitcoin spent several months in an accumulation zone between $53,837 and $80,000. This phase allowed buyers to build positions, setting the foundation for the current rally.
3.Price Targets:
The measured move of the ascending triangle (height of the pattern) projects a target around $160,000. The height of the triangle is approximately $26,163 (from the base at $53,837 to the resistance at $80,000). Adding this to the breakout point ($80,000 + $26,163) gives a target of ~$106,163. However, considering Bitcoin’s historical tendency to overshoot during bull runs and the psychological significance of $160,000 (as noted on the chart), this level seems like a realistic target.
4. Support Levels:
The previous resistance at $80,000 now acts as strong support. If BTC pulls back, this level should hold to maintain the bullish structure.
Additional support lies around $70,000, aligning with the lower boundary of the recent consolidation range.
5. Momentum Indicators:
While the chart doesn’t display specific indicators like RSI or MACD, the sharp upward move suggests strong momentum. Traders should monitor for overbought conditions on RSI (above 70) as BTC approaches higher levels, which could indicate a potential pullback.
Trade Idea:
Entry: Current price around $84,599.61 (post-breakout confirmation).
Stop Loss: Below $78,000 (to account for minor pullbacks while staying above the breakout zone).
Take Profit: $160,000 (primary target based on the pattern projection and psychological level).
Risk/Reward Ratio: Approximately 1:12, making this a high-probability setup.
Key Levels to Watch:
Resistance: $100,000 (psychological), $120,000, $160,000 (target).
Support: $80,000 (new support), $70,000 (secondary support).
Market Context:
Bitcoin’s breakout aligns with a broader crypto market uptrend, potentially fueled by positive fundamentals such as institutional adoption, favorable regulatory developments, or macroeconomic factors like inflation concerns driving demand for BTC as a store of value. Ethereum’s recent breakout (as seen in similar charts) also supports the bullish sentiment across the crypto market.
Conclusion:
BTCUSD has broken out of a multi-month consolidation pattern, confirming a bullish trend with a target of $160,000. The $80,000 level should now act as strong support, and any pullbacks to this zone could offer additional buying opportunities. Stay cautious of overbought conditions as BTC approaches higher resistance levels. Let’s see how far this rally can go!

CELR-USDT Short Trade: 150% Profit Achieved!On the 4H timeframe, a short trade on CELR-USDT successfully hit all targets, delivering a massive 150% profit with 10x leverage.
Trade Breakdown:
Entry: 0.01547 USDT
Stop-Loss (SL): 0.01605 USDT
Take Profit (TP) Levels:
TP 1: 0.01476 ✅
TP 2: 0.01361 ✅
TP 3: 0.01246 ✅
TP 4: 0.01175 ✅
Technical Insights:
The price followed a strong downtrend, confirmed by the Risological indicators.
A clear break below key levels triggered the short entry.
The structured exit strategy ensured all profit targets were achieved by the TP4 level.
Currently CELR is in my "No trade zone", unless it breaks down or breakouts to get into a fresh trade!
Stay tuned for more insights and updates.

NEIRO/USDT: A Hidden Gem Ready for a Massive 300% Breakout!📉 Current Position: NEIRO/USDT is finding strong support near the discount level, signaling a potential reversal. The price is consolidating after a prolonged downtrend, indicating possible smart money accumulation.
📊 Technical Setup:
✅ Support Zone: NEIRO is holding a key support level, preventing further downside. A bounce from here could ignite a powerful bullish reversal.
✅ Fair Value Gap (FVG) Re-Test: The first major target lies in the FVG resistance zone around $0.0010. A clean breakout above this level will confirm the bullish shift.
✅ Break of Resistance: If NEIRO decisively clears the FVG resistance, it unlocks an explosive move towards $0.0025 and eventually $0.0030, representing a 300% gain from current levels.
🔥 Investor Opportunity:
High Reward Potential: Breaking above resistance could lead to massive price appreciation, rewarding early investors.
Smart Money Accumulation: Price action suggests large players might already be positioning before the breakout.
Bullish Confluence: Multiple indicators support an upcoming surge, making this a prime investment opportunity.
💡 Final Thoughts: NEIRO/USDT is setting up for a monumental breakout. A push above $0.0010 could send it soaring toward $0.0030, delivering a 300%+ gain. This might be the perfect time to position ahead of the rally before the market catches on! 🚀📈

Bitcoin: Don't be blind to the world (Trump inauguration)Regular readers will know that we avoid fundamental analysis In these reports - we stick to the price.
But that doesn’t mean being blind to the world around us.
On Monday January 20, Donald Trump will be inaugurated as US President.
I’m sure many of you have your political views about Trump - but just keep those away from your trade ideas!
The crypto market - and Bitcoin especially - has been on a huge rally since Trump spoke at a Bitcoin conference in favour of cryptocurrencies last year.
There’s a chance President Trump could mention Bitcoin in his inaugural speech but even if he doesn’t, the prospect of favourable regulation is broadly positive for Bitcoin - or if we’re more honest - the idea of better regulation could be enough justification to keep the crypto bull run going for now.
Bitcoin
On the weekly chart, we can see Bitcoin (BTC/USD) has been trading sideways around the $100,000 level - with roughly $90,000 as support.
But bigger picture it’s a huge uptrend and we want to trade in line with the trend (as always)
Importantly - it just closed the week back over the critical $100K mark - and it did so with a bullish engulfing candlestick that engulfed the previous 3 weeks.
As a reminder - where the week closed is more important than the high or low of the week - and a weekly close is more significant than a daily close. You can think of the closing price as the price that everybody agreed was the right price for that period.
The final missing piece to the bullish breakout is a weekly close at a new record high.
On the daily chart we are watching the broken trendline as well as the $100k level as support that needs to hold if the breakout is going to happen soon.
But while the price trendline is not especially reliable with only two ‘touches’ or swing points the broken RSI trendline is much more significant and shows a big pickup in momentum that will be needed if the price is to break out.
If the breakout does happen, the first barrier that needs to break is $110,000 but after that $120k then even $130k could come quite quickly given Trump’s inauguration this week.
But - as always - that’s just how my team and I are seeing things, what do you think?
Share your ideas with us - OR - send us a request!
Send us an email or message us on social media.
cheers!
Jasper

ONEUSDT Delivers a Whopping 1,500% Gain and Still Running!ONEUSDT on the 1-Day timeframe has delivered an explosive long trade setup, exceeding all profit targets. The trade has achieved an extraordinary 1,500% profit so far and continues to show strength for further upside momentum.
Key Levels:
TP1: 0.01510 ✅
TP2: 0.01804 ✅
TP3: 0.02099 ✅
TP4: 0.02280 ✅
Technical Analysis:
The trade was perfectly caught using the Risological Swing Trading Indicator , which provided a clear entry at 0.01328 and an SL at 0.01181 for disciplined risk management.
Price action shows a strong uptrend, with consistent support from the Risological Trend Line, pushing ONEUSDT beyond all set targets. Profit-taking at higher levels remains ideal while monitoring for further gains.

THETA looking for 2 to 4 X in Short to MId TermWith BTC getting ready to tap 100k alts are looking primed for movement. Theta is no exception lining up for a breakout that could be a 2 to 4 x in the short term before potential price discovery starts. EMAs and momentum looking solid here. Math says up as of now

WLD | WORLDCOIN & Sam Altman 🌎What if I told you, all you need to do to get free money is to look into this Orb! would you do it?
Worldcoin wants to give everyone free crypto in exchange for scanning their eyeballs which at this time, over 2 million people have signed up
The project has garnered serious attention and has early investors such as Andreesen Horowitz, Coinbase Ventures, LinkedIn Cofounder Reid Hoffman, Solana founder Anatoly Yakovenko,
Polkadot founder Gavin Wood and even the infamous degen SBF himself!
In March 2022, a funding round brought Worldcoin’s valuation to an eye watering $3 billion.
The price of Worldcoin is $2.2 today with a 24hour trading volume of 300 million dollar but
Why are VCs pouring money into Worldcoin and why does Worldcoin want your eyeballs ?!
Tools for Humanity, the company behind Worldcoin, is co-founded by Alex Blania and Sam Altman.you might be more familiar with Sam as he is also the founder behind OpenAI, the company behind the AI chatbot ChatGPT, which took the world by storm since its release in November last year.
The wild success of ChatGPT also spawned an AI arms race between tech giants, which probably
means AI will only get more advanced from now.
The rapid advancement in AI is now worrying the public as AIs are now able to ace the SAT, create increasingly convincing deepfakes, and probably most concerningly, remove the need for humans in the workforce.
Perhaps it’s a coincidence, but Sam has a solution for the identity problem as well as for aiding people whose jobs are taken by AI…Worldcoin. In a world set to be increasingly impacted by AI, Worldcoin purportedly aims to provide individuals a way to verify ‘personhood’ as well as access to universal basic income.To achieve this, Worldcoin is attempting to create a global digital identity and financial network using blockchain technology.
Worldcoin is currently testing its smart contract on the Polygon Network but is in collaboration
with Ethereum Layer2 Optimism to build on and migrate to its network.The team has launched World App in May, a non custodial wallet which enables its users to transact with the Worldcoin token and a few other cryptos, as well as interact with dApps on the Ethereum ecosystem.
However, the key feature of World App is enabling World ID,Its is a global digital passport that allows users to prove their identity while preserving their private information through the use of cryptography and zero knowledge proofs.
World ID can help establish ‘proof of personhood’,meaning to prove that someone is a real, unique human. Proof-of-personhood could be useful to prevent the spread of misinformation by realistic AI-generated content, as well as limiting Sybil-attacks, which are basically online attacks where a single attacker assumes multiple fake identities to gain influence over a network.
As World ID gets more adoption, it’s meant to be used as a method to sign in to websites, mobile apps, and crypto dApps, perform actions such as voting in DAOs or even government elections, as well as receiving aid from NGOs and government programs.
As of now, to obtain a verified World ID,users are required to gaze into the infamous Orb.
The Orb will perform an iris scan and a machine learning algorithm within the Orb will ensure
that the eyeballs scanned are indeed real human irises and not something else, like colored contact lenses or... a cat.
Then the iris scan will be converted to a hashcode or as Worldcoin calls it, ‘IrisHash’. As soon as the code is generated, the Orb supposedly deletes any images from the scan. Within the Orb, the IrisHash is encrypted with a private key before being uploaded on-chain and cross-checked with the existing catalog of IrisHashes.
If the IrisHash does not match any records,it will be added to the catalog. When Worldcoin launches, each verified World ID owner will then be eligible to claim their one-time airdrop of MIL:WLD tokens. which worth 50$ right now
Many have asked why World ID needs iris scans for proof-of-personhood.Supposedly, it’s because the human iris has a very high degree of randomness, making it a much more effective biometric than faces or fingerprints to differentiate between billions of individuals and establish proof-of-personhood.
Unsurprisingly, Worldcoin’s decision to create a global digital identity network using iris scans has raised a lot of eyebrows, understandably so due to its uncanny similarity to what you’d
see in a Black Mirror episode.
Just as Worldcoin was introduced back in October 2021, NSA whistleblower Edward Snowden slammed the use of iris scans. Although Worldcoin has promised that the iris scans will not be saved, Snowden pointed out that the hashcodes produced by these scans are still saved and would match future scans, and that the use of zk-proofs doesn’t justify the use of biometrics for anti-fraud.
There is also pushback from the crypto community- some argued that the ability to use multiple
accounts in Web3 for privacy is a feature, not a flaw; and though most agreed that Web3 is in need of protection against sybil-attacks, it is not necessary to have 100% sybil-resistance
as long as there is a method that can prevent a large enough percentage of sybils.
Additionally, MIT Technology Review released a damning report last year against Worldcoin
on the revelations upon investigating Worldcoin’s field testing.Much of its early field testing is conducted in poorer, developing countries such as Indonesia,Sudan and Kenya where data privacy regulations are weaker and whose communities were the most financially impacted by the pandemic.
The lengthy report revealed that Orb operators were given limited information during recruitment, other than being made aware that their payment is based on the number of signups they achieve.
Operators were then employing strategies such as hosting giveaways of cash and Airpods to encourage sign-ups while providing participants little information on Worldcoin’s campaign.
On top of that, Worldcoin claimed that only an iris scan is needed for sign-ups.However, orb operators also requested email addresses and phone numbers of participants, which a Worldcoin representative denied as part of the data collection practice.
A black market for verified iris scans has even popped up in China where the Worldcoin app isn’t supposed to be available, though the Worldcoin team is attempting to contain the issue.
Furthermore, the project was found to have made contradictory claims of compliance with EU data regulations and was accused of lacking transparency in its data collection practices.
While it seems that Worldcoin is neck-deep in controversies, the project has just received
another $115 million in a series C funding round last month. Onboarding billions of people to create a global digital identity and financial network to distribute universal basic income is a tall order.
With the backlash it's getting from its field-testing and many wondering if Worldcoin is simply
a cover for mass data collection, it remains to be seen whether Worldcoin can deliver on their promises.
Unlike offshore exchanges, none of the U.S.-based cryptocurrency exchanges such as Coinbase Kraken has Worldcoin listed. Worldcoin notes that WLD tokens are not available to persons or companies residing in the United States, however World ID and TFH's World App are still available in the United States.
also the founder of the security agency Slow Mist said that if Worldcoin succeeds, it will be an evil product, but there is a high probability of failure. the iris is almost the most stable and long-lasting unique mark of human beings. The promise of the Worldcoin white paper is good, but it is still possible for hackers to paint a portrait through the hash information!

BTCUSD opportunity to buy backBTCUSD analysis on 12/08/2024:
BTCUSD is showing an upward trend after a correction to around 49000. BTCUSD did not have a deep correction as expected, but it is currently a good trading opportunity.
The current trend for BTCUSD is LONG. Key price levels to note: 56000 - 56700; 55000 - 55200; and 53000 - 53200.
Recommended orders:
Plan 1: LONG BTCUSD zone 56300 - 56600
SL 56000
TP 57700 - 59000 - 60000.
Plan 2: LONG BTCUSD zone 53000-53200
SL 49600
TP 55100 - 57700 - 60000.

$AEROUSD an alt worth watching?COINBASE:AEROUSD Finance (by request):
This altcoin is an AMM for BASE ( NASDAQ:COIN ).
We rejected from the $1 level at the channel bottom as anticipated. This month I hope to see us set a higher low, against the $0.40 cent bottom in July (blue half-circle, around $0.55), ready to re-test the $1 level by the end of the month, assuming CRYPTOCAP:BTC can find its legs. Bear case would be a breakdown of our white trend-line since March, falling to a double bottom at ~$0.40 (red flag)
Remember, the altcoin market is a derivative of the Bitcoin market, so expect the price action of COINBASE:AEROUSD to move with CRYPTOCAP:BTC , but with a higher beta. The exciting setup is that COINBASE:AEROUSD will probably trade with CRYPTOCAP:BTC bullishness - so if we can get into the top half of the channel, there is almost no resistance between ~$1.40 and the channel high at $2.

Great Buying Opportunity in IMX
IMX fell from 3.77 to 1.2, completing the shoulder-head-shoulder pattern. It found a nice support at 1.2. Buying at this level can provide a nice return in the long run.
Considering its recent developments and new projects such as Passport, IMX offers a good investment opportunity.

Ethereum _ Falling Wedge Pattern Breakout. Traget is $3881In Ethereum, a Falling Wedge Pattern has formed and Breakout, also completing the 0.6 Fibonacci Retracement level. The next Target is $3881.

TRBUSDT - single supporting area, holding or not??#TRBUSDT.. well market near to his one of the most important supporting area that is around 77 - 78
You can see in history market very smoothly hold it couple of times.
This time if market hold it again then you can see again bounce from here.
But one thing more is very important that below that level you should cutt n reverse in hand.
Don't be lazy here
Good luck
Trade wisely

ADA | USDT Hey Hey!
Load some ADA here
Its ADA time! Dont miss out on this one!
Some targets in green stop loss in red
Ill keep the trade updated - so check back to see if im still in it or what is happening!

FIL is breaking out from Trendline!!! BuyFIL did a breakout from the trendline and the bearish trend is broken, possible to retest at 0.5 of fib and the demand zone will be our new HL.
Entry: 5.896
Tp: 7.37
Sl: 5.05 if 4 hourly candle close below this.

"Ethereum Technical Analysis: Potential Bullish Breakout from FEthereum update
Ethereum is currently trending within a rising channel, as shown in the chart. It has formed a falling wedge pattern, similar to one it made a few weeks ago, and bounced by approximately 19% according to the pattern.
If Ethereum breaks out of this wedge, it is likely to bounce by almost 19% again. However, if it breaks out of the rising channel, the chart will be invalidated.
In the event that Ethereum does break out of the wedge, it would be a good opportunity to open a long position.
Stay tuned; I will keep updating

BTC ETF! What Is Going To Happen In Markets ?In the next 25 days, the approval decision for the #Bitcoin ETF is anticipated. The market reaction to such news is often influenced by three types of news psychology:
> Sell The News: Traders may opt to sell their assets once the news is officially announced.
> Sell Before The News: Some investors may choose to sell their holdings in anticipation of the news, trying to secure profits or avoid potential losses.
> Buy The News: If the news is positive, there might be a surge in buying activity as investors seek to capitalize on the favorable outcome.
With the BTC ETF approval looming just 24 days away, it's crucial to consider these scenarios. The second scenario, "Sell Before The News," suggests that some traders may take a cautious approach by selling off assets ahead of the announcement. Following the news, the third scenario, "Buy The News," could come into play if the outcome is positive. Conversely, in the event of unfavorable news, the first scenario, "Sell The News," may result in a market sell-off.
Investors are advised to make their decisions based on their risk tolerance and market analysis, keeping these news psychology scenarios in mind.
This chart is likely to help you make better trade decisions if you consider upvoting it.
I would also love to know your charts and views in the comment section.
Thank you
