All Aboard XRPI think from here we have built a pretty strong support around $2.94-$3. I expect crypto to take over the gold rally as the treasury looks into creating a digital asset reserve first starting with bitcoin. The government shutdown should give boost to this initial rally.
-This is not financial advice good luck!
Cryptos

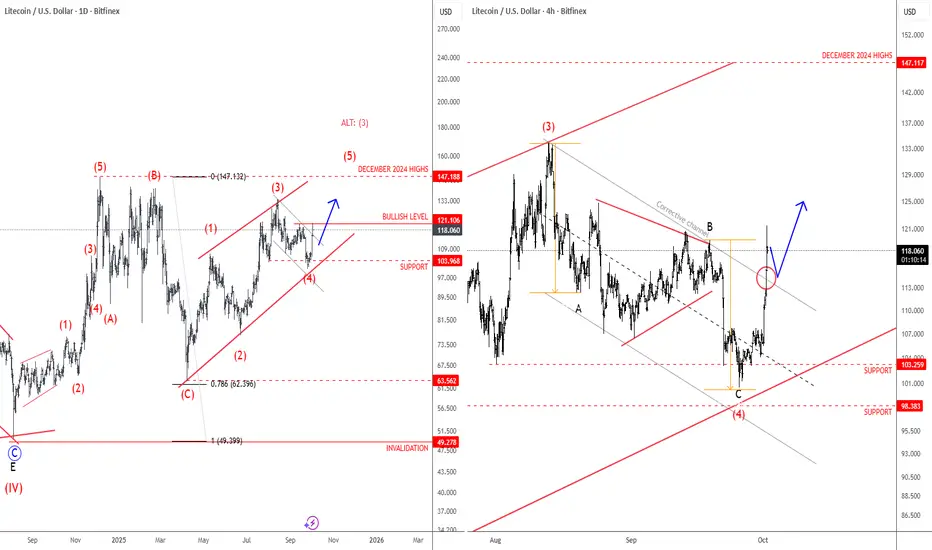
Litecoin Is Still Eyeing December 2024 HighsLitecoin turned lower recently, but we believe this is just another corrective retracement within a broader bullish trend, which has been showing higher swing lows since the rebound from the 78.6% Fibonacci level back in April. We expect that retracement down from the December highs will be fully retraced, meaning there’s room for a push up toward 147 as illustrated on a daily chart. It can be looking for wave (5) of a diagonal pattern, or alternatively, maybe even wave (3) if it extends decisively above upper diagonal line and goes for 200 area. In the 4-hour chart, we got a sharp rebound from projected support and back above channel resistance line after we noticed an ABC correction, so bulls are back, and we may easily see more gains toward December 2024 highs, just watch out for short-term pullbacks.
Uni 4H Trade IdeaHere is a trade idea for UNI on 4 hour TF. Entry & Exit Points are given. NFA. DYOR.

HUMAUSDT - shiny coin!3d chart showing a breakout of descending channel after 120days of consolidation ... retest is running
patience must be rewarded.
Best regards:
Ceciliones🎯

LIGHT CONFIRMS THE MAIN TREND - BREAK VIEWAfter the confirmation of the main trend zone, there is a good chance this coin is able to break to a new trend level, with the possibility of up $2

NEARUSDTNear Protocol (NEAR) is a layer-1 blockchain designed to be fast, scalable, and user-friendly. It uses a unique sharding technology called Nightshade, which allows the network to process thousands of transactions per second with low fees. NEAR focuses on developer and user experience—wallets can use human-readable names instead of complex addresses, and apps are built to feel like Web2 platforms.
Its token NEAR is used for transaction fees, staking, and governance. The ecosystem is strong in DeFi, NFTs, and Web3 apps, and it positions itself as a competitor to Ethereum, Solana, and Avalanche.

BTC LOOKS POSITIVE ON LOW TIME FRAME - UPDATE 27-09-2025BTC/USDT Update
On the low time frame, BTC has turned positive, showing signs of recovery after consolidation.
Price action is now trending upward toward the main trend zone, which will be the key resistance area to watch.
Key levels:
Low time frame zone → currently acting as support after the bounce.
Main trend zone → upcoming resistance. A clean breakout and confirmation above this level would strengthen the bullish case.
Upside scenario: If BTC can reclaim and hold above the main trend zone, momentum could expand strongly, shifting structure back into an uptrend.
Downside risk: Failure to break into the main trend zone could keep BTC stuck in sideways or corrective action.
📌 Summary
BTC is up on the low time frame → short-term momentum is bullish.
Next target: main trend zone for confirmation.
Break above main trend = uptrend confirmation; rejection = sideways risk.

BMNR HIGH PROBABILITY SETUP SOON!!!🚨 BMNR HIGH PROBABILITY BUY SETUP 🚨
* Here We Can See Clearly The Next Potential Move For BMNR Coming Hours/Days.
* Keep Your Eyes Close On Your Trading Positions.
* Happy PIP Hunting Traders.
FXKILLA.

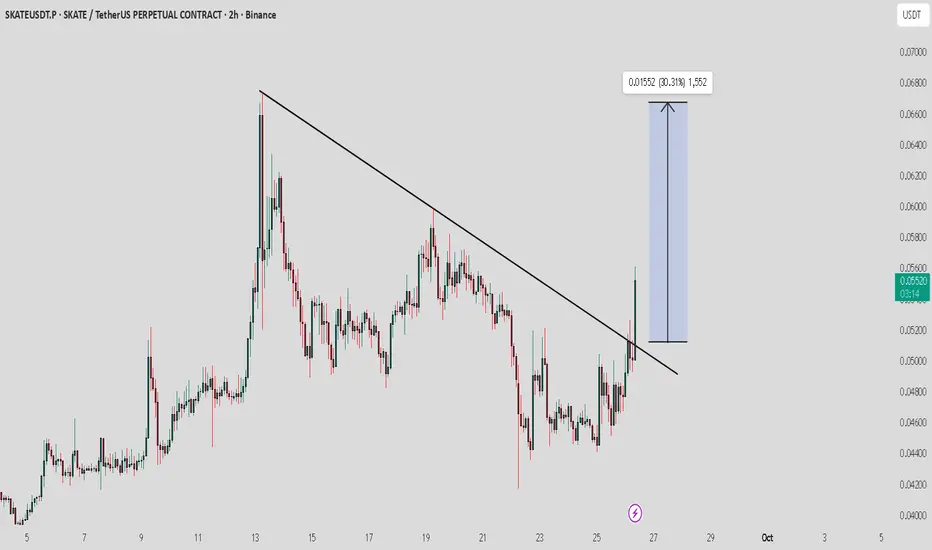
SKATE / USDT : Breaking out with strong potentialSKATE is breaking out from trend line resistance with strong potential. If momentum holds, we could see a sharp short-term rally of 20–30%.
Always manage risk properly and wait for confirmation of the bullish move.
BTCUSD on the 30m timeframe1. Trend Context
BTCUSD on the 30m timeframe remains in a clear downtrend, forming consistent Lower Highs and Lower Lows.
2. Key Zones
SZ (Supply Zone): 114,250 – 114,750. Origin of the strong selloff, major resistance if price retraces upward.
SR (Structure Reversal): 113,000 – 113,250. Previously marked a short-term structural shift, now likely to act as dynamic resistance.
DZ (Demand Zone): 111,200 – 111,750. Price is currently testing this zone, which serves as short-term support.
3. Trading Scenarios
If DZ holds, a short-term bounce toward SR is possible.
If price rejects at SR, it offers a favorable short setup in line with the prevailing downtrend.
If DZ breaks, the downtrend may extend with a target around 110,000 or lower.
Please like and comment below to support our traders. Your reactions will motivate us to do more analysis in the future 🙏✨

Has ATTENTION PEAKED on BTC & Crypto?Examining the daily BTC/USD HTF chart, several indicators suggest a potential market top scenario reminiscent of previous Bitcoin peaks. The chart highlights three core components: RSI, MACD, and price action versus trendlines. Notably, the recurring MACD pattern—with a sequence of five yellow-labeled local peaks and valleys—has appeared near each major high, further strengthened by the visible red arrows marking historical tops.
Context:
The MACD panel shows a clear recurring pattern—each market peak coincides with closely-clustered MACD bursts and subsequent reversals, labeled (1)-(5), that echo the structure identified at Bitcoin’s previous all-time highs in early 2021 and again in mid-2025. These bursts typically reflect maximum market participation and social/media attention, followed by rapid declines as momentum wanes.
RSI values in both instances remain elevated but subside as price fails to break the red resistance lines, indicating weakening bullish strength.
The price chart itself displays a series of failed attempts to break above strong horizontal resistance (red lines), directly aligning with previous market highs. Each peak aligns with a spike in market excitement and a corresponding cluster of MACD peaks.
The long-term green trendline underscores Bitcoin’s structural uptrend but also frames the risk—should price lose the trendline, historical price action suggests deeper corrections are possible.
Trading:
Given the repetition of this MACD burst pattern and multi-timeframe rejection at horizontal resistance, there is strong evidence that peak market attention and buying pressure for BTC have likely already occurred for this cycle. Previous instances saw significant corrections following similar technical conditions, suggesting caution is warranted.
Short Profit Target: Initial target for shorts could be set near the green trendline support, around $85,000-$90,000, with more aggressive bears aiming for major swing low zones near $65,000.
Short Stop Loss: Tight stop loss should be placed just above local highs, at $117,000-$120,000, to guard against unexpected breakouts to new highs.
Risk/Reward: Consider a minimum 2:1 ratio, moving stops to break-even if there is rapid price rejection and MACD follows through with sustained bearish momentum.
This analysis contextualizes both the technical signals and price action in terms understandable to traders and readers. Historical patterns suggest a strong likelihood that “attention” has peaked, reinforcing the probability that the next major move for BTC will be corrective rather than impulsive to the upside.
Always use position sizing and risk management tailored to each portfolio’s size and goals.

BNB HIGH PROBABILITY SETUP SOON!!!🚨 BNB HIGH PROBABILITY BUY SETUP 🚨
* Here We Can See Clearly The Next Potential Move For BNB Coming Hours/Days.
* Keep Your Eyes Close On Your Trading Positions.
* Happy PIP Hunting Traders.
FXKILLA.

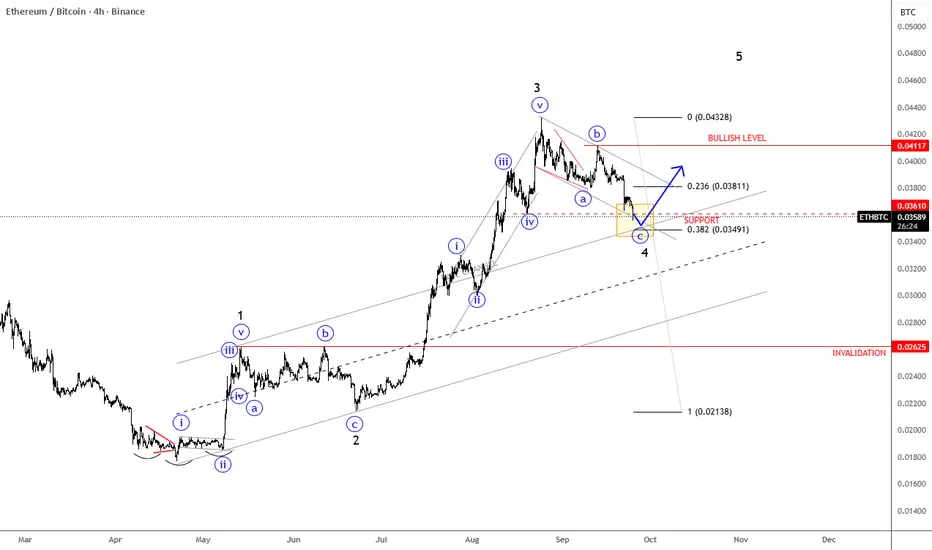
ETHBTC Has A TextBook Bullish PatternETHBTC Has A TextBook Bullish Pattern, as we see an ongoing five-wave bullish impulse by Elliott Wave model
ETHBTC pair is slowed down after a massive extension higher into wave 3, and it's right now testing important 0.035 - 0.034 support zone within an abc correction for wave 4. It's also trading at an important 38,2% Fibonacci retracement and base channel upper line, which can act as a strong support. So soon watch out for a bullish continuation within wave 5, especially if we see a rebound and recovery back above channel resistance line near 0.038 level. Bullish confirmation is above 0.041 level, while the invalidation level is at 0.026.
BAD NEWS for Bitcoin :(. BE CAREFUL!My last Prediction was PERFECT . i know this will UPSET many bulls, but this is how the MARKETS WORK. After a strong uptrend and extreme greed environment, its time for Bitcoin to CORRECT and have strong PULLBACK. Look at the channel and trendlines, I expect bitcoin to reach a price of 100k/96k in the coming weeks. That will be a GOOD BUY opportunity. BE CAREFUL AND STAY WISE.
See My Previous PERFECT prediction:
BINANCE:BTCUSD COINBASE:BTCUSD CRYPTO:BTCUSD OKX:BTCUSD

BELDEX - Privacy Coin or Manipulated Pump - Should I Join In?With the charts, we always focus on two things: thefundamental analysis and thetechnical analysis. On one side, the breakout above 0.0824–0.0859 looked clean, momentum was there, and the market structure shifted bullish. However, the token gains a $700M market cap but has only ~1,000 holders. That mismatch actually is a problem
BDX is bullish based on current price action and trading signals. The oscillators and moving averages flash Strong Buy. If I just looked at that, I could say this is a simple uptrend and an easy trade. But price candles show long wicks, sharp pushes, and limited corrections. That is not the behavior of natural accumulation. That is the footprint of fast money in and out.
If I were to focus only on the short term, I’d seen the price exeeded the Resistance level (0.081-0.086) and bought it. But if I focus on the bigger picture, it looks like BDX is being manipulated by concentrated capital. That’s why it keeps climbing while the broader crypto market is stuck at Fear & Greed Index 41. The rest of the market is tired, but BDX is still running. Unusual, right?
As traders, we cannot beat the market. But we don’t need to beat it; we only need to make money. And there are many ways. With BDX, the way is simple: accept this is high risk, short-term momentum. Don’t marry the coin, don’t believe the hype. If you play it, you play the trend.
For me, that means:
Entry (EP): 0.087 – 0.090
Stop Loss (SL): 0.078
Target (TP): 0.103, 0.14, 0.16, 0.19
That’s how you treat a setup. Manage risk. No more than 5–10% of capital in such a trade. Because if this is truly manipulated, it can disappear just as fast as it rose.
If you can’t make money slow, you won’t make it fast. BDX might be exciting right now, but excitement fades. Trading is not about chasing pumps; it’s about managing risk and staying alive.
So, should you join in? Only if you know your plan before you press buy.
Thanks for reading. Stay sharp.
TheCryptoFire.

Fartcoin - Double support, strong rebound potentialFartcoin is sitting right on a double support level, which gives the chart a solid base. This setup signals strong rebound potential. If momentum builds from here, we could see a sharp bounce.

$BTC beautiful range to play i will looking for short!lower time frame rejection call lead us for more downside ! keep eye on it..

BTCUSD: Downtrend remains dominant after EMA rejection(1h chart)Yesterday, the price followed the bearish scenario as it was rejected at the EMA and resistance zone.
Trend: The short-term downtrend remains intact, with the EMA sloping downward.
Nearest support: 111,800 – 112,000. A break below could extend the move toward 110,000 – 109,000.
Nearest resistance: 113,500 – 113,800. A breakout here would invalidate the bearish outlook
.
📌 Outlook for today : Bearish continuation is the primary scenario. Wait for a candle close below support for confirmation. Alternatively, if price breaks strongly above the EMA Ribbon, a short-term corrective rally may develop.
Please like and comment below to support our traders. Your reactions will motivate us to do more analysis in the future 🙏✨

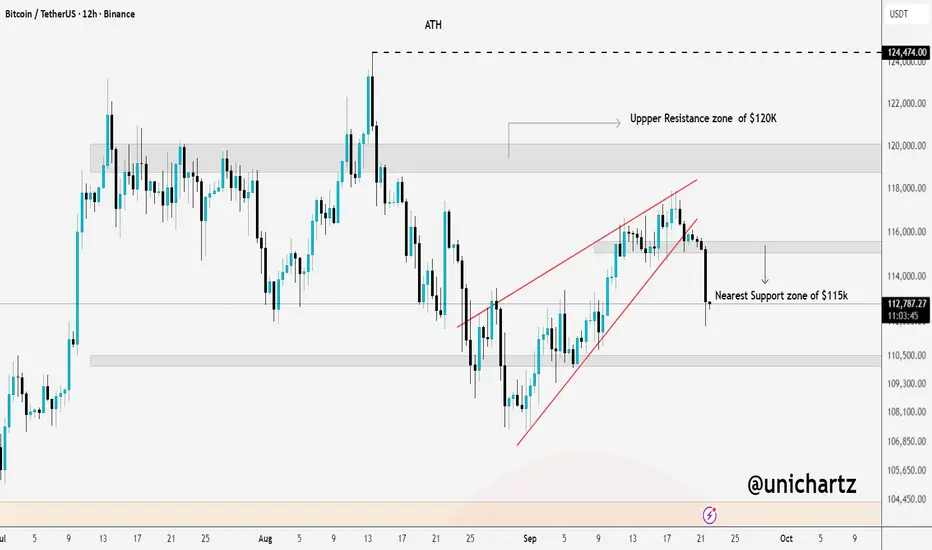
BTC Testing Critical Levels: Will $110K Hold the Line?What we said earlier, I hope many of you are safe.
CRYPTOCAP:BTC has broken down from the rising wedge and already sliced through the $115K support zone. The next major level to watch is the psychological support at $110K. If buyers defend that area, the market could stabilize, but if $110K fails, we’re looking at a deeper correction ahead.
In short: $115K is gone, $110K now becomes the crucial line in the sand.
As long as I am here, Bitcoin isn't going anywhere!''We still see downward targets to at least 92,425$ in the medium term and even lower in the long term to 45,379$.
The alts such as XRP and ETH, should follow suit with BTC.
SPX should continue to see a pump to 6,860$ before a massive sell off occurs..... I don't know what will cause this sell off a war, financial crisis or trump opening his mouth but something will kick off a set of domino chains that should make us see a financial crash as bad as the 2008 crash....... you heard it here foretold first and a lot of you will laugh but I will document this whole journey to the ground, with every twist and turn.''
>>>>>>> THIS WAS STATED IN OUR MOST RECENT POST.
>>>>>>> NOTHING CHANGES ON OUR CHARTS, WE CAN SEE WEEKS AND MONTHS AND YEARS INTO THE FUTURE.
I WILL PROVE ALL DOUBTERS WRONG, YOU STILL HAVE TIME TO OFFLOAD BEFORE THE BIGGEST CRASH IN CRYPTO AND STOCK HISTORY OCCURS WITHIN SUCH A SHORT SPACE OF TIME.
Things have been sped up x100 over this weekend.
I am not here spreading FUD, I am here warning everyone.
Go on our page and follow price for the past 2 months, you'll realise we have this all under control.
and yes, we have been predicting the pumps too including on SPX, but we are near the top and things have become exhausted.

NEAR/USDT - Bearish Outlook for short Term BINANCE:NEARUSDT NEAR/USDt - Channel Breakout with strong volume, looking for strong bearish in upcoming days.
As altcoin momentum intensifies, Near Protocol
NEARUSDT is rapidly emerging as a standout contender in the crypto space. Fueled by strong fundamentals and recent bullish market trends, NEAR’s rise has caught the attention of both retail and institutional investors.
With NEAR now bridging to Solana and TON via Chain Signatures, the future looks promising. Wondering where it’s headed next? Dive into our in-depth NEAR Price Prediction
However, if bearish pressure takes over and breaks the $2.0 to $1.8 support zone, a further decline is likely, with the $1.0 level becoming the next probable target.
Support by Likes and Comments.
Thank you.

$HEMI long idea coin I'm seeing another good move forming inside $HEMI coin. It could deliver another 30 to 50 percent gain, but the entry zone here is quite wide. you can enter with low leverage if you manage your risk properly. am in the trade with 8x lev

WLFI / USDT : Attempting breakout from horizontal resistanceWLFI/USDT is attempting to break out from horizontal resistance. If the breakout is confirmed, a short-term bullish rally towards $0.25 – $0.30 can be expected.
Always wait for confirmation before entering and manage risk properly.
