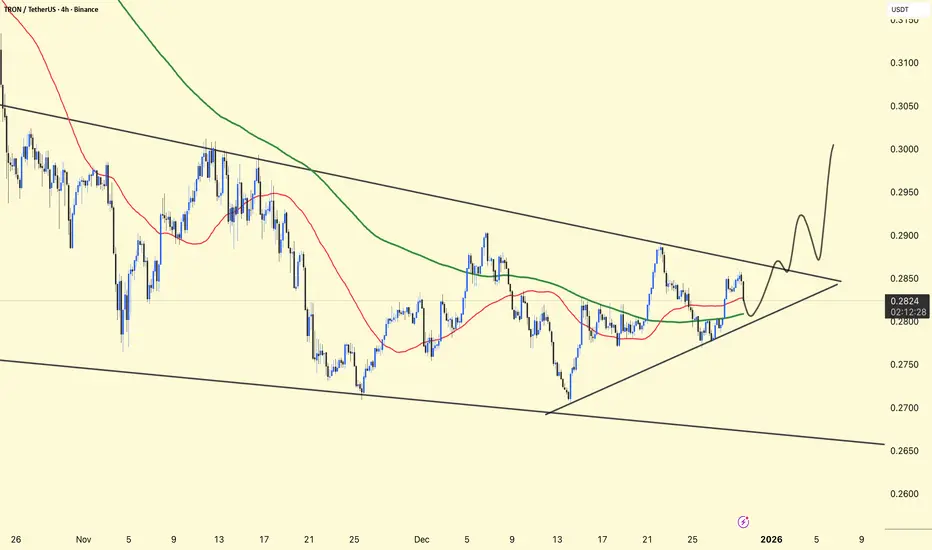
TRXUSDT – 4H Chart Update & Analysis. TRXUSDT – 4H Chart Update & Analysis
Price is compressing inside a descending broad channel with a short-term ascending triangle forming → volatility squeeze near the apex.
Price is hovering around the 50 MA
Immediate Support: 0.278 – 0.275
Major Support: 0.268 – 0.265
Resistance: 0.285 – 0.288
Breakout Zone: 0.295 – 0.305
Higher lows + flat resistance = pressure building.
A 4H close above 0.288 can trigger a sharp upside expansion (as projected).
Rejection keeps the price ranging inside the structure.
⚠️ Trade only after confirmation.
NFA | Risk management required
Cryptosandersofficial
USDT.D – 1D Chart UpdateUSDT.D – 1D Chart Update
Structure forming a rising wedge
Rejection near 6.6% resistance
Momentum weakening below trendline
Breakdown scenario: drop toward 4.4%–4.2% zone (marked)
👉 Falling USDT dominance = bullish for BTC & Altcoins
Wait for confirmation. Not financial advice.

BNBUSDT – Small Chart Update
BNB is holding above the rising support zone.
As long as price stays above $850–860, upside toward $920 → $1,000+ remains possible; a break below support may lead to a deeper pullback.
DYOR | NFA.

BTC/USDT 4-hour short chart update!!Price is reacting at the rising trendline support.
Holding above 84.5K keeps the bullish structure intact; a breakdown may bring further downside.
DYOR | NFA.

BTC/USDT 1DAY CHART ANALIYSIS. BTCUSDT chart analysis and a brief update.
BTC remains above the key daily demand zone (green box) of $100,000–$104,000. Previous visits to this level have generated strong bullish momentum.
Pattern: The chart setup indicates a rounded bottom, and if the support zone holds, BTC is likely to move higher.
Upside Target: If demand returns, a bullish reversal towards $123,000–$124,700 remains anticipated, following the 46% rally seen after a similar pattern previously.
DYOR | NFA

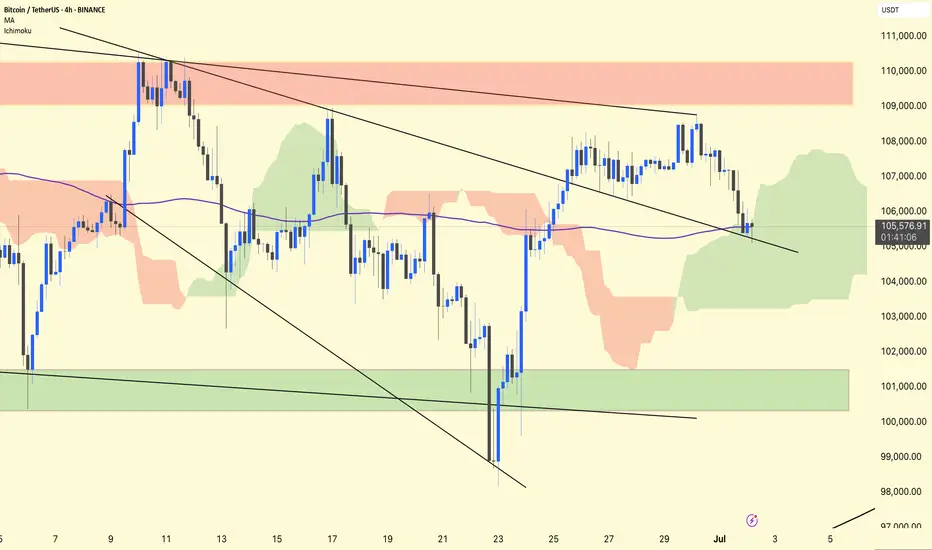
BTC/USDT 4H Analysis.
BTC remains in a retest phase after breaking out of the first descending broadening wedge.
The price has returned to test the upper wedge trendline, which is now acting as support around ~$105,500.
The purple 1 00-period MA (~105,570) overlaps this retest zone, adding additional confluence to the support.
Ichimoku
BTC is inside a green cloud, indicating indecision but not a confirmed trend reversal.
The cloud provides dynamic support in the ~$104,500–105,500 area.
Stay alert!
ETH/USDT 1DAY CHART UPDATE !!ETH has broken out of a long-term downtrend (black diagonal trendline) and is now in a consolidation phase below the $2,800–$2,850 resistance.
The price is currently $2,612, showing hesitation below the key horizontal resistance.
Resistance Zones:
$2,800–$2,850: Key horizontal resistance. Breaking above this confirms bullish continuation.
$3,200 and $3,600: Medium to long-term bullish targets.
Support Zones:
$2,000–$2,200: Strong horizontal support + ascending trendline + 50 EMA (red line)
$1,410: Key long-term support (unlikely to be tested soon unless the market reverses)
ETH breaks and closes above $2,850 ➝ $3,200 → $3,600 → $3,800+ likely to rise
The structure suggests that a higher low will likely form before the breakout.
If ETH rejects at $2,850, expect a retest of $2,000–$2,200 (golden zone)
This would create a bullish higher low setup and could be a strong buy-dip opportunity.
Thanks for your support!
DYOR. NFA
