NEAR Traders Are Being Set Up Is This the Final Trap Before DropYello Paradisers! Are you watching what’s happening with #NEAR right now? Because this move might be the last warning before a much deeper drop. We’ve spotted a series of red flags, and the chart is speaking loud and clear smart money is positioning, and it’s not on the bullish side.
💎#NEAR respected the descending resistance and failed to break above it, which confirms ongoing weakness. The price action on higher time frames shows a probable bearish structure there is a major probability for the downside move., further we have seen a clean divergence as well, as long momentum sustained within the supply zone, we can expect a further move down toward the support level of 1.616, which aligns both as a structure level and a moderate demand zone.
💎#NEAR broke lower trigger line of the buying climax (climactic action bar) with a strong momentum candle after swept the upper trigger line of buying climax. strongly suggesting that institutional players are offloading and preparing for more downside move according to volume spread analysis (VSA). We’ve seen a buying climax on the retracement, followed by a climactic action candle with ultra-high volume a textbook probability of smart money distribution.
💎If momentum holds, the probability of next major level sits around 1.49, which is a major support level that could be tested soon.
💎If #NEAR manages to break above the key resistance at 1.91 with a strong momentum candle, this whole bearish probability would be invalidated, and we could instead see a bullish continuation. As always, we let price confirm our bias.
Discipline is key, Paradisers! The charts may look volatile, but this is where professionals thrive and amateurs panic. Don’t let emotions guide your trades. Wait for clear confirmation and manage risk like a pro. Strive for consistency, not quick profits. Treat the market as a businessman, not as a gambler.
MyCryptoParadise
iFeel the success🌴
Cryptosignal

OKB Traders Are Being Set Up Is This the Final Trap Before DropYello Paradisers! Are you watching what’s happening with #OKB right now? Because this move might be the last warning before a much deeper drop. We’ve spotted a series of red flags, and the chart is speaking loud and clear smart money is positioning, and it’s not on the bullish side, Even more importantly, #OKB swept the upper trigger line of buying climax. The price action on higher time frames shows a clear bearish structure there is a major probability for the downside move.
💎#OKB respected the descending resistance and failed to break above it, which confirms ongoing weakness. #OKB momentum has now clearly shifted to the downside and mitigate the fair value gap, as long momentum sustained within the supply zone, we can expect a further move down toward the minor support level of 109.
💎#OKB swept the upper trigger line liquidity of the buying climax, strongly suggesting that institutional players are offloading and preparing for more downside move according to volume spread analysis (VSA).
💎#OKB swept buy side liquidity with upthrust test which confirmed the weakness, if momentum holds, the next major target sits around 106 that could be tested soon.
💎If #OKB manages to break above the key resistance at 120.6 with a strong momentum candle, this whole bearish probability would be invalidated, and we could instead see a bullish continuation. As always, we let price confirm our bias.
Discipline is key, Paradisers! The charts may look volatile, but this is where professionals thrive and amateurs panic. Don’t let emotions guide your trades. Wait for clear confirmation and manage risk like a pro. Strive for consistency, not quick profits. Treat the market as a businessman, not as a gambler.
MyCryptoParadise
iFeel the success🌴

GOLD LONG, B SetupXAUUSD on the 1H timeframe shows a bullish continuation structure after reacting strongly from the bullish order block zone around 4580–4590. Price has respected this demand area and printed higher lows, indicating renewed buying interest. A break of structure has already occurred, supporting further upside momentum. As long as price holds above the 4610 support zone, bullish bias remains intact. Upside targets are positioned near 4645 as the first resistance and 4670 as the extended target.
Only for educational purpose only

BCHUSDT Is Providing Opportunity Only Smart Traders Will Catch Yello Paradisers! Are you watching this closely enough? Because #BCH respecting critical ascending support, and if you're not prepared, you might miss out on a huge opportunity. Additionally, we are seeing selling climax has been formed, a classic probability that institutional buyers are stepping in. This is where things start to get exciting.
💎#BCH overall structure is bullish on higher time frames and on retracement #BCH respecting the ascending support. Further the Relative Strength Index (RSI) is showing clear divergence, adding more weight to the bullish case.
💎#BCH holds momentum within the Fair value within the demand zone, the setup remains high probability targeting an initial upside move toward 645, a key moderate resistance and structural level.
💎#BCH formed selling climax, a bullish probability that confirms accumulation. During the retracement we saw a selling climax followed by a climactic action candle with ultra-high volume a textbook probability that smart money is loading up. Most importantly, if it breaks the above the upper trigger line of the selling climax (climactic action bar) with a momentum candle, these are the clearest probabilities that the big players are positioning for upside. If this momentum sustained, #BCH could climb toward 665, which is a major resistance to watch.
💎If #BCH fails to hold bullish momentum and a momentum candle closes below 561, the current bullish probability becomes invalid. In that case, we could see further downside pressure.
That is why Paradisers, we are playing it safe right now. If you want to be consistently profitable, you need to be extremely patient and always wait only for the best, highest probability trading opportunities only on confirmations.
MyCryptoParadise
iFeel the success🌴

ICP/USDT – This Accumulation Breakout! Get Ready to FLY!ICP has finished its accumulation phase and is now reclaiming a major structural level after a prolonged downtrend. This is not a random move — this is a clear shift in positioning.
Price is holding above the reclaimed zone, signaling acceptance and intent to expand higher. As long as this level holds, upside continuation remains the dominant scenario.
This is where early positioning matters — not after expansion starts.
Entry: 3.78 - 3.3
Stop Loss: 3.05
Target 1: 5.70
Target 2: 7.24
Final Target: 9.37
Bias: Bullish continuation
Invalidation: Daily close back below 3.05

SOL/USDT – This Reclaimed Level Could Send SOL Flying Again#SOL has finally reclaimed a major resistance zone, now acting as strong support. This level previously rejected price hard, and the successful reclaim signals a potential trend continuation.
Momentum is clearly shifting bullish, and as long as price holds above this reclaimed zone, the upside scenario remains highly favored. This is the type of structure that often leads to fast expansions once liquidity above gets targeted.
Bias: Bullish continuation
Invalidation: Loss of the reclaimed support zone
📊 Risk/Reward: 1:2
⚠️ DYOR (Do Your Own Research)

HNT Bull Trap… or the Start of a Massive Move?Yello Paradisers, did you notice what just happened with HNT? While most crypto traders were panicking due to the lower lows, we spotted a hidden bullish divergence forming, and it appears the market is now waking up to it.
💎 After weeks of trending inside a clean descending channel, #HNTUSDT just gave us the first real sign of a potential reversal. The move began with a sharp liquidity sweep below the descending support, trapping late sellers and triggering fresh demand exactly inside the major support zone between $1.307 and $1.363.
💎Zooming in, the MACD is showing a clear bullish divergence, price making lower lows while the MACD formed higher lows. Right after that, we got a bullish crossover, confirming momentum is shifting back in favor of the bulls. These are the exact kind of high-probability signals we wait for, and they’re not common.
💎Now that the price has broken above the descending structure, all eyes are on the next key levels. If HNT can maintain this momentum, we expect a test of the $1.445 area as minor resistance, where a temporary pullback could happen. However, if that level is claimed with strength, the next zone to watch is $1.539, followed by the strong resistance range between $1.730 and $1.74. This is where we'll reassess everything and prepare for either a continuation or rejection.
💎On the flip side, if #HNT breaks down and closes below $1.258, this whole bullish scenario will be invalidated. At that point, we’ll consider this a failed breakout and prepare for downside continuation. Until then, the structure looks strong and healthy.
Discipline, patience, and strategy always win.
MyCryptoParadise
iFeel the success🌴

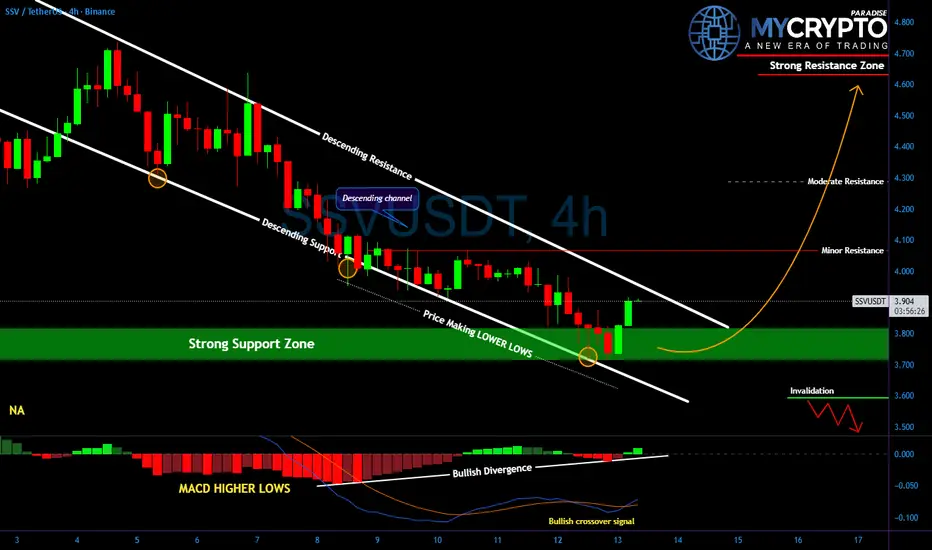
Traders Will Miss This SSV/USDT Reversal Until It's Too LateYello, did you catch that move off support on #SSVUSD? Because what just happened could be the beginning of a major shift, and latecomers might not get a second chance.
💎#SSVUSDT has been moving inside a clean descending channel, forming lower lows with each leg down, but now the price is bouncing right from the strong support zone that's held firm before. The reaction is already showing strength, and it's happening alongside a bullish divergence on the MACD, with higher lows forming while the price was making new lows. That’s a key early signal that momentum is shifting.
💎This type of confluence doesn’t happen by accident. The market is telling us that the sellers are exhausted, and smart money may already be loading up.
💎The structure is clear: if price breaks above the descending resistance, the next logical targets sit around 4.05, then 4.30, and ultimately 4.70 if momentum really kicks in. On the flip side, a clean break below 3.70–3.60 invalidates this reversal scenario and opens the path back toward 3.50.
Be patient, wait for structure to confirm, and stick to your plan. That’s what keeps you consistent while others chase.
MyCryptoParadise
iFeel the success🌴
ZKP/USDT – This Accumulation Could Be the Next Big BouncePrice has been bleeding inside a clear downtrend, but the momentum is now slowing down. We are seeing strong accumulation at the base, right after price tapped the demand zone and reacted sharply.
The descending trendline is being pressured, and any sustained hold above this area increases the probability of a trend reversal rally. This is the type of zone where smart money typically builds positions before expansion.
If price continues to respect the accumulation base, the path toward higher liquidity becomes very clear.
Entry Zone: Current price area
Stop Loss: 0.1272
Target 1: 0.15427
Target 2: 0.17220
As long as the base holds, the bullish scenario remains valid.
Failure to hold the base invalidates the setup.

BREV/USDT Bullish Continuation ready to explode??BREV/USDT – Demand Reclaim Long Setup
Price has reacted strongly from the demand zone and reclaimed the key level above it. Structure is shifting bullish, opening the door for continuation toward higher liquidity.
Entry: 0.3968 – 0.4057
Stop Loss: 0.3648
TP1: 0.4542
Final TP: 0.5205
Bias remains bullish as long as price holds above the reclaimed demand zone

This Breakdown Could Get Ugly for FARTCOIN Holders…Yello Paradisers! Is FARTCOINUSDT about to fall off a cliff? After printing a clean bearish divergence and breaking down of a rising wedge pattern, the warning signs are stacking up fast. If you’ve been following our latest market updates, this setup should feel very familiar and very dangerous.
💎Recent price action developed within a rising wedge, which has now broken to the downside, typically a bearish continuation signal. Before this, price had been grinding higher with weakening momentum, showing signs of exhaustion as it repeatedly tested resistance. Most importantly, we’ve now seen a clean internal Change of Character (I-CHoCH), confirming that bullish momentum is fading. Price also left behind a Fair Value Gap (FVG), which could still be filled before any further drop. This only adds confluence to the bearish scenario we’ve been tracking.
💎Momentum-wise, a strong bearish divergence appeared on the histogram just as price tapped into the key resistance zone. The red zone above 0.32 is acting as a major supply wall. Unless we see a confirmed candle close above it, the current structure favors the downside. That’s the invalidation level, if bulls reclaim it, the short thesis is off the table. Until then, bears are in full control.
💎Looking ahead, the first key support lies at 0.2713. A breakdown below that could quickly open the door toward the major support zone around 0.2300—a potential -20% decline from current levels. The combination of a rising wedge breakdown, bearish divergence, and heavy rejection at resistance gives this setup a high-probability bearish continuation outlook.
🎖But it never is, and never will be a free ride. Make sure you play it smart, Paradisers; the next 6–9 months will be juicy for some and painful for others. Discipline, patience, robust strategies, and trading tactics are the only ways you can make it long-term in this market.
MyCryptoParadise
iFeel the success🌴

FHE/USDT ABOUT TO EXPLODE? This Setup Looks TOO CLEAN!After a long downtrend, FHE finally shows a strong reaction from a key support zone — and this is where things get interesting 👀
Smart money doesn’t buy highs… they position where risk is tight and structure starts to shift.
Price is now holding above support with a clear impulsive move, signaling potential trend reversal or continuation play 📈
As long as this base holds, upside expansion remains very attractive with a clean invalidation below.
This is the type of setup traders wait days — sometimes weeks — to catch.
Low risk, high reward, and very clear levels on the chart 🎯
I’ve mapped everything directly on the chart.
Now the only question is… will price respect the level or trap late sellers? 🤔
Not financial advice. Always manage your risk.
Drop your bias below — bullish or fake move?
If you like clean, no-nonsense price action & smart money setups, don’t forget to BOOST 🚀, LIKE 👍, and FOLLOW for more high-probability crypto ideas.
Let’s hunt the next big move together 💰🔥
#FHE #FHEUSDT #Perpetual #CryptoTrading #Altcoins #PriceAction

MYXUSDT Bounce from Major Demand Zone – Bull Reversal Loading?Traders, eyes on MYXUSDT.P! 📈
After a steep downtrend from highs, price has finally hit the key order block demand zone (green area ~4.80-5.16) on the daily/weekly structure.
We saw a classic liquidity sweep below (red zone ~4.56), trapping sellers, followed by a strong bullish candle reversal – this screams potential trend change!
Bullish setup:
Entry: Current levels or pullback to OB support (~5.00-5.16)
Target 1: $5.80
Target 2: $6.40-6.80
Extension: Back to $7.00+
Invalidation: Close below $4.56 (bear trap fails)
Higher timeframe aligns with accumulation – could be the bottom!
Are you bullish on MYX here or waiting for more confirmation? Share your thoughts below! 👇 🔥
If you like precise, no-hype analyses like this, smash that BOOST 🚀, LIKE 👍, and FOLLOW for more daily crypto setups. Let's catch the next big move together! 💰
#MYX #MYXUSDT #Crypto #PerpTrading #Altcoins

LPTUSDT About to Break Out or Break Down? Yello Paradisers! Have you been watching LPT sink deeper into the descending channel and wondering if it’s finally time for a reversal or if another trap is about to wipe out impatient traders again? This setup is shaping up to be one of those textbook opportunities where discipline will separate winners from losers.
💎#LPTUSDT has been moving inside a clear descending channel, with price action consistently printing lower lows and respecting both resistance and support lines. However, it has now reached a major inflection point. The asset is sitting right on a strong support zone, a level that has previously attracted demand and triggered significant reactions in the past. What makes this setup even more intriguing is the convergence of technical signals that could be indicating a short-term bullish reversal.
💎On the momentum side, the MACD is flashing a bullish crossover, and we’re also spotting a bullish divergence between the price and momentum. This is often one of the earliest signs of trend exhaustion in a downtrend. These signals become even more meaningful when combined with the current price position within the descending channel structure. If the support holds, and the divergence plays out, we could see a strong rally first into the minor resistance area near $3.00 and potentially into the major resistance zone above $3.10.
💎However, the invalidation level is clearly defined at $2.782. If the price is accepted below this level, the setup is no longer valid, and the idea must be abandoned immediately.
The market is full of noise, and fake breakouts are designed to punish the emotional and reward the disciplined. Be the latter. Stay sharp, Paradisers.
MyCryptoParadise
iFeel the success🌴

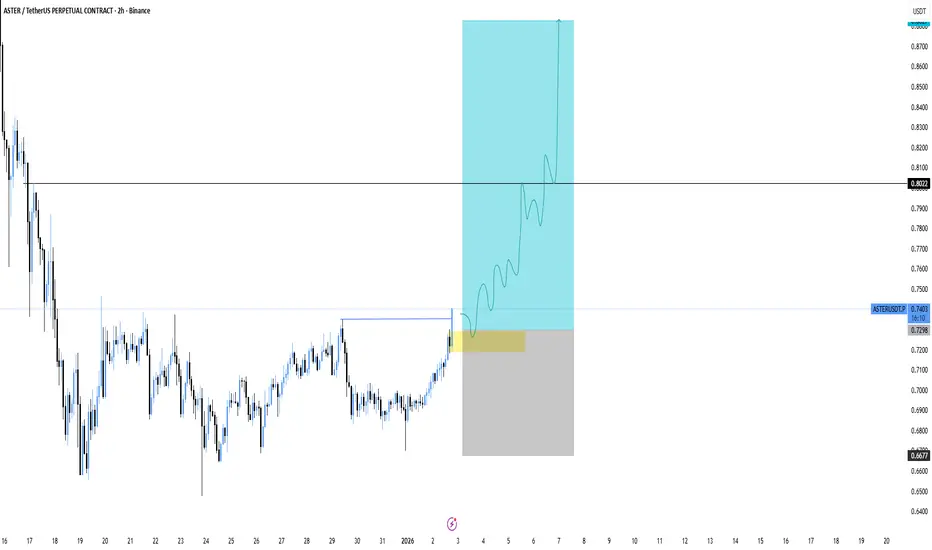
ASTERUSDT – Potential Exploding from here!ASTER has completed a solid recovery phase and is now breaking into a key reaction area. Price is holding well after the push up, suggesting buyers are still in control and opening room for continuation toward higher levels.
Entry: 0.7300 - 0.74
Stoploss: 0.6677
Targets:
0.8032
0.8827
As long as price holds above the entry zone, the continuation scenario remains valid. A loss of this area would invalidate the setup and signal caution.
SOLUSDT.P The short-term structure of Solana is worth attention for scalpers, as it may offer a setup suitable for short positions.
NFA

BCH/USDT – Higher Timeframe Long ContinuationPrice has reclaimed a key HTF level and is holding above the previous resistance, now acting as support. Structure remains bullish, with price positioned for continuation toward higher liquidity levels.
Entry: 638.2
Stop Loss: 571.9
TP1: 705.9
Final TP: 802.2
Bias remains bullish as long as price holds above the support zone.
#BCH #BCHUSDT

RIVERUSDT – Potential Short Reversal SetupRIVER experienced a strong impulsive move followed by a pullback into a key reaction zone. Price is currently stabilizing after the retracement, opening the possibility for a short-term recovery if buyers can hold this area.
RIVER/USDT (SHORT)
Leverage: CROSS 15x
Limit Entry: 15.08
Target: 13.9 - 12
Stop: 16.225
If price can maintain acceptance above the current level, a short-term bounce toward the upper zone remains valid. Failure to hold the level would invalidate the setup.

XRP Breakdown Loading...Are You on the Right Side of the Market?Yello Paradisers, are you prepared for what could be a brutal XRPUSDT reversal? If you missed the latest fake breakout above $1.96, this might be your last chance to position smartly before the market punishes the late entries.
💎After multiple rejections, XRPUSDT is once again trading within a heavily manipulated resistance zone. Price action shows clear signs of exhaustion after sweeping liquidity above the previous highs. The inducement move was textbook, dragging in breakout traders just before reversing hard. This kind of move typically signals smart money is offloading positions while retail gets trapped.
💎We’ve already seen multiple internal structure shifts, including an internal Change of Character (I-ChoCH) and Break of Structure (I-BOS). These are strong bearish signals on the lower timeframes, especially when combined with a Fair Value Gap (FVG) rejection at the golden pocket between the 0.5 and 0.618 Fibonacci retracement levels. Unless XRP can close a strong candle above the $1.96 resistance, this move looks more like distribution than continuation.
💎From here, the first downside target sits at the $1.8262 support level. However, if that zone fails to hold, we’re eyeing a deeper move towards the major support around $1.7450–1.7500. That’s also where a large pool of liquidity sits, marked on our chart as "$$$" making it a likely magnet for price. This zone could serve as the next point of interest for accumulation, but only if approached with patience and precision.
💎Right now, emotions are your biggest enemy. Don’t get tempted by hype or fear of missing out. Stick to your levels, respect invalidation, and let the market come to you.
🎖But it never is, and never will be a free ride. Make sure you play it smart, Paradisers; The next 6–9 months will be juicy for some and painful for others. Discipline, patience, robust strategies, and trading tactics are the only ways you can make it long-term in this market.
MyCryptoParadise
iFeel the success🌴

XMR keeps failing at 450 resistance, is a major breakdown comingYello Paradisers— how many times can XMRUSDT hit the same wall before it collapses for good? The rejection from the 448 to 450 zone is starting to look like more than just noise.
💎XMRUSDT respected an ascending channel for a while but that structure has now clearly broken. The recent breakdown along with an internal CHoCH signals a shift in short-term momentum. The impulsive rejection has cooled off the buyers and the current consolidation just below the broken channel shows that sellers are gaining control while buyers struggle to hold ground.
💎After the breakdown, price made a corrective attempt but was quickly rejected again around the 0.5 to 0.618 Fibonacci retracement area. This zone has now become a supply region and continues to suppress any bullish attempts. As long as price stays under that structure with no strong bullish displacement the bias remains bearish with a likely push toward lower liquidity zones and key support levels.
💎This view changes only if price closes a strong candle above the 450 resistance. That would reclaim the previous range high, cancel the bearish structure shift and signal renewed bullish strength with potential to target higher liquidity above the current range.
🎖Right now is not the time for emotional moves. Stay calm and stay focused. We are only interested in the cleanest and most high probability setups. That is how you win in this game long-term.
MyCryptoParadise
iFeel the success🌴

BNB About to Crash Hard or Just Faking You Out?Yello Paradisers, is BNB setting up for a major dump, or is this just another trap for impatient traders? This next move could catch a lot of people off guard if they're not paying attention to key levels.
💎BNBUSDT is currently looking bearish, as it's reacting strongly from a key resistance zone. This level is further reinforced by the 200 EMA, making it a significant area of confluence. On top of that, price has recently broken down from an ascending channel, which adds further confirmation to the potential shift in trend direction. When these signals line up like this, the probability of a bearish move increases substantially.
💎Now, ideally, we want to see a pullback into the resistance zone. That would give us a much better risk-to-reward entry for a potential short. However, entering blindly is never the move — we need clear confirmation. Specifically, we’ll be watching for a strong bearish candlestick pattern to form right at the resistance zone. If we get that, we can then expect a move toward the next liquidity zones and support levels below.
💎That said, we must stay objective. If BNB manages to break above the invalidation level and closes a candle beyond that point, it will completely invalidate the current bearish outlook. In that scenario, it's better to stay out and wait patiently for stronger price action to develop. There’s no need to force trades when the setup isn't perfect.
🎖Strive for consistency, not quick profits. Treat the market as a businessman, not as a gambler.
MyCryptoParadise
iFeel the success🌴

ZEC Breakdown in Play — React or Get Left BehindYello, did you see the textbook rejection right at the supply zone... or are you already late to the move?
💎#ZECUSDT just gave a clear signal, and if you're not paying close attention, this could be the start of a much deeper breakdown that catches most traders off guard.
💎After completing a clean breakdown from the rising wedge pattern, the price returned for a precise retest... and failed. The rejection right at the $400–$420 supply zone confirms it. That level was a critical resistance where bulls had their final shot to reclaim momentum — but they failed to flip the structure.
💎Now, unless ZEC rapidly reclaims the wedge breakout level, the path of least resistance is clearly down. While there’s a minor support forming near $328, it’s weak and unlikely to hold under sustained selling pressure.
💎 A drop toward the stronger support zone between $285 and $272 is where we expect a real reaction. Only a decisive reclaim above $437 would invalidate this bearish setup and suggest the bulls are back in control.
Discipline, patience, and strategy always win.
MyCryptoParadise
iFeel the success🌴

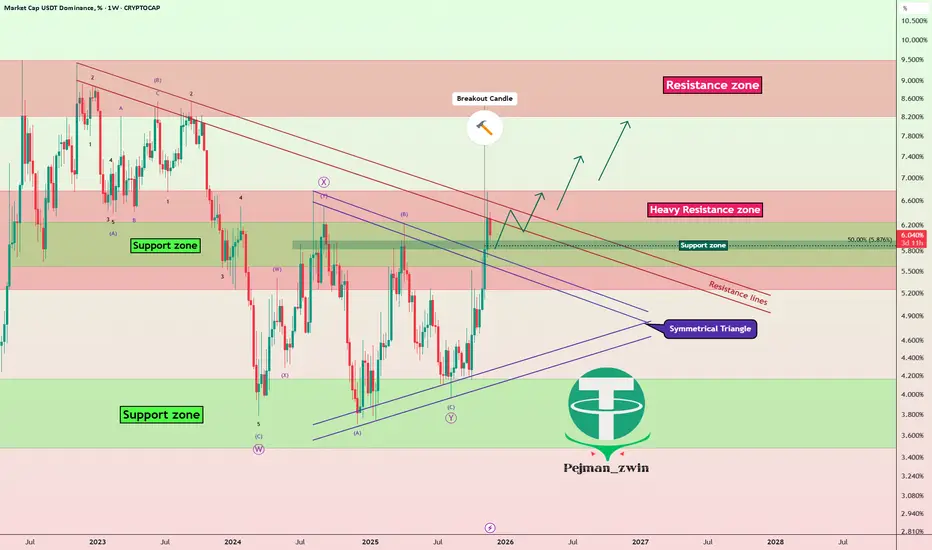
USDT Dominance% Breakout: Crypto Correction Not Over?Today, I’m going to analyze Market Cap USDT Dominance%( CRYPTOCAP:USDT.D ) on the weekly timeframe for you. The reason I want to analyze USDT.D% is that the crypto market conditions have become a bit complex lately, and many factors are influencing it. Therefore, it’s better to take a look at the weekly chart of USDT.D%.
Currently, it seems that USDT.D% is in the vicinity of a Heavy Resistance zone(6.78%-5.25%), but at the same time, there’s also a Support zone(6.24%-5.57%) that could potentially lead to an increase in USDT.D%.
From a classical technical analysis perspective, we can clearly see on the weekly chart that the upper lines of the symmetrical triangle have been broken, and it seems that USDT.D% is currently pulling back to those upper lines. As long as it doesn’t move below those lines again, we can still expect that the market correction is ongoing and hasn’t ended yet. This is a sign that helps us gauge whether the crypto market correction is complete or still ongoing.
From an Elliott Wave perspective, with the breakout of the symmetrical triangle, it seems that USDT.D% might be starting a new impulsive wave.
Since we’re not seeing Regular Divergence(RD-) at the highs, it indicates that the recent upward movement in the crypto market, especially Bitcoin’s( BINANCE:BTCUSDT ) recent gains, is still part of the correction phase.
In conclusion, based on the above analysis, I expect USDT.D% to rise again. If USDT.D% breaks through the resistance lines, we can hope that it will also break through the Heavy Resistance zone(6.78%-5.25%), and that would be a negative sign for the crypto market, potentially leading to deeper corrections in the coming weeks.
So, what do you think? Do you believe the crypto market correction is over, or do you think it will continue? That’s a nice question to leave our analysis with.
Stop Loss(SL): 5.49%
💡 Please respect each other's opinions and express agreement or disagreement politely.
📌Market Cap USDT Dominance% Analyze (USDT.D%), Weekly time frame.
🛑 Always set a Stop Loss(SL) for every position you open.
✅ This is just my idea; I’d love to see your thoughts too!
🔥 If you find it helpful, please BOOST this post and share it with your friends.