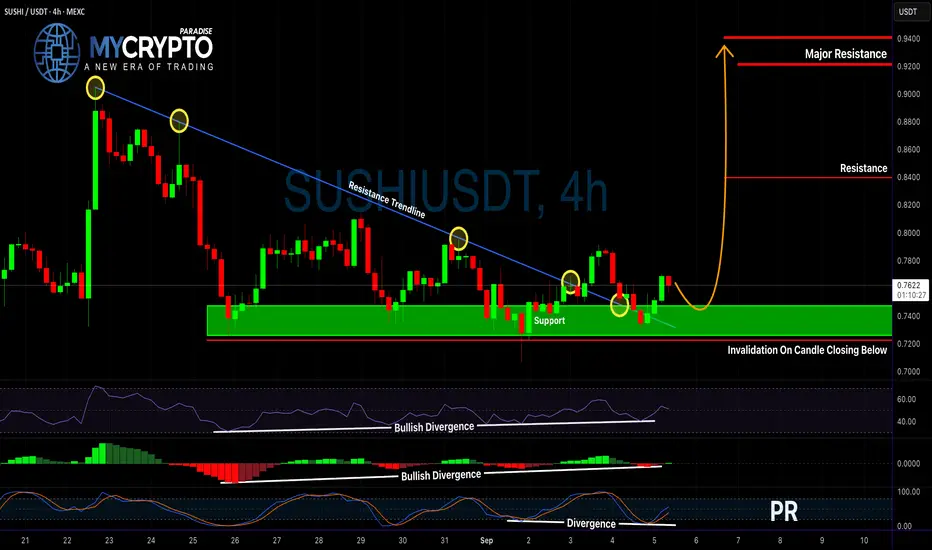
SUSHIUSDT Breakout or Bull Trap?Yello, Paradisers – could this finally be the moment SUSHIUSDT flips the script, or are we about to walk into another trap? With Bitcoin potentially preparing for a short-term pullback, traders need to be extra cautious right now. That said, SUSHIUSDT is showing promising signals that are worth your full attention.
💎After a prolonged downtrend, SUSHIUSDT has broken out of a significant resistance trendline. What makes this breakout more convincing is the confluence of bullish signals appearing across multiple technical indicators. We’re seeing bullish divergence on both the RSI and MACD, suggesting a shift in underlying momentum. On top of that, the Stochastic RSI is showing hidden bullish divergence, which typically signals the continuation of an uptrend. Together, these factors increase the probability of a meaningful bullish move.
💎From a trading strategy perspective, aggressive traders may choose to enter at the current market price. This entry offers a risk-to-reward ratio close to 1:2, which meets the basic criteria for a solid trade setup. However, conservative traders should consider waiting for a potential pullback. Given the current market conditions and the likelihood of a short-term correction in BTC, a retest of the breakout level is likely. If SUSHIUSDT retest support—and prints a clear bullish candlestick pattern, that could offer a safer entry with an even better risk-to-reward profile.
💎It’s crucial to note that this bullish scenario becomes invalid if SUSHIUSDT breaks below the support zone and closes a candle beneath it. In that case, the technical setup would be considered broken, and it would be wise to stay out of the trade until a stronger, more reliable structure develops.
Strive for consistency, not quick profits. Treat the market as a businessman, not a gambler. Only those who stay disciplined and wait for confirmed setups will come out on top in the long run. Patience and strategy will always beat emotion and FOMO. Trade smart, Paradisers.
MyCryptoParadise
iFeel the success🌴
Cryptosignal
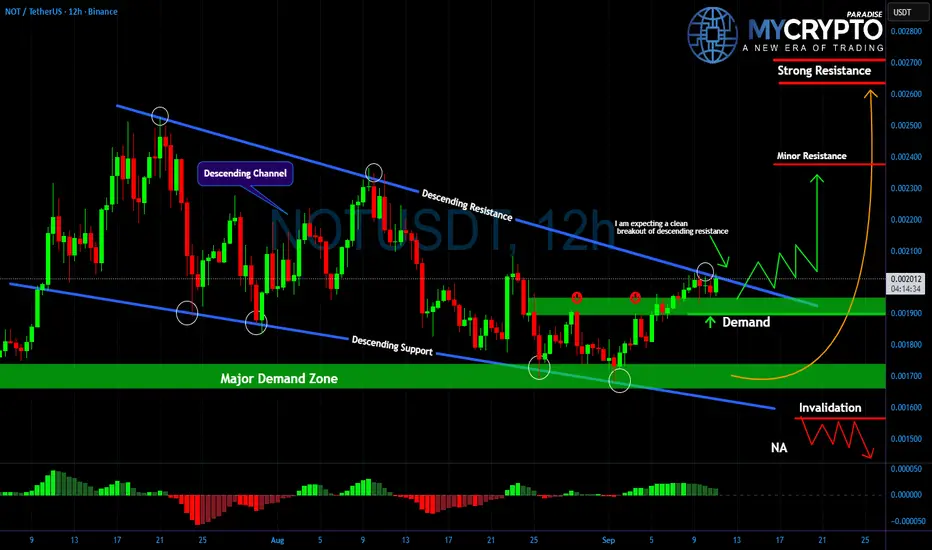
NOTUSDT: Silent Accumulation Before the Next Big BreakoutYello, Paradisers are you paying attention to what’s happening on NOT right now? While most traders are distracted, the price action has been quietly building pressure inside a textbook descending channel, and the breakout signs are now impossible to ignore.
💎After several weeks of heavy compression, #NOTUSDT finally pushed through descending resistance, signaling that sellers are losing their grip. For the last sessions, price has been retesting the breakout area, stabilizing right above the demand zone. This behavior often indicates silent accumulation before a more aggressive move begins.
💎As long as the demand zone holds, buyers keep the advantage. A clean breakout above the minor resistance around 0.0022 could open the path toward the strong resistance level near 0.0026, where significant supply is expected. If this level is reached, the momentum could accelerate sharply as short sellers begin to cover.
💎However, traders must also stay alert. A failure to hold the demand zone would expose price to the invalidation level around 0.0016. A breakdown below it would completely change the market structure and shift the bias back into bearish territory.
💎Momentum indicators are already showing encouraging signs of early accumulation, with every dip into demand quickly attracting buyers. If this continues, NOT could deliver a sharp breakout that leaves the majority of traders chasing late entries.
Strive for consistency, not quick profits. Treat the market as a businessman, not as a gambler.
MyCryptoParadise
iFeel the success🌴
JUPUSDT Is Screaming Reversal – Will You Be the Last Bull HoldinYello, Paradisers – are you about to walk straight into a trap? JUPUSDT is currently showing strong bearish signs right at a key resistance zone, and if you're still holding long positions, it might be time to reconsider before it’s too late.
💎We’re spotting multiple bearish divergences across major indicators: MACD, RSI, and Stochastic RSI are all signaling weakness. On top of that, JUP is moving within an ascending channel, which is typically a bearish continuation pattern. These signals combined are increasing the probability of a sharp downward move from current levels.
💎If we get a proper rejection here, the short setup could easily deliver a 1:1.5 risk-to-reward or better. For more conservative traders, waiting for a pullback with confirmation—such as a bearish candlestick formation backed by high volume—is the smarter play. This approach not only gives a clearer signal but also allows for a tighter stop-loss, improving the overall trade setup.
💎More aggressive traders could consider shorting from the current market price, but keep in mind that confirmation is always key when looking to maximize probability and manage risk effectively.
💎However, if price breaks above the invalidation level and closes a candle above that zone, the bearish outlook will be invalidated. In that case, it’s best to stay out and reassess based on new structure.
🎖Strive for consistency, not quick profits. Treat the market as a businessman, not as a gambler. The only traders who make it in the long run are those who stay patient, wait for high-probability setups, and avoid emotional decisions. Stay sharp and stay disciplined, Paradisers.
MyCryptoParadise
iFeel the success🌴

WLFI Token Faces Key PRZ – Will the Downtrend End Soon?The World Liberty Financial project with the WLFI token ( BINANCE:WLFIUSDT ) continued its downtrend as I expected in yesterday's idea .
The question is, when will this downtrend of the WLFI token end?
The WLFI token is currently moving near the Potential Reversal Zone(PRZ) , Cumulative Long Liquidation Leverage($0.1576-$0.1500) , and the round number of $1,500 .
In terms of Elliott wave theory , the WLFI token seems to be completing the main wave 3 . The main wave 3 could complete at the PRZ and the lower line of the descending channel (possible).
I expect the WLFI token to rise to at least $0.1816(First Target ) in the coming hours.
Second Target: Upper line of descending channel
Cumulative Short Liquidation Leverage: $0.1905-$0.1845
Stop Loss(SL): $0.1487
Please respect each other's ideas and express them politely if you agree or disagree.
World Liberty Financial Analyze (WLFIUSDT), 15-minute time frame.
Be sure to follow the updated ideas.
Do not forget to put a Stop loss for your positions (For every position you want to open).
Please follow your strategy and updates; this is just my Idea, and I will gladly see your ideas in this post.
Please do not forget the ✅' like '✅ button 🙏😊 & Share it with your friends; thanks, and Trade safe.

XLM: Hidden Accumulation Before a Violent Breakout?Yello, Paradisers do you see what’s happening on Stellar right now? While most eyes are turned away, XLM has been quietly carving a base inside a major demand zone, and the setup looks like it could fuel a massive move soon.
💎After weeks of pressure inside a descending channel, #XLMUSDT finally broke out, confirming that sellers are losing strength. For the last several days, XLM has been consolidating right above demand at $0.34–$0.35, holding firm despite repeated retests. This zone remains the line in the sand: as long as it’s defended, buyers keep the upper hand.
💎The breakout area around $0.37 is crucial now. A sustained close above it can trigger momentum toward the $0.42 minor resistance, and eventually even $0.48 where strong supply waits. On the flip side, failure to hold the demand zone could open the door for a deeper flush down into the invalidation area near $0.28, a level that would completely shift the outlook back to bearish.
💎Momentum indicators are already hinting at early accumulation, with signs of buyers stepping in at each retest of support. If this continues, #XLM could deliver a sharp vertical move that catches most of the market unprepared.
🎖Strive for consistency, not quick profits. Treat the market as a businessman, not as a gambler.
MyCryptoParadise
iFeel the success🌴

ONDO’s Last Dip Before Liftoff? Don’t Miss This Entry!Yello, Paradisers! Are you positioned for a high-probability bullish reversal on #ONDO? Price is closing in on a key demand zone where a powerful move could ignite, but only if the structure holds.
💎ONDO is currently forming a Bullish Gartley Pattern, and price action is nearing the crucial $0.76–$0.80 demand zone, which completes the D-leg of the structure. This area aligns with Fibonacci confluences and offers a high-probability zone for a reversal if the pattern holds.
💎#ONDOUSDT is currently correcting towards the $0.76–$0.80 demand zone, where the point D of the Bullish Gartley Pattern is expected to complete. This area is technically significant and marks the potential start of a bullish reversal. If price reacts strongly from this zone, a reclaim of the $0.92 level would serve as the first sign of strength, setting up a move toward the moderate resistance near $1.00. This would confirm short-term bullish intent and open the door for further upside.
💎If that strength persists and momentum builds, the next logical target would be the strong resistance around $1.15–$1.20. This level has historically acted as a barrier and would likely see profit-taking or slowdown unless broader market conditions support continuation.
💎The $0.76–$0.80 zone also acts as a strong support. It’s an area where buyers are expected to defend aggressively, and it won’t be easy for sellers to push the price below it unless momentum shifts completely.
Paradisers, strive for consistency, not quick profits. Treat the market as a businessman, not as a gambler.
MyCryptoParadise
iFeel the success🌴

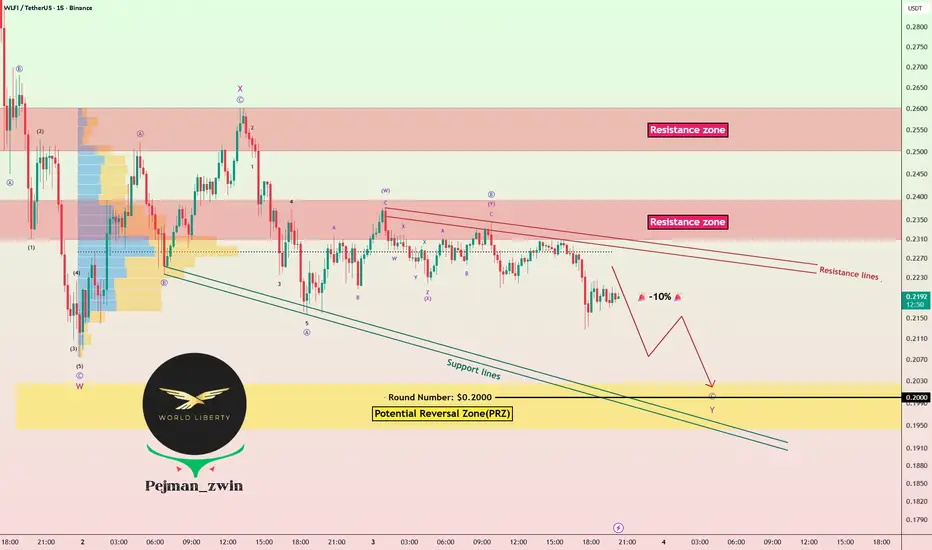
WLFI Faces -10% Risk! Will PRZ Trigger a Strong Reversal?Today, I’m going to analyze World Liberty Financial ( BINANCE:WLFIUSDT ) from a fundamental and technical perspective .
WLFI is the governance token (non-equity) with a 5% per-wallet voting cap.
USD1 is a fully backed U.S. dollar stablecoin (T-Bills + cash).
Total WLFI supply is 100B, with ~24.6B circulating at launch (TGE).
A large share of economic benefits (75% of net revenues) goes to a Trump-affiliated entity, raising concentration and political/regulatory risk.
Key partnership : Alt5 Sigma announced $1.5B funding to adopt WLFI’s treasury strategy and acquire tokens.
Risks : ownership concentration, regulatory scrutiny, and recent EIP-7702 phishing attacks targeting WLFI wallets.
Latest update : WLFI trading started Sep 1 with high volatility and a strong market cap, alongside ongoing security warnings.
Summary : WLFI is a high-risk, high-attention project whose future depends on USD1 adoption, governance transparency, and security execution.
----------------------------------------------------------------------------------
Now, let's use the candles that the WLFI token has created since September 1st and examine the technical analysis of this token on the 15-minute time frame .
First, let me say that due to the low number of candles created , some technical analysis can be challenging .
The WLFI token has been in a correction mode since it was listed on various exchanges .
In terms of Elliott wave theory , WLFI token seems to be completing the microwave C of the main wave Y . The corrective wave structure could be a Double Three Correction(WXY) .
I expect WLFI token to continue its decline and drop at least -10% . The Potential Reversal Zone(PRZ) and Support lines could cause the WLFI token to rise again.
First Target: $0.2043
Second Target: $0.2003
Stop Loss(SL): $0.2400(Worst)
Please respect each other's ideas and express them politely if you agree or disagree.
World Liberty Financial Analyze (WLFIUSDT), 15-minute time frame.
Be sure to follow the updated ideas.
Do not forget to put a Stop loss for your positions (For every position you want to open).
Please follow your strategy and updates; this is just my Idea, and I will gladly see your ideas in this post.
Please do not forget the ✅' like '✅ button 🙏😊 & Share it with your friends; thanks, and Trade safe.
Moodeng Meme Coin sell-off happening as expectedMoodeng Meme Coin sell-off is happening as expected. It's taking some weeks and this meme coin is dropping as a reaction to the very strong supply imbalance in the bigger timeframes. This trade idea has been shared in the past and for those swing traders holding this meme coin it's time to manage the short positons.

Arbitrum’s Last Stand at $0.35?Yello, have you noticed how #ARBUSDT is clinging to its last major support, just as retail traders are starting to panic? This is exactly where the market usually decides whether to trap the impatient or reward the disciplined.
💎Price is currently testing the demand zone around $0.45–$0.50, aligning with the ascending channel support and the 200-day moving average. This zone is absolutely crucial. As long as #Arbitrum holds above it, the structure remains intact, and we can expect a potential rebound toward minor resistance near $0.60, with strong resistance waiting higher around $0.75.
💎However, a confirmed breakdown below $0.45 would shift the structure into dangerous territory. A deeper flush toward $0.35 would not only invalidate the bullish channel but also trigger panic selling across the board. That is where most weak hands will capitulate, while smart money prepares to reload.
💎The majority will chase every small move, but the real trade is about waiting for either a clean bounce with momentum or a decisive breakdown. Both outcomes will be violent, and both will clear out inexperienced traders.
🎖Strive for consistency, not quick profits. Treat the market as a businessman, not as a gambler. The next move on #Arbitrum will be a money-maker for some and a disaster for many make sure you are on the right side by staying disciplined.
MyCryptoParadise
iFeel the success🌴

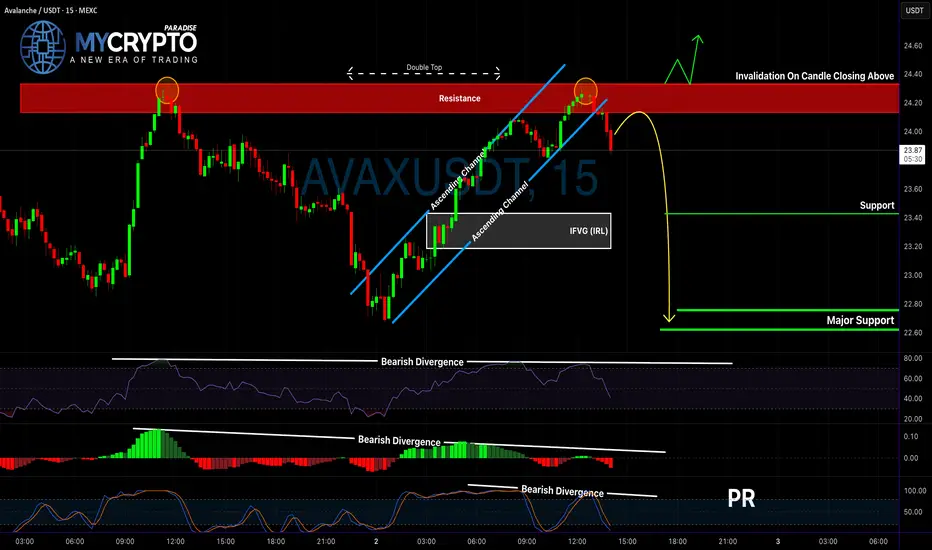
AVAX on Thin Ice: Is a Major Breakdown About to Start?Yello Paradisers, are you seeing what’s happening on AVAX right now? The chart is flashing multiple warning signals that could trigger a heavy downside move if bulls don’t step in quickly.
💎 Currently, AVAXUSDT has formed a clear double top pattern, backed by bearish divergences across RSI, MACD, and Stoch RSI. When all three indicators align in this way, the probability of a bearish continuation increases significantly, and ignoring these signals could prove costly.
💎 For aggressive traders, even entering from the current levels could still offer a decent 1:1 risk-to-reward ratio. However, for those taking a safer and more disciplined approach, it is far better to wait for a pullback into resistance and then watch for a bearish candlestick confirmation before committing. This method not only increases the probability of success but also improves the overall risk-to-reward setup.
💎 That being said, there is one clear invalidation point. If price breaks out and closes above the resistance zone, the bearish outlook will be completely canceled. In that case, the smarter move is to remain patient and wait for new price action to form rather than forcing a trade.
🎖Remember, Paradisers, patience and discipline always pay off in the long run. Chasing every setup is what gamblers do—waiting only for the highest probability confirmations is what separates true professionals from the crowd.
MyCryptoParadise
iFeel the success🌴
ETHUSDT: Price Action and TPHello friends. as you seen the chart of ETHUSDT so after pullback on the base we see the positive sign to reach the chart the first p on the 4800 and second tp 5500

JUPUSDT Bulls Are In Trouble?Yello Paradisers, did you see how JUPUSDT broke down from its ascending channel right at the crucial 4H resistance zone? That move alone has already triggered warning signals, and now with a bearish CHoCH confirmed together with bearish divergence on both the MACD histogram and RSI, the probability of further downside has increased significantly.
💎 At this stage, aggressive traders could already be looking for short opportunities from the current price action, with a potential reward-to-risk ratio of more than 1:1.5. Conservative traders, however, should ideally wait for a clean retest of the broken resistance zone. A bearish candlestick pattern forming there would provide stronger confirmation before pulling the trigger.
💎 Since we are heading into month-end, a possible liquidity sweep cannot be ruled out. That is why scaling in with smaller position sizes makes more sense here to avoid unnecessary exposure.
💎 Still, discipline is key. If the price manages to break and close back above the invalidation level, this entire bearish setup would be invalidated. In that case, staying out would be the only smart move.
🎖Strive for consistency, not quick profits. Treat the market as a businessman, not as a gambler.
MyCryptoParadise
iFeel the success🌴

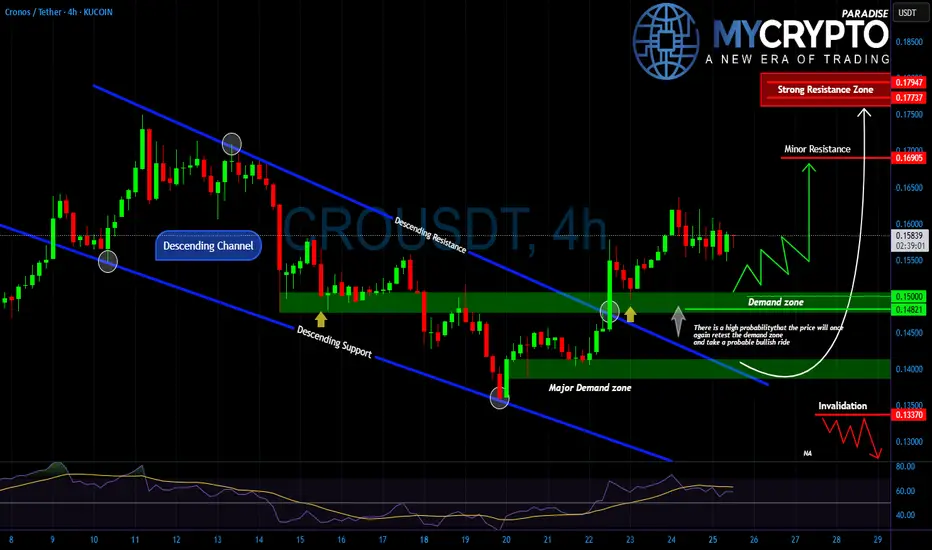
CROUSDT Ready for a Bullish Rebound or a Brutal Trap? Yello Paradisers, is #CROUSDT about to give us a clean bullish rebound from demand or is this just another setup to wipe out impatient buyers?
💎After a prolonged descent within a clear downward channel, #CRO finally broke out, reclaiming strength above the major demand zone around $0.1400–$0.1450. This level acted as a turning point, pushing price back toward the $0.1550–$0.1600 region. Currently, GETTEX:CRO is hovering above minor demand and showing signs of retesting the zone near 0.1500.
💎That region, however, represents a heavy resistance cluster where profit-taking could easily trigger sharp rejections.On the flip side, if demand fails to hold and price breaks below 0.1480, the invalidation level near 0.1330 comes into play. A breakdown into that zone would trap late buyers and likely fuel another wave of panic selling before any real recovery attempt.
💎The key here is patience. Price is at a crossroads where both traps and opportunities are equally possible. Only disciplined traders who wait for confirmation at demand or rejection from resistance will avoid getting caught in the whipsaw.
🎖Strive for consistency, not quick profits. Trade with patience, protect your capital, and let the market show you the highest probability setups. That is how you stay in the winner’s circle.
MyCryptoParadise
iFeel the success🌴
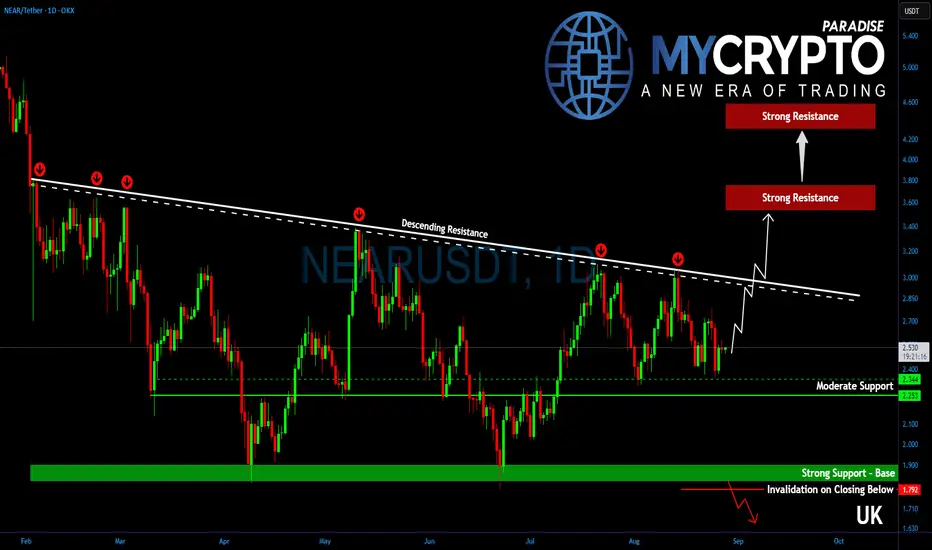
NEAR About to Explode or Collapse? Key Levels to WatchYello Paradisers, have you noticed that #NEAR has been stuck inside this broad descending structure for more than 200 days now?
💎Every time the price tests the resistance trendline, it gets rejected—but here’s the catch: each test is weakening that barrier. How much longer can the sellers keep this lid on before it finally breaks?
💎#NEARUSDT has now reached a critical point and a confirmed breakout above the descending resistance would immediately flip momentum to the bullish side. That would open the path first toward $3.60–$3.80, which also aligns with the 50% retracement zone. While some profit-taking could appear there, the real momentum could still carry NEAR higher.
💎If buyers stay in control beyond that level, the next big target sits at $4.20–$4.40, right at the 61.8% retracement, which historically acts as a powerful magnet for price action.
💎On the downside, the $1.85–$1.95 zone has proven itself as the strongest demand base. This level has been defended multiple times and remains the key line in the sand for bulls. If that support holds, the bigger bullish outlook stays intact.
Paradisers, strive for consistency, not quick profits. Treat the market as a businessman, not as a gambler.
MyCryptoParadise
iFeel the success🌴
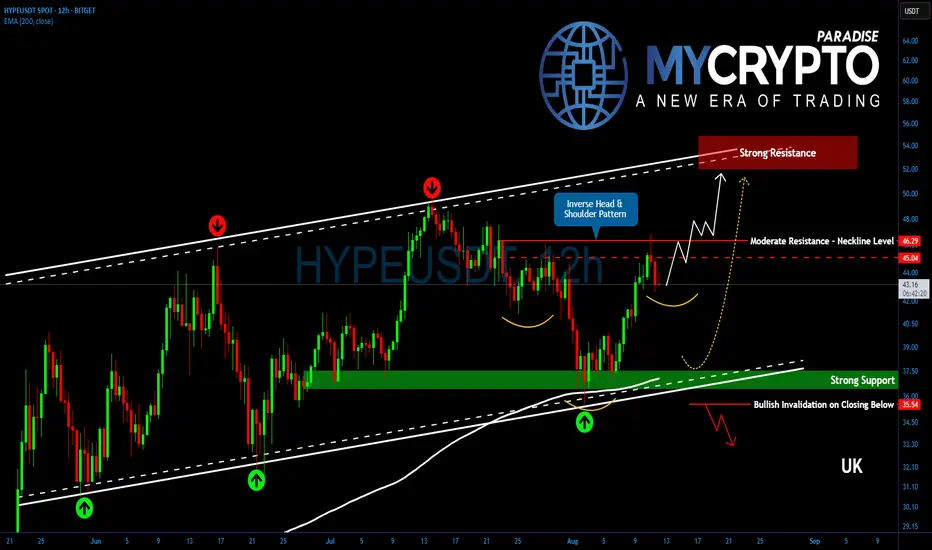
Breakout or Breakdown? HYPE Approaches Critical Price ZoneYello, Paradisers! Could we be moments away from #HYPE’s next explosive leg up? The chart is giving us some big clues right now…
💎HYPE continues to stand out as one of the market’s strongest altcoins, maintaining its climb inside a well-defined ascending channel. On top of that, an inverse head and shoulders pattern is taking shape, a classic bullish signal hinting at further strength ahead.
💎Currently, #HYPEUSDT is pressing against a key resistance zone at 45.05–46.30, which also lines up perfectly with the neckline of the emerging pattern. This is a moderate but crucial area for bulls to conquer.
💎If we see a clean breakout above this range, supported by strong buying volume, it would confirm the bullish pattern and likely propel price toward the 52–54 zone, right where the top of the channel is positioned.
💎On the downside, minor support lies between 43.00–41.90. Losing this zone could open the way for a deeper pullback toward the 37.50 region, where the EMA-200 offers strong technical support.
Paradisers, strive for consistency, not quick profits. Treat the market as a businessman, not as a gambler.
MyCryptoParadise
iFeel the success🌴
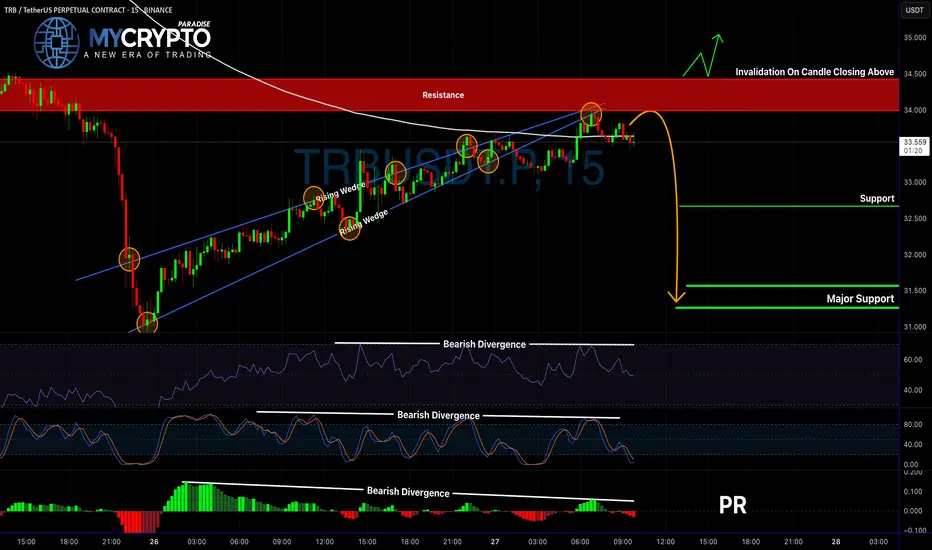
TRBUSDT Danger Zone: Bears Taking ControlYello Paradisers, are you ready for the next big move on TRB? This chart is flashing some serious warning signs that most traders will completely ignore until it’s too late. Let’s break it down before the market makes its move.
💎TRBUSDT has broken down from a rising wedge pattern and retested the resistance zone near the 200 EMA. At the same time, there are bearish divergences showing on the Stoch RSI, RSI, and the MACD histogram. When these signals align, the probability of a bearish move increases significantly, and traders need to be extra cautious.
💎Aggressive traders could already be thinking about entering from the current levels. However, this setup only offers a 1:1 risk-to-reward ratio, which is not ideal for long-term consistent profitability. Entering too early without a solid edge often leads to frustration and unnecessary losses.
💎For those aiming to trade more safely, it is better to wait for a pullback followed by confirmation from a bearish candle. This will provide a stronger risk-to-reward profile and also help maintain discipline in the long run. Protecting capital and choosing only high-quality setups is what separates professionals from amateurs.
💎That being said, if the price breaks out and closes above the invalidation level, then the bearish outlook will be completely invalidated. In that case, flexibility is key, and adjusting to what the market gives us is the only way to stay ahead.
🎖Patience and discipline remain the foundation of trading success. Avoid the temptation of low-probability trades, think strategically, and always protect your capital. This is the only way to last long enough in the market to reap the real rewards.
MyCryptoParadise
iFeel the success🌴
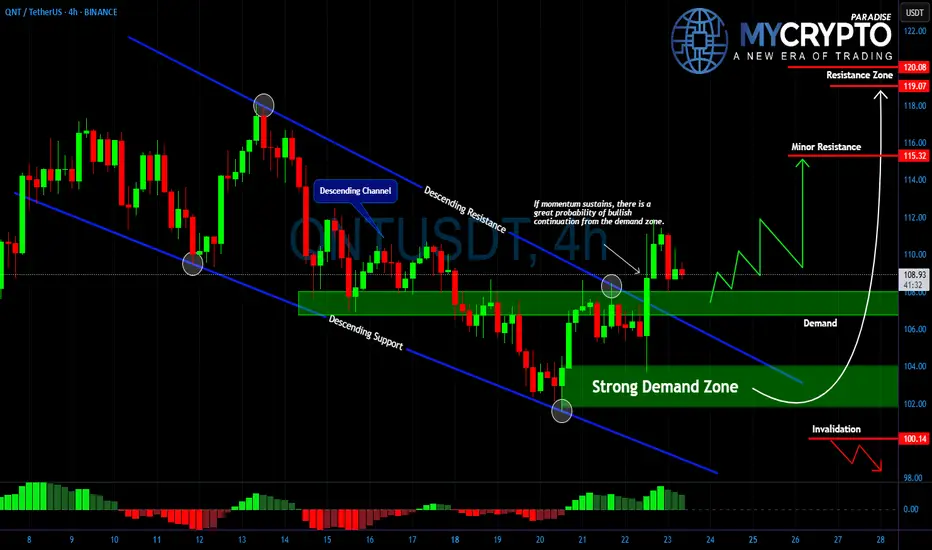
QNT at Demand Zone – Breakout or Breakdown Ahead?Yello traders, #QNTUSDT is now testing a critical demand zone that has repeatedly acted as strong support between 102 and 105. After weeks of moving inside a descending channel, buyers have managed to defend this level, and the market is once again attempting a bullish continuation.
💎Momentum remains fragile, and the immediate test lies ahead at 115, which stands as minor resistance. A clean break and hold above this level could unlock a push toward the stronger resistance zone at 119–120, where sellers are likely to become more aggressive.
💎On the other side, a failure to sustain above the demand zone would quickly shift the structure bearish again. If price breaks below 100, the bullish scenario would be invalidated and deeper downside could follow.
💎This is a decisive moment for #QNT. Patience and discipline are key, as the next move will either confirm a strong breakout or trap late buyers before reversing. Strive for consistency, not quick profits. The market is designed to punish the impatient and reward those who wait for confirmation at key levels.
MyCryptoParadise
iFeel the success🌴
PEPE at the Edge of Disaster or the Start of a Monster Reversal?Yello Paradisers, is PEPE about to break free from its falling wedge or are we staring at another brutal sell-off? After weeks of pressure to the downside, price is now testing the $100–$105 demand zone. This level has been the battleground where bulls and bears repeatedly clash, and the move from here could decide the next big trend.
💎A confirmed breakout above descending resistance would validate the wedge pattern and open the path higher. The first target sits at $1184, with possible continuation into the $1240–$1271 supply zone as momentum builds. This would mark the beginning of a powerful shift in market structure.
💎On the other hand, failure to hold demand and a breakdown below $947 would invalidate the bullish setup completely. In that scenario, selling pressure would accelerate as trapped longs get forced out, driving price into deeper lows.
💎This is a textbook example of why patience is crucial. Jumping in too early means risking a trap, while waiting for confirmation allows you to act only on the highest-probability setups. The market is coiling for a big move, but only those who stay disciplined will come out on the winning side.
Trade smart, Paradisers. Consistency and patience always beat emotions. The winner circle is reserved only for those who know how to wait.
MyCryptoParadise
iFeel the success🌴

Moo Deng Crypto Meme Coin is dropping as expectedMoo Deng Crypto Meme Coin is dropping as expected. There is still a lot of room for this crypto to keep on dropping with the help of the strong monthly supply imbalance mentioned in a previous update.

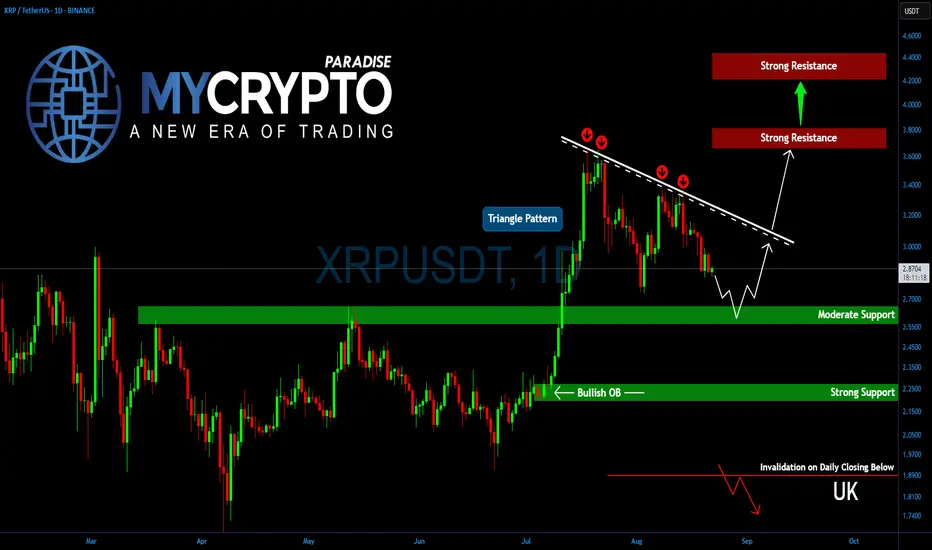
Triangle or Trap? XRP’s Next Move Could Shock TradersYello, Paradisers! Is #XRP quietly preparing for its second explosive leg? The chart is tightening fast, and the next move will decide everything.
💎XRP has been one of the strongest altcoins in this rally, holding momentum after July’s major leg up. Price action is now consolidating inside a triangle formation, which often signals continuation before the next move. This consolidation is also beginning to resemble a potential bull flag, a strong bullish setup.
💎For #XRPUSDT, the key to confirmation lies at $3.15. A breakout above the descending resistance with strong volume would trigger the second bullish leg, sending XRP toward $3.70–$3.85. If momentum carries through, the move could even extend to $4.20–$4.40, which aligns with the 161.8% Fibonacci extension.
💎On the downside, solid support sits between $2.65–$2.55. The longer price holds above this range, the stronger the base bulls will have to push higher. In the case of aggressive profit-taking, XRP could retest $2.25–$2.20, a strong support zone that is expected to withstand any deeper breakdown attempts.
Paradisers, strive for consistency, not quick profits. Treat the market as a businessman, not as a gambler.
MyCryptoParadise
iFeel the success🌴
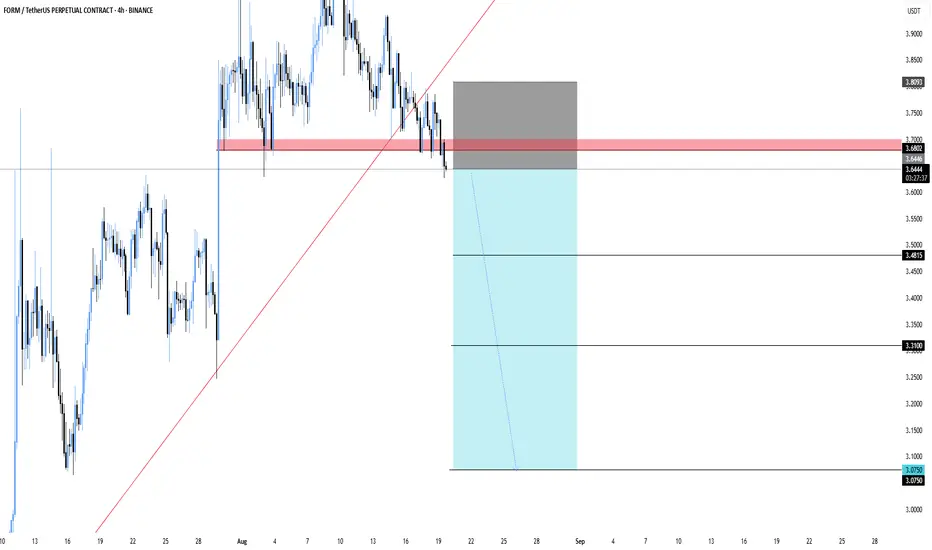
FORMUSDT.P – Break Below SupportFORMUSDT – Break Below Support
FORM has broken its trendline and slipped under the support zone. As long as it stays below this area, the momentum looks bearish with more room to the downside.
Entry: 3.64
Stoploss: 3.8093
Targets:
3.48
3.31
3.075
Let’s see if the breakdown continues or if buyers step back in.
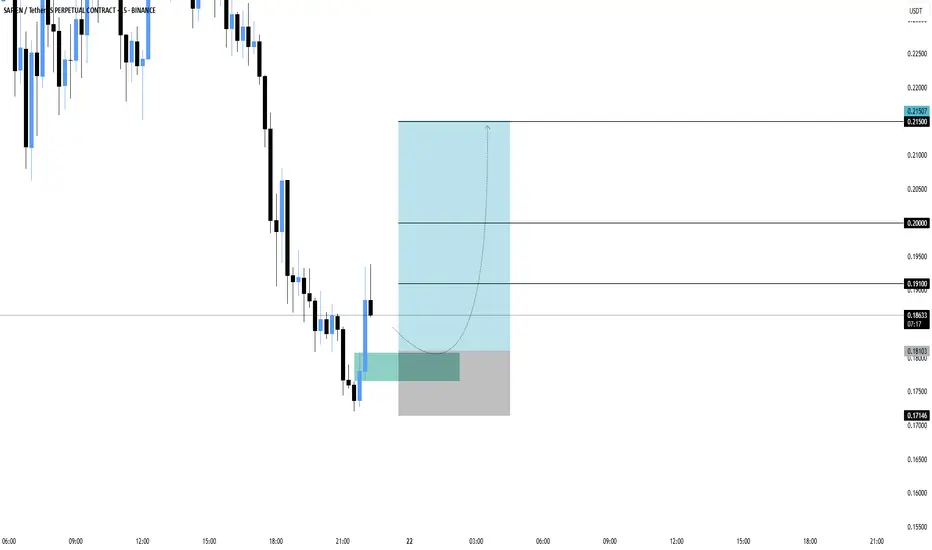
SAPIENUSDT – Bounce OpportunitySAPIEN is showing a potential reversal after tapping into the demand zone. If buyers hold this level, price could push higher toward key resistance levels.
Entry: 0.1810
Stoploss: 0.1715
Targets:
0.1910
0.2000
0.2150
Now the focus is whether momentum can sustain the bounce and drive toward the upper targets.
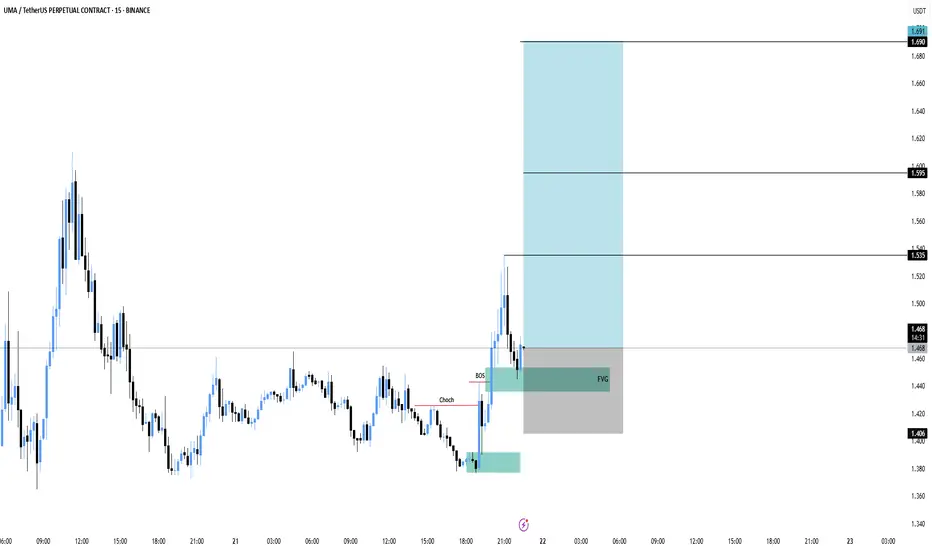
UMA Loading a Big Move – Don’t Miss This Setup!UMA has shown a clear change of character with a bullish break of structure. Price is now retesting the fair value gap (FVG) area, setting up for a possible continuation move upward.
Entry: 1.47
Stoploss: 1.406
Targets:
1.535
1.595
1.691
If buyers defend the FVG zone, UMA could rally toward higher targets with strong momentum.