BTC Trade Idea: Short from 117,850 at previous resistance level
Bitcoin is currently at a previous resistance level 117,500 where the price has bounced down before.
Personally, I will enter a short trade from the current price with a tight stop-loss.
✅ My Personal Strategy:
Entry: Sell from current price 117,850
🎯 Target 1: 116,000
🎯 Target 2: 115,500
Stop Lose : Daily close above the resistance level 117,500
Please note:
This is not financial advice – I’m only sharing my personal trades.
Always do your own research before taking action.
👍 Don’t forget to like if you found this useful, and feel free to follow me for more analysis of this kind.
Best of luck 🌹
Cryptosignals

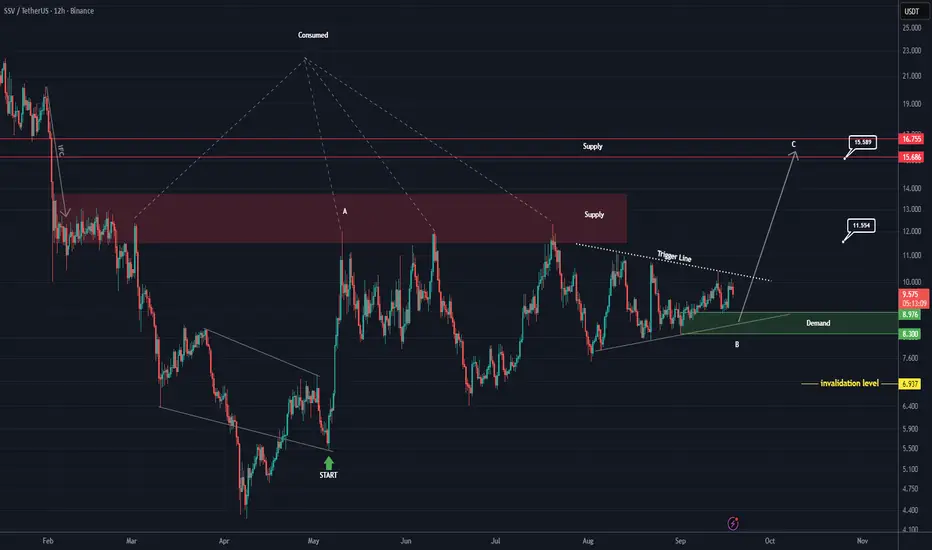
SSV Looks Bullish (12H)A supply zone has been highlighted on the chart. This supply has been consumed many times, yet no lower low has been formed. Also, from the point where we marked it on the chart, a bullish move started. After this bullish move, the price is currently forming a range. It seems that the initial move is wave A of the new pattern, and the ranging move is wave B.
As long as the green zone holds, the price can move toward the targets. Once the trigger line is broken, we will have further confirmations.
A daily candle closing below the invalidation level will invalidate this analysis.
For risk management, please don't forget stop loss and capital management
When we reach the first target, save some profit and then change the stop to entry
Comment if you have any questions
Thank You
Undeads (UDS) Bullish Setup: Targeting 3 USD After CorretionSince the beginning of September, UDS (Undeads) has delivered a nice rally of more than +50%, showing strong momentum and growing interest from both gamers and investors.
Built on a solid GameFi and Web3 foundation, Undeads combines a metaverse economy, staking, NFTs, and a post-to-earn model that keeps the community engaged and expanding.
With the native UDS token at the core of the ecosystem, every step of the game’s evolution drives fresh demand: from in-game purchases to staking rewards and community participation.
What makes this project even more attractive is its growing fan base and accessibility, with the game available on Steam, opening the door to mainstream adoption. At the same time, staking opportunities and play-to-earn mechanics add a strong incentive to hold UDS, reinforcing its long-term value proposition.
The fundamentals remain bullish, positioning UDS as one of the standout performers in the GameFi sector. 🚀
________________________________________
Key Question
Is this just the beginning of UDS’s bullish run, or will the current correction push prices lower before the next breakout?
________________________________________
Why a Healthy Correction is Good
• 2 USD resistance: Price just tested this area twice, creating a double top before pulling back.
• Support retest: The 1.35–1.30 zone, which acted as resistance since late August, is now turning into support – a classic technical setup.
• Higher lows structure: Since April, UDS has consistently made higher lows, confirming the broader bullish trend remains intact.
________________________________________
Trading Plan
The correction we see now could provide a better entry zone around 1.35–1.30, aligning with both technical and structural support. As long as this zone holds, bulls remain in control.
A soft target for this bullish scenario stands around 3 USD, which would represent the next key resistance and a natural profit-taking zone for short-term traders.
________________________________________
Final Thoughts
UDS combines strong fundamentals with a clear technical structure: bullish trend, healthy corrections, and expanding adoption. If the 1.35–1.30 support zone holds, we may see the next leg higher toward 3 USD in the weeks ahead.

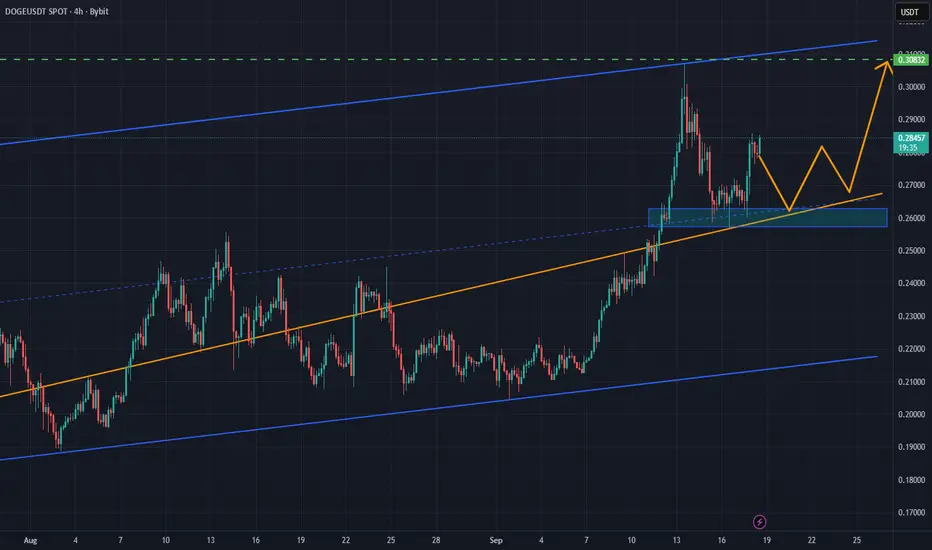
DOGE/USDT: Bullish Structure Intact Above Key Support ZoneDOGE/USDT has displayed strong bullish momentum, breaking out of a triangle pattern and extending toward the 0.3080 resistance zone. Following the peak, price has pulled back to retest the upward trendline, where buyers are stepping in to defend support.
As long as price holds above the 0.2600 level, the bullish structure remains valid, with potential for a retest of 0.3000 and possible extension to higher levels. The broader trend stays positive, supported by the continuation of higher lows within the current market structure.
MONERO (XMRUSD): Another Bullish ALT
Another altcoin that looks strong bullish to me is Monero.
The price formed a high momentum bullish imbalance
candle after a test of a major horizontal support.
With a high probability, the market will reach 314.5 level soon.
❤️Please, support my work with like, thank you!❤️
I am part of Trade Nation's Influencer program and receive a monthly fee for using their TradingView charts in my analysis.

ETHEREUM (ETHUSD): Bullish Trend Continues
I see a nice bullish confirmation on Ethereum after a recent pullback.
The price formed a double bottom pattern and violated its neckline
and a resistance line of a falling wedge pattern.
With a high probability, the market will go up.
Goal - 4741
❤️Please, support my work with like, thank you!❤️
I am part of Trade Nation's Influencer program and receive a monthly fee for using their TradingView charts in my analysis.

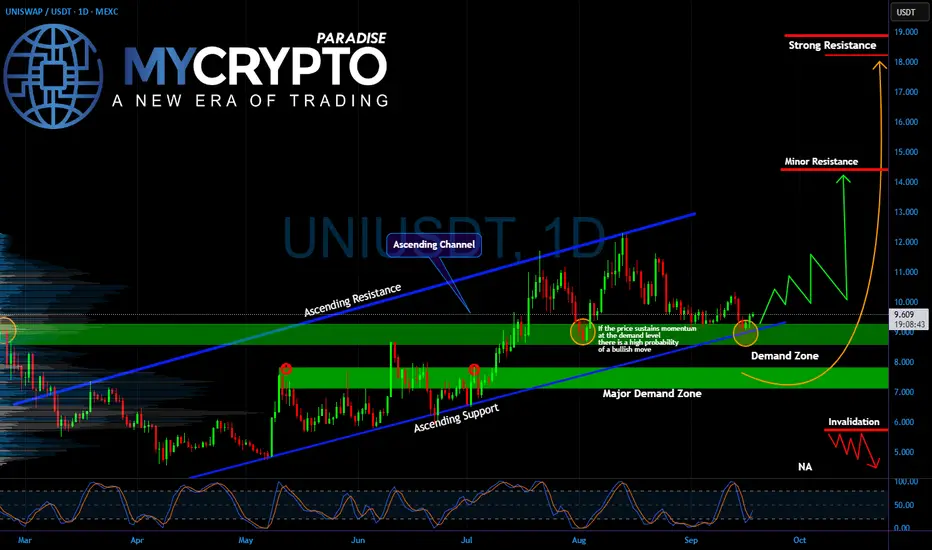
UNIUSDT About to Explode or Break Traders’ Dreams?Yello Paradisers, is #UNIUSDT quietly preparing for its next major rally, or are we sitting right on the edge of a painful trap for impatient traders? Let’s break it down.
💎#UNI has been holding within its ascending channel, bouncing consistently from its demand zone around $9–$9.50. Every retest of this area has brought buyers back into the game, showing strong defense by bulls. Right below, the major demand zone at $7–$8 remains the key level where long-term buyers are waiting, meaning this area acts as a foundation for continuation.
💎On the upside, if #UNI holds current structure and builds momentum, the first challenge is the minor resistance near $14. Breaking through this opens the door toward the strong resistance zone at $18–$19, where profit-taking will likely be aggressive.
💎However, there’s no free ride. A failure to hold the current demand zone could trigger a drop into the $7–$8 major demand area. If that level also gives up, the structure is invalidated, and UNI could revisit much deeper lows around $5–$6, wiping out weak hands before any real recovery.
💎Right now, #UNI is at a pivotal point: defend support and aim for $14–$18, or lose footing and fall into heavy liquidation territory.
Strive for consistency, wait for clear confirmations, and remember that discipline always beats chasing quick profits.
MyCryptoParadise
iFeel the success🌴
XRPUSD: Buy the Dips Above 2.90, Target the ATHAfter printing a new all-time high at the end of July, COINBASE:XRPUSD entered a correction phase that bottomed in early September around 2.70.
From there, the rebound was strong: price broke above the falling trendline and, even more importantly, reclaimed the 3.00 psychological level.
Looking at the broader chart structure since June, the picture is constructive and it’s reasonable to expect further upside — potentially a retest of the previous ATH, or even the making of a fresh one.
📈 Bias: I remain bullish on XRP as long as price holds above 2.90.
🎯 Trading Plan: The strategy here is to buy dips, with the old ATH as the first big target.

Bitcoin Under Pressure, Correction or Breakout Ahead ?Regarding the overall trend, BTC is currently in a corrective phase after a strong rally from March to July, and is now facing a key resistance zone between 114,500 – 117,500 USDT.
🔸 The price failed to break the recent high at 117,500.
🔸 A clear supply order block is visible between 116,500 – 117,300 USDT, acting as strong selling pressure.
🔸 There’s also a partial Fair Value Gap (FVG) between 111,000 – 113,000 USDT, which may get retested.
📈 If BTC breaks above 117,500, the likely scenario is a rally toward the major resistance at 124,000 USDT, where a potential Double Top formation may occur with a possible failed second high.
📉 On the other hand, if support at 114,500 is broken, the price could head toward the strong support zone around 110,000 – 107,000 USDT.
💡 Trade Idea (Short-Term):
Entry: Sell from price ~117,500
🎯 TP1: 114,600 (Consider closing 50% here)
🎯 TP2: If 114,600 breaks, hold the remaining position for a move toward 110,000
SL: Daily close above 117,500 (If this happens, trend flips bullish and a long trade toward 124,000 can be considered).
Please note:
This is not financial advice – I’m only sharing my personal trades.
Always do your own research before taking action.
👍 Don’t forget to like if you found this useful, and feel free to follow me for more analysis of this kind.
Best of luck 🌹

DOGE Breakout or Bull Trap? Read Before You Enter!Yello Paradisers! Could this be the breakout that finally sends DOGE flying, or is it just another trap designed to lure in early bulls before dumping hard? If you’re thinking about entering here, you’ll want to read this entire breakdown — because the price action is sending mixed signals, and it’s critical to stay sharp right now.
💎DOGEUSDT has just broken out of a classic falling wedge pattern — a historically bullish setup that often marks the end of a corrective phase. What strengthens this move even more is the presence of a hidden bullish divergence on the RSI and a bullish divergence on the MACD, both suggesting that momentum is building to the upside. In addition, we’ve now seen a bullish CHoCH (Change of Character) right after a liquidity grab, which further increases the probability that this could be the start of a new impulsive move upward.
💎That said, the current risk-reward ratio from this level is sitting at around 1:1, which is not ideal for a high-conviction trade — especially if you're managing capital with a long-term mindset. For that reason, the more strategic move here would be to wait for a pullback and watch for a strong bullish candlestick confirmation on the lower timeframes. This would offer a better entry with improved risk-reward, giving you more confidence and cleaner structure to trade off.
💎Still, if you're an aggressive trader, taking a small position now with that same 1:1 RR could make sense — but only if your risk is clearly defined and well managed. Chasing a breakout without a confirmed entry trigger or without patience could cost you, especially in a choppy market like this one.
💎However, if DOGE breaks back down and closes below the invalidation level, then the entire bullish setup is invalidated. In that case, it’s best to step aside, wait for cleaner structure, and only re-enter once we see stronger bullish confirmation or a new range develop.
🎖We are playing it safe right now. If you want to be consistently profitable, you need to be extremely patient and always wait only for the best, highest probability trading opportunities.
MyCryptoParadise
iFeel the success🌴

Rate Cuts, Liquidity, and BTC: Why 120K Is the Danger ZoneYesterday , while everyone was screaming about a Bitcoin dump, we caught the breakout of that resistance I showed you.
Today, I want to talk about the upcoming rate cut news , what could happen after it, and what we should do with our open positions.
Now personally, I’m still holding the breakout position we entered a week ago . I didn’t secure any profits, and honestly—I didn’t even want to. Because if the Fed cuts rates, we could kick off the next leg of this uptrend.
But keep this in mind: opening fresh positions around 120K IS NOT EASY AT ALL. Why?
Because there’s massive liquidity up there, huge volatility, and the chances of getting stopped out are very high. That’s exactly why I’d rather hold my position from earlier than be forced to open new ones in that zone.
👉 Let’s look at yesterday’s daily candle: it closed super bullish. This shows the market is leaning positive on the idea of a rate cut. But is this candle just front-running the news? Hard to say. We can’t exactly go ask every trader if they bought because of the Fed. So, better not overthink it.
I personally expect a short-term dip after the news drops. But more important than the cut itself are Powell’s words. If he signals more cuts are coming, markets could explode higher. If he says “not anytime soon,” we might get a pullback.
⚠️ My advice:
If you don’t already have a position, stay on the sidelines for a few hours. Any stop loss you put now has a big chance of getting hit.
But if, like me, you’re already in from the earlier triggers, just hold. It’s worth it.
For me, I’m also long on GBP/USD, and I didn’t secure profits there either—I’m waiting to see how it reacts.
👉 Quick look at BTC.D: dominance is rising with Bitcoin, which means it’s smarter to keep focus on BTC rather than altcoins. When dominance turns bearish again, that’s when we’ll shift back to alts.
This is why for the past few days I’ve been saying: stick with Bitcoin. Liquidity is flowing into it.
Ethereum? It gave back almost 70% of its recent move.
LONG STORY SHORT: don’t do anything stupid here. The best play, if you don’t have an open position, is to stay patient. Don’t FOMO.
Remember: the most important thing is not Bitcoin’s price itself. It’s stop-loss size, liquidity zones, and momentum. here in Skeptic Lab, that’s exactly what we dig into.
I’ll try to post another update after the Fed news drops.
Until then, stay safe. Peace ✌️

#XRP is Approaching a Breakout | Will It Hold or Collapse? Yello, Paradisers! Is #XRP about to confirm a real breakout from months of sideways pain, or is this just another trap? Let’s dissect what’s happening with precision so you’re prepared either way:
💎After weeks of compression beneath a well-defined descending resistance, #XRPUSDT is about to break out. The breakout above this key trendline is now increasing the probability of a bullish continuation, especially with the 50EMA acting as dynamic support and reinforcing the bullish pressure.
💎Currently, the price is trading around $3.00, right above the breakout zone. If the market successfully retests this descending resistance as new support and holds, this would signal strong momentum building up for the next impulsive leg.
💎If that happens, the first upside target is the moderate resistance level at $3.66. A confirmed break above that could send #XRPUSD toward the strong resistance near $4.17, which aligns with the upper boundary of the visible volume profile.
💎On the flip side, the support zone between $2.69 and $2.48 now becomes critical. A retracement into this area could provide a high-probability bounce, but any breakdown and daily close below $2.4849 would invalidate the current bullish setup. In that case, price could unwind sharply, as the bullish structure would be broken, and sellers could regain control.
Stay patient, Paradisers. Let the breakout confirm, and only then do we strike with conviction.
MyCryptoParadise
iFeel the success🌴

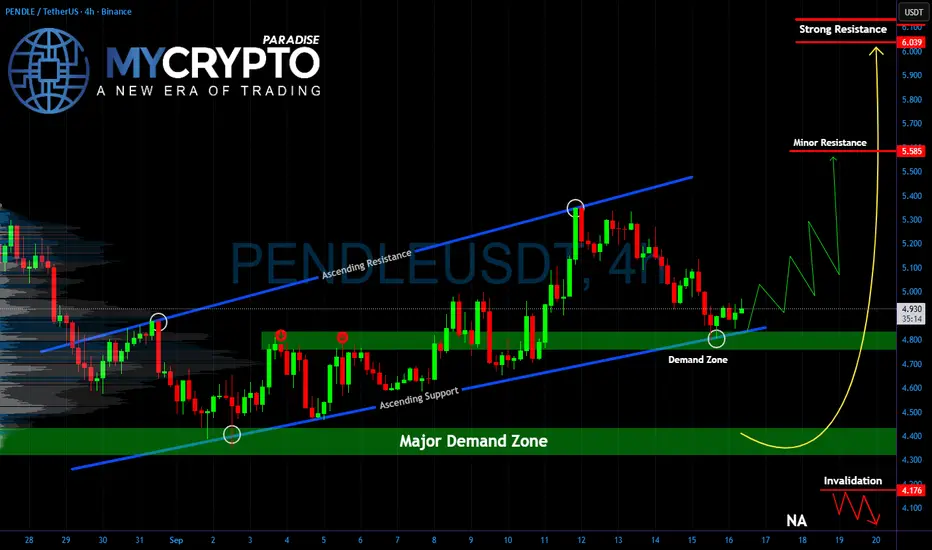
PENDLE At Critical Turning Point Before Explosive MoveYello Paradisers, can #PENDLEUSDT hold the line here, or is a painful flush waiting around the corner? After the recent selloff, the price has landed right inside a demand zone that previously triggered strong recoveries. This is the level where buyers need to step up, or the structure risks collapsing toward the deeper major demand area below.
💎Currently, #PENDLE is bouncing from the ascending support trendline after retesting it, showing early signs of strength. If momentum continues, the first big obstacle lies at the 5.58 minor resistance. A clean breakout above that level could open the way toward the strong resistance zone around 6.03–6.13, which has historically been a heavy supply area. That’s where aggressive profit-taking is likely to appear again.
💎On the downside, the invalidation level remains clear at 4.17. A close below this mark would signal that demand has completely failed, and it could invite deeper liquidation, dragging the price back into the major demand zone around 4.20–4.40. Until then, the bullish structure remains intact, but the next moves will be decisive.
🎖Strive for consistency, not quick profits. Treat the market as a businessman, not as a gambler. The next breakout or breakdown will shake out weak hands, but only disciplined traders will stay on the right side of the move.
MyCryptoParadise
iFeel the success🌴
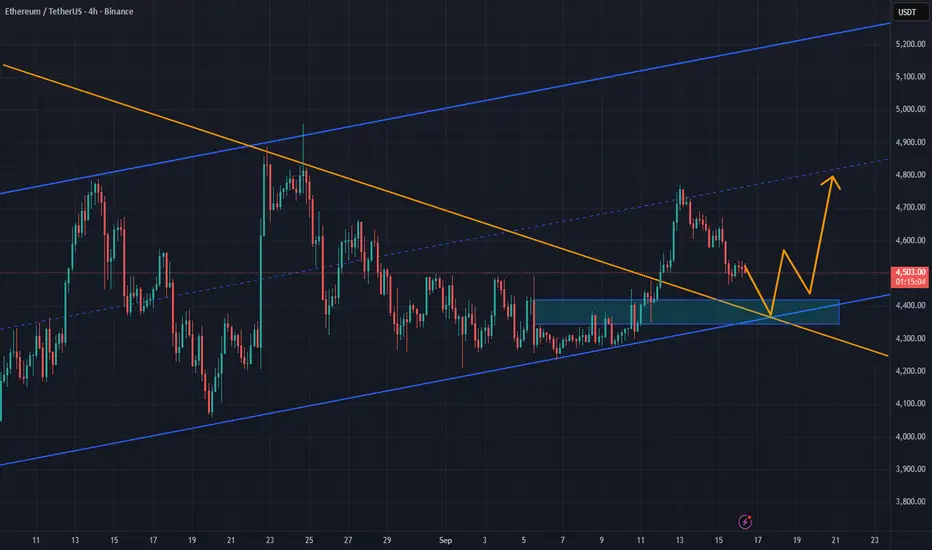
ETH/USDT: Bullish Structure Intact Above Key Support ZoneETH/USDT is trading above the 4,400 support level after rebounding from the upward trendline, showing resilience despite recent pullbacks. The market has broken out of a falling wedge pattern and is forming higher lows, indicating accumulation and potential for further upside.
If buyers defend the 4,390 area, momentum could carry the price toward the 4,750 level, with a possible retest of the broader 5,000 resistance zone. As long as Ethereum stays above trendline support, the bullish outlook remains in play.
Bitcoin to 105K? Stop Talking Sh*t, Here’s the TruthEveryone’s screaming about a Bitcoin dump … but where’s the proof? 🤔
In this video, I break down the weekly, daily, 4H, and even 15m to show you the real triggers that matter for Bitcoin’s next move. Spoiler: the big picture is still bullish AF.
We’ll also look at Wednesday’s Fed rate decision and how it could shake the market.
Stay skeptical. Don’t FOMO. Manage risk.
Boost if it helped.
(P.S. Sorry for the voice — I’m fighting through a nasty cold :/)

Ethereum $ETH daily demand playing out well. Breakout happenedEthereum CRYPTOCAP:ETH daily demand at $4,336 is playing out well. Breakout happened as expected and mentioned in the last update. Long positions should be managed on this major cruptocurrency.

BitCoin $BTC weekly demand from $110,500 is playing out wellBitCoin CRYPTOCAP:BTC weekly demand from $110,500 is playing out well. Trying to reach the resitance level overhead and hopefully break all-time highs.

SHIB Breakout Incoming or Another Trap?Yello Paradisers, have you noticed how #SHIBUSDT has been quietly coiling at its demand zone while retail traders are completely distracted elsewhere? What looks like silence right now could easily turn into a violent move, and the next few candles will decide everything.
💎Price has been stuck inside a descending channel, repeatedly testing both support and resistance levels. Most recently, we’ve seen a classic double bottom formation at the demand zone, a structure that often signals the beginning of a larger bullish reversal if momentum follows through. As long as SHIB holds above this critical green zone, bulls have the upper hand.
💎The first confirmation would come with a clean breakout above the descending resistance, opening the road toward the minor resistance around $0.00001345. But the real target that could bring back FOMO is the resistance zone between $0.00001428 – $0.00001445. This area is packed with liquidity, and if taken out with strength, SHIB could trigger a sharp rally that leaves latecomers chasing.
💎On the flip side, the risk remains clear: if a daily close slips below the major demand zone, the bullish scenario gets invalidated, and SHIB could tumble toward fresh lows inside the channel. This is where inexperienced traders usually get trapped, overleveraged, and liquidated, while disciplined players quietly wait for the highest probability setups.
Stick to your plan, manage your risk, and don’t let emotions guide your entries. The market is designed to shake out the weak before rewarding the patient and prepared.
MyCryptoParadise
iFeel the success🌴

SOL The Whales are Selling at This Strong Resistance Level 230$SOL Current Market Update
The coin is now facing a very strong resistance around $230 .
This presents a great short opportunity .
After carefully monitoring buy and sell orders on-chain, I noticed a strong confirmation for the short setup:
Whales and Market Makers sell orders are clustered heavily around the $228 – $230 resistance zone.
✅ My Personal Strategy:
Short Entry: Resistance zone between $228 – $230
🎯 Target 1: $220
🎯 Target 2: $216
Please note:
This is not financial advice – I’m only sharing my personal trades.
Always do your own research before taking action.
👍 Don’t forget to like if you found this useful, and feel free to follow me for more analysis of this kind.
Best of luck 🌹

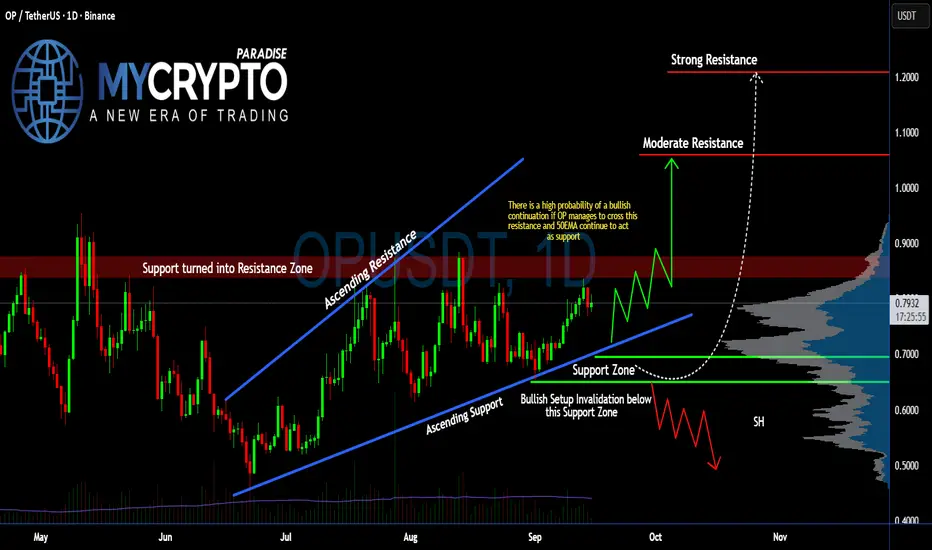
Will #OP Finally Explode or Is This Just Another Trap for Bulls?Yello, Paradisers! Is #Optimism gearing up for a breakout, or is this the final squeeze before bulls get dumped on hard? Let’s dissect what’s really happening on #OPUSDT:
💎After forming a clean ascending channel since mid-June, #OP has been respecting both the ascending support and ascending resistance zones. Price is currently sitting just below the key resistance zone around $0.83–$0.85, which was previously a support level before flipping into strong resistance. This makes it a major decision point for the next move.
💎If #OPUSD manages to break and close above the $0.85 resistance area with strong volume, and the 50EMA continues to hold as dynamic support, then we’re likely to see a push towards the moderate resistance around $1.059. If that level is cleared, the next logical upside target sits near $1.20, aligning with the strong resistance and peak on the volume profile.
💎As long as price holds above the Support Zone between $0.69 and $0.65, the bullish case remains valid. The structure continues to print higher lows, showing that buyers are defending the trendline support. A successful retest here could lead to a powerful bullish continuation.
💎However, if bulls lose control and #OPUSDT closes below the $0.650 support, the entire bullish setup would be invalidated. In that case, price could slide down toward the $0.50–$0.55 zone, especially if volume dries up. This would complete a potential head-and-shoulders pattern and trigger a shift toward a bearish structure.
Stay patient, Paradisers. Let the breakout confirm, and only then do we strike with conviction.
MyCryptoParadise
iFeel the success🌴
Bitcoin Short Opportunity Before the Next Leg UpBitcoin is currently showing noticeable weakness in buying momentum.
Most likely, it will drop to the 113K–112K area to retest before moving higher again.
✅ My Personal Strategy:
Entry (Sell): 115,600
🎯 Target 1: 114,000
🎯Target 2: 113,600
Stop-Loss: Daily close above 117,400
Please note:
This is not financial advice – I’m only sharing my personal trades.
Always do your own research before taking action.
👍 Don’t forget to like if you found this useful, and feel free to follow me for more analysis of this kind.
Best of luck 🌹

Bitcoin to $150K ? Mining Difficulty Holds the KeyUnlike Ethereum, Bitcoin’s mining difficulty has always marched higher alongside price. This natural cycle reflects a simple truth: as the price climbs, more miners join the network, competition grows, and blocks become harder to produce.
📈 Historical Patterns
2017 Bull Run → Price exploded while difficulty surged. Even after corrections, difficulty never reversed its long-term uptrend.
2021 Recovery → Despite China’s mining ban, difficulty quickly rebounded to new highs, fueling Bitcoin’s rally back from $30K.
2023–2025 Cycle → With Bitcoin pushing to new records, difficulty has now reached an all-time high of 136T, signaling massive investment and long-term confidence.
Why Rising Difficulty Is Bullish
Miner Confidence → Expanding operations show miners expect higher prices ahead.
Reduced Selling Pressure → Higher costs mean miners prefer to sell at elevated levels, reinforcing upward momentum.
Proven Signal → Historically, price accelerations often followed major spikes in difficulty.
The Short-Term Risk
If prices stagnate while costs rise, weaker miners may shut down, creating temporary selling pressure. But historically, this has only made the network stronger and healthier over time.
Outlook: $150K and Beyond?
With Bitcoin trading around 115K and strong support $110K and difficulty at historic highs, the setup resembles past cycles that led to explosive upside. Each surge in difficulty has paved the way for new price records — making $150,000 look less like a dream and more like the next logical step.
🔥 Bottom Line: Record-high mining difficulty has consistently been a medium-to-long term bullish signal. If history rhymes, Bitcoin could be gearing up for its next major leg higher — and $150K might just be the beginning.
Do you think Bitcoin will hit $150K this cycle?
This post is for educational and informational purposes only and should not be considered financial or investment advice.
Always do your own research .
Best Regards

BTCUSD Weekly Analysis– Are Bulls Ready for the Next Leg Up?Bitcoin (BTCUSD) closed this week at $115,822, gaining 4,659 points from the previous week.
📊 Weekly High: $116,805 | Weekly Low: $110,624
🔑 Key Levels to Watch Next Week
✅ Bullish Scenario:
If BTCUSD sustains above $116,000, we could see an exciting move towards the strong resistance zone of $119,140 – $119,800. A breakout above this level could open doors to fresh all-time highs in the coming sessions.
❌ Bearish Scenario:
A 1-hour close below $115,480 could trigger selling pressure, taking Bitcoin down to test key support at $113,760 (just ~1.5% lower from current levels).
🎯 Trading Plan / Strategy
Aggressive Bulls: Look for sustained price action above $116K before entering fresh longs.
Smart Bears: Watch for signs of rejection near $119K zones for a possible short opportunity.
Swing Traders: Use the $115,480 level as a pivot — whichever side it breaks, follow the momentum.
🧠 My Take
Bitcoin is looking strong after this week’s breakout, but the next move depends on whether bulls can hold $116K. A failure here might just give dip buyers another golden entry near $113,760 support.
💬 Let’s Talk!
What’s your view – are we heading to $120K next or are we due for a healthy pullback?
👇 Drop your thoughts, charts, and strategies in the comments — I’ll review and share my take on interesting ideas!
