Crypto Total Market Cap HTF UpdatePrice is still ranging after a strong sell-off and trading below HTF supply.
Key observations:
Price is reacting inside a bearish order block
Range high sits around 3.18–3.22T
A push into 3.22T would likely be a buy-side liquidity grab
Many shorts are positioned below this level
No HTF acceptance above supply yet
My bias remains bearish
As long as price stays below 3.22–3.25T, downside remains likely
Any move into 3.22T without acceptance is fake breakout risk
Mid-range remains a no trade zone
If you have any questions or feedback, feel free to drop them in the comments.
Disclaimer: This is not financial advice. Just sharing my personal market view.
MrC
Cryptototalmarketcap

Total Crypto Marketcap --- PLan Your Exit#TOTAL Crypto has already doubled from it's bear bottom, to it's most recent high.
We are almost in 2024, well into crypto summer now
time is really running out to prepare your portfolio for the inevitable Bull market euphoria phase.
I bring this chart up just to remind everyone, that this cycle has potential to be one of the worst in terms of multiple expansions we have seen so far.
We have gone from exploding 340X in one cycle.. to 33X the last cycle.
I expect this time round it will be a single digit multiplier.
We have to hope and pray we do indeed break the previous ATH , and we don't double top at 3 trillion.. of which there is no guarantee!
My realistic target is around 5 Trillion Dollars, which may sound pessimistic at only 3.5X from here ... but that means your Altcoins adding at least a Trillion dollars of value from here!
Optimistically i'm looking at around 7 trillion dollars, no mean feat!
BTC.d at 30% would equal BTC 2.1 Trillion or $110k per coin.

$TOTAL Crypto Market Cap DANGER ZONESame same, but different.
Crypto CRYPTOCAP:TOTAL Market Cap is still indecisive...
playing with fire within the DANGER ZONE 🔥
Bulls need back above the 20WMA and .236 fib ASAP
Clock is ticking 🕘

$TOTAL Crypto Market Cap Fights Back w/ Weekly CloseCrypto CRYPTOCAP:TOTAL Market Cap looking similar to CRYPTOCAP:BTC
Thankfully did not close outside of the Danger Zone.
It's absolutely imperative that Bulls reclaim the 20WMA this week and close above the .236 Fib
Losing the 20WMA has signaled more downside / sideways chop historically.
Hopefully this is just a fake-out, otherwise the 50% Gann will be retested alongside the 50WMA.

$TOTAL Crypto Market Cap Incredible Weekly Close!The Crypto CRYPTOCAP:TOTAL Market Cap showed incredible resilience after nuking ~25% this week.
Closed the Week just below the WEMA9 at $3.86T, but above the .236 Fib and stayed cleared of the DANGER ZONE ⚠️
Notice that wick all the way down to the 50WMA where it bounced literally right off the trendline breakout I drew back in July.
Those MMs are really respecting my TA these days huh 🤓
This dump covered the 50% Gann level retrace, which give me confluence that the hardest part of behind us.
Bears weren't even able to form a Bearish Engulfing candle.
Next up Bulls need to reclaim the 9WEMA as mentioned in the previous post.

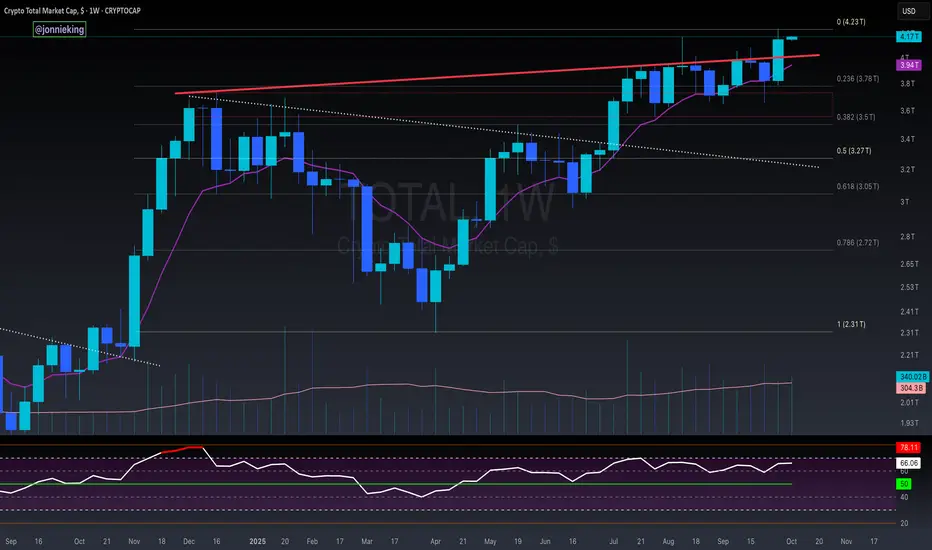
$TOTAL Market cap looking bullish The Cup & Handle formation breakout in November 2024 initiated an upward wave following a successful retest in April 2025.
In July, the demand zone at the November 2024 ATH level broke upward and is currently being retested.
At the same time, the SMA20, which broke in November 2023, is still strongly defended, confirming the structural strength of the market.
After the retest, a transition to a new parabolic phase for the market will become inevitable.
Bitcoin \ Ethereum \ Altcoins

$TOTAL Crypto Market Cap Closes Week ATHCrypto CRYPTOCAP:TOTAL Market Cap Closes the Week at ATH.
Bulls need to close these next couple weeks above
$3.9 - 4.1T to really build momentum.
TOTAL CRYPTO MARKET CAP expected to hit $6 Trillion!The Crypto Total Market Cap (TOTAL) has been on a Channel Up since the 2022 market bottom and since the April 07 2025 Low (Higher Low for the pattern), it's initiated the new Bullish Leg, already turning the 1W MA50 (blue trend-line) into Support.
As long as this holds, we expect it to complete a +270% rise from the August 05 2024 Low, similar to the Bull Cycle's first Green Phase, and reach at least a $6 Trillion Market Cap!
More importantly, we expect this final part (blue ellipse) to be what is commonly known as an Altseason, where the lower cap coins show much higher returns and disproportionate gains to e.g. Bitcoin.
-------------------------------------------------------------------------------
** Please LIKE 👍, FOLLOW ✅, SHARE 🙌 and COMMENT ✍ if you enjoy this idea! Also share your ideas and charts in the comments section below! This is best way to keep it relevant, support us, keep the content here free and allow the idea to reach as many people as possible. **
-------------------------------------------------------------------------------
💸💸💸💸💸💸
👇 👇 👇 👇 👇 👇

$TOTAL Crypto Market Cap - Banana Zone or Bull Trap!?Massive day for CRYPTOCAP:TOTAL Crypto Market Cap with 9% move UP, breaking above the 200DMA and last cycle’s ATH.
Got rejected at the .618 Fib ~$3.19T, so work still needs to be done to confirm this region.
Expect a retest at $3T to decide if the market goes to $3.2T or back down to $2.85T
As I've been saying this past month, this is either the biggest bull trap all cycle, or it's the start of the PARABOLA 🍌

$TOTAL Crypto Market Cap BULL TRAP AlertBULL TRAP 🚨
New money has been coming into the market as shown on the Crypto CRYPTOCAP:TOTAL Market Cap, hence why you haven’t seen “rotations” in coins, but it appears to be drying up.
There’s been major resistance at the 200DMA, which is just below the previous ATH at $3T, and PA is being squeezed between the 9DMA.
Combine this with a heated RSI, it appears to be a bear flag in the making.
The trendline from Oct. ’23 gives confluence with the 50DMA as support.
*The only savior I see at this point is price smashing through the 200DMA and flipping support into the green accumulation box.
Regardless, this move is coming to an end later this week to test support or breakout.
Again, I’ll reconfirm my stance that this is the most obvious bull trap I’ve seen all cycle. Although I hope to be wrong 🥲
Having said that, after support is confirmed on the move, we are going to VALHALLA 🚀
Bookmark this 🤓

Crypto Total Market Cap (CRYPTOCAP:TOTAL) As of March 12, 2025, the Total Crypto Market Cap sits at 2.63T USD.
Let’s dive into the monthly chart for a technical breakdown:
Since 2016, price has been moving within a long-term ascending channel. Right now, we’re testing the lower trendline support zone (2.4T - 2.5T).
This level has historically acted as a strong base – both the 2017 and 2021 bull runs kicked off from similar support zones.
Volume profile shows a 15-20% increase over the past 3 months, indicating growing buyer interest and improving market liquidity.
RSI is at 40 (neutral zone), not yet in oversold territory but signaling a potential base for a recovery.
Bullish Scenario: If the 2.5T support holds, we could see a move toward the channel’s midline (3T - 3.5T range), potentially retesting the 2021 highs above 3T.
Bearish Risk: A break below 2.5T could lead to a deeper pullback toward 2T, so keep this level on your radar.
💡 My Take: I believe we’re either at the bottom or just a few weeks away from the start of a new uptrend. April could mark the beginning of a bull run, signaling the end of the bloodbath – at least based on the technicals of the Total Market Cap.
What’s your view? Will the 2.5T support hold, or are we in for another correction?

$TOTAL Crypto Market Cap Signals End of CorrectionCALLING IT NOW 🚨
THAT WAS THE BOTTOM OF THE DIP 💯
✅ Bounced beautifully off the 50DMA
✅ RSI is fully reset to when the Trump Pump started
✅ Volume has turned bullish to signal trend reversal
✅ The Crypto CRYPTOCAP:TOTAL Market Cap needs to stay above 3.2 - 3.3T
Some clustered days around this region will signal even more strength.
🚀 3.6 - 3.7T reclaims bullish trend.
SANTA CLAUS IS COMING TO TOWN 🎅

Happy Rabbit New Year!- Welcome back to 1T Crypto Market Cap.
- Happy Lunar New Year of the Rabbit to everyone !
Happy Tr4Ding !

Crypto Total Market Cap targetsTotal I track since 2023. By my idea top of the market was in 2021 spring
I use my fib and mark green block zone for accumulation CRYPTOCAP:TOTAL
Now all money almost in BTC and we swept ath total.
Now is time to send it to two next levels, it's hard to say about timing but most likely top for btc and alt season will be spring - autumn 2025.
Around 5 Trillion conservative targets for capitalisation
Based on Trade on indicator you can track how it goes on W timeframe!
I use my custom indicator set for more factors in my analysis. April correction playing out good, same like summer 2022 bottom.
July and August we saw the buy back signals!
Hope you enjoyed the content I created, You can support with your likes and comments this idea so more people can watch!
✅Disclaimer: Please be aware of the risks involved in trading. This idea was made for educational purposes only not for financial Investment Purposes.
---
• Look at my ideas about interesting altcoins in the related section down below ↓
• For more ideas please hit "Like" and "Follow"!

From Breakout to Boom: The Future of Bitcoin and AltcoinsNow price created H&S with means the price can react to this situation and breaks the neckline and will go up. and also , the price can follow the butterfly pattern and go up.
The cryptocurrency market is growing as expected, with the overall market value (covering Bitcoin, Ethereum, and altcoins) indicating a breakout. This development paves the way for a major upward trend in the coming months.
✨We spend hours finding potential opportunities and writing useful ideas, we would be happy if you support us.
Best regards CobraVanguard.💚
_ _ _ _ __ _ _ _ _ _ _ _ _ _ _ _ _ _ _ _ _ _ _ _ _ _ _ _ _ _ _ _
✅Thank you, and for more ideas, hit ❤️Like❤️ and 🌟Follow🌟!
⚠️Things can change...
The markets are always changing and even with all these signals, the market changes tend to be strong and fast!!

Crypto Altcoin Marketcap Altcoins have not been preforming well over the last few months.
They have been consolidating in a downward wedge. It is time for altcoins to takeoff to new all time highs.
If altcoins breakout of this wedge than we can see a big move to the upside over the next 8-12 months.

Cryptoz- No matter FUDS.
- No matter SBF.
- No matter GOVS.
- No matter CEX.
- Bitcoin is resilient.
- Everything is in Graph. " resistances transform to support and vice versa."
- if you give up, they win.
Happy Tr4Ding !

Crypto Market Slowed Down Within Wave 4 CorrectionGood morning Crypto traders! Crypto market slowed down yesterday with an interesting spike down into important support area for a higher degree wave 4, from where we can see a quick stabilization. Well, we believe that more upside is coming for wave 5 of (3), just be aware of more complex wave 4 here if the market stay slow and sideways for a longer period of time.

SHOPPING TIME
- TheKing is struggling but altcoins are almost bottomed.
-" the time to buy is when there's blood in the streets ".
- All in graph. Stay S4fe and don't go all in.
Happy Tr4Ding !

BTC vs Cryptos- Sometimes drawing a simple trends can show you many things.
- Observe.
- Compare.
- Learn.
- Deduct.
Happy Tr4Ding !

TOTAL MACRO ANALYSISTOTAL CRYPTO MARKET CAP;
-Has exploded since it entered into Ichimoku Cloud.
-Typically, we see prices reach the opposite side of the cloud.
-That area also lines up with the yellow neckline as resistance.
-I think we pump the remainder of the year for the most part.
-Could see a sell-off after the end of the year.
-I would think dips on the new year are for buying before the BTC halving
Please follow me here for more crypto analysis and a safer way to read charts to minimize risk.
**This idea is not financial advice, its just my 2 cents.
Thanks for your time!
~Cosmicbag

Crypto Total MC sending while MC excluding Alts lagging behindBTC spot ETF has been approved. This is why i have been saying to load up at these bear market levels. Not a time to fomo now, be patient. Its a NEWS pump.
The risk of not loading at these Bear Market levels is too high. Once we dip start scooping, prepare for all scenarios, keep in mind a black swan can always still appear with the state of the world.
Crypto Total market cap sending and hit a resistance on weekly, while the Market Caps excluding BTC is lagging behind still.
This is due to the BTC dominance pump, breaking through its local high. Expect Alts to lag behind as predicted, this is a BTC ETF not an altcoin ETF.
BUT money flows in BTC people take profit then they start buying alts, this is what has happened since inception. Be patient and keep scooping cheap alts.
BTC Dominance sending, alts will suffer most likely if this rally continues. But then you scoop and ride em when BTC starts dropping.

Crypto Total Market Cap Trend AnalysisExpecting a fall of around 7% towards 950 Billion level as per the broadening wedge pattern after which a massive 90% rally will happen towards 1.8 Trillion level.
This 7% fall will sweep the liquidity to fuel the upside move and is highly likely to happen.
I see downside in BTC chart as well to corelate with this scenario.
Good to look for investment opportunities during this fall instead of panicking.
This is not a buy or sell recommendation, do your own due diligence before taking any action.
Peace!!
