My FOMO Nightmare: How Missing One Trade Changed My Trading LifeI remember the day like it was yesterday. I was scrolling through X (Twitter), seeing everyone go wild over this one stock. My heart raced as I watched the price skyrocket, but I hesitated. I hadn't done my homework on this one, and something felt off. But the fear of missing out? That was eating at me.
The next day, I woke up to see the stock had crashed. My initial relief turned into regret. Maybe I could've sold at the peak if I had just jumped in like everyone else. That's when FOMO, or Fear Of Missing Out, became my trading nemesis:
-Hasty Actions: I started jumping into trades at the last minute, driven by the buzz on social media, not by my own analysis.
-Screen Addiction: I couldn't step away from my screen, worried I'd miss the next big move. My life began revolving around the market's every twitch.
- Chasing Losses: After missing a few opportunities, I found myself in a dangerous cycle, trying to make up for lost gains with even riskier trades.
But here's the twist in my story. One evening, after a particularly bad day of chasing trends, I sat back and realized how this fear was controlling me, not my strategy. I decided to change. I set strict rules for myself: no trading based on social media hype, sticking to my research, and remembering that every market has its patterns - there's always another chance if you miss one.
Now, I trade with a calm mind, knowing that if I miss one trade, there'll be another. If you've ever felt that burning desire to join the rush, only to regret it later, you're not alone. Let's share our stories and strategies for overcoming FOMO. DM me if you want to chat about how we can keep our heads in the game, not just our eyes on the screen.
Kris/ Mindbloome Exchange
Trade What You See
Cryptotrading

ETHEREUM (ETHUSD): Bullish Continuation Confirmed
It looks like ETH is going to continue growing.
I see a strong bullish signal on a daily:
a breakout of a neckline of an ascending triangle pattern.
Next resistances: 3790 / 4000
❤️Please, support my work with like, thank you!❤️

XRP/USDT Bullish Pennant Formation in ProgressThe chart illustrates a textbook Bullish Pennant pattern, suggesting the potential for upward price movement. Currently, the price action is encountering resistance near the upper trendline, indicating that a breakout may require additional consolidation.
Key Observations
1. The pennant formation remains structurally intact, with the price consolidating within a narrowing range.
2. A confirmed breakout above the upper trendline is essential to validate the bullish thesis and initiate a sustainable upward move.
3. Upon a successful breakout, the projected target lies between $2.80 and $3.00, aligning with historical resistance levels.
Strategic Implications
Patience and discipline are paramount. Monitor closely for a decisive breakout with strong volume confirmation. Until then, be prepared for further consolidation or a potential retest of the lower trendline as the market gathers momentum.

#TLM Ready For Another Bullish Rally or Not? Key Levels to WatchYello, Paradisers! Could this be #AlienWorlds' moment of glory or a sharp turn south? Let’s dive into this critical setup for #TLMUSDT:
💎#TLM has been consolidating within a falling wedge, a pattern often signaling a potential bullish breakout. However, the price needs to decisively break above the descending resistance for the move to materialize. Currently, #TLMUSD is trading around $0.014, eyeing the next major resistance at $0.016.
💎A 4-hour candle close above $0.0168 would confirm a bullish breakout. If this occurs, the price could rally toward the $0.02278 strong resistance zone, where sellers are likely to re-enter the market. Beyond that, the next major target sits near $0.028, signaling a potential continuation of the upward momentum.
💎To validate a breakout, you must look for strong bullish candles and increased trading volume. Without these signals, any upward move risks being a fakeout, trapping overenthusiastic buyers. You must watch this zone closely for a decisive push.
💎On the flip side, failure to break above the descending resistance could lead to a retest of the immediate $0.0143 support level. Failure to hold this support may push the price lower toward the strong $0.01151 support level. If this level is also lost, #TLM could spiral toward $0.00800, wiping out short-term bullish sentiment.
Stay focused, patient, and disciplined, Paradisers🥂
MyCryptoParadise
iFeel the success🌴

KAVA ANALYSIS🚀#KAVA Analysis :
🔮As we can see in the chart of #KAVA that there is a formation of "Falling Wedge Pattern". In a 3d timeframe #KAVA broke out the pattern and perfectly retest the levels. Expecting a bullish move in few days
⚡️What to do ?
👀Keep an eye on #KAVA price action. We can trade according to the chart and make some profits⚡️⚡️
#KAVA #Cryptocurrency #TechnicalAnalysis #DYOR

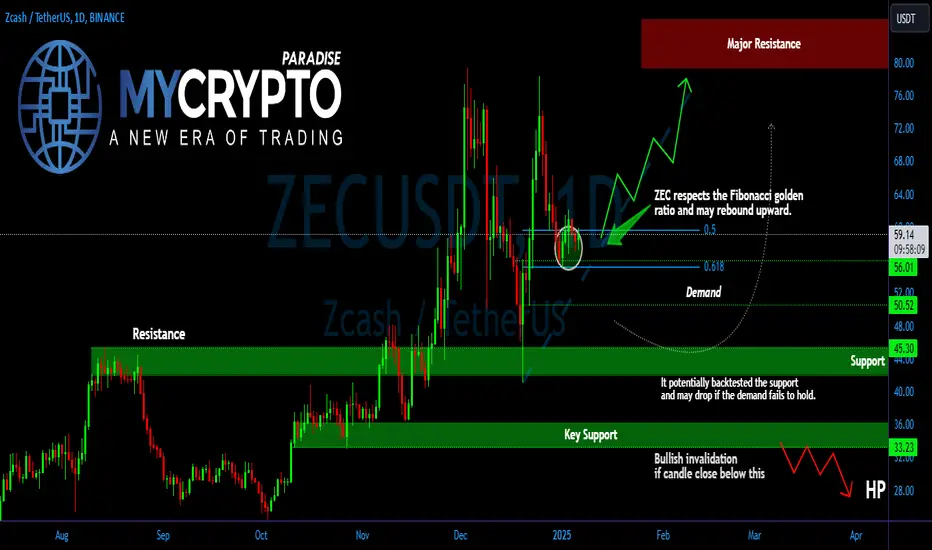
ZECUSDT: Is the Rebound Real, or Are We Heading Lower? Key LevelYello, Paradisers! Are we witnessing a genuine rebound for #ZECUSDT, or could this move be a trap before a deeper correction? Let’s take a closer look at what’s happening and the critical levels you should have on your radar.
💎#ZEC has shown respect for the golden ratio of the Fibonacci retracement, suggesting a potential bounce to the upside. However, the key question is whether the price can sustain above the crucial demand zone between $56 and $50.20. If ZEC holds this level, the upward momentum could continue, with the next target being a retest of the strong resistance area.
💎But what happens if ZEC fails to hold above this demand zone? In that case, the price could drop back to the $45.30 support area, a level that has historically triggered significant rebounds. This zone has acted as a strong base in the past, and it’s likely that any dip toward this level could see buyers stepping in once again.
💎The risk increases if ZEC breaks below this support and closes below $33.20. If this happens, we could see a much deeper correction, potentially pushing the price even lower. A candle close below this level would invalidate the bullish outlook and indicate further downside ahead.
Stay disciplined, Paradisers. Consistency in trading comes from managing risk and staying patient.
MyCryptoParadise
iFeel the success🌴
Can #ID Bulls Really Continue this Bullish Momentum? Key LevelsYello, Paradisers! Will #IDUSDT rally to new highs or face a sharp rejection? Let’s dive into the current setup of #SpaceID:
💎#ID recently broke out of a well-defined descending channel—a structure often signaling a shift in trend. Currently, the price is consolidating near the $0.423 support zone, a critical level to watch for the next move. For bulls to regain momentum, the price must decisively break above the $0.5773 resistance zone. This will confirm the breakout and open the door for a significant rally.
💎If #IDUSD successfully reclaims the $0.577 resistance level, the next key hurdle lies in the major resistance zone around $0.750. A breakout above this level would likely trigger a strong upward move, potentially targeting even higher levels. Watch for increased trading volume and strong bullish candles above $0.577 as confirmation of market strength.
💎On the downside, if the price fails to hold above the $0.423 support zone, a retest of the demand zone near $0.366 becomes highly probable. This area has historically attracted buyers, but if it fails to hold, the bullish setup will be invalidated.
💎A daily close below $0.366 could lead to further downside pressure, with potential targets near $0.3000 or lower. So, let's see how this #ID setup turns out, but the probability of it going up is higher.
Stay focused, patient, and disciplined, Paradisers🥂
MyCryptoParadise
iFeel the success🌴

Will EOS/USDT Explode or Collapse? Yello Paradisers, is #EOSUSDT gearing up for a breakout, or are we about to see a sharp decline? The current chart structure points to a make-or-break moment, and understanding these key levels is crucial for navigating what’s next.
💎#EOSUSD is currently testing a critical resistance level at $0.9627. A decisive breakout above this region could signal a significant shift in momentum, with the next targets around $1.30 to $1.60. These levels correspond to previous highs and represent a psychological barrier where profit-taking is likely. If buyers successfully push past this zone, it could ignite a bullish rally with considerable upside potential.
💎However, the resistance at $0.9627 remains strong, and failure to break above it could result in a pullback. Below the current price lies the demand zone at $0.8285, which serves as a crucial support for bulls. A bounce from this area could indicate the continuation of the broader accumulation phase and present a favorable opportunity for buyers.
💎If the $0.8285 demand zone fails to hold, the next significant support levels are found around $0.7114 to $0.6693. A strong rebound from these levels, accompanied by increased volume, could set the stage for a recovery targeting higher resistance levels. Conversely, a breakdown below this zone would confirm bearish dominance and pave the way for further declines.
💎Volume is the critical factor to watch here. Any breakout above $0.9627must be supported by robust trading volume to confirm its legitimacy. Similarly, low-volume moves in either direction should be approached with caution, as they are often fakeouts.
#EOSUSDT is at a crossroads, and its next move will likely define the near-term trend. A break above resistance could trigger a bullish rally, while failure to hold key support zones might lead to deeper corrections. This is not the time for impulsive decisions. Stay patient, disciplined, and wait for clear signals before taking action.
MyCryptoParadise
iFeel the success🌴

Bitcoin (BTC/USD) – Technical Analysis UpdateCurrent Technical Setup:
Rectangle Formation: BTC’s price is consolidating in a continuation pattern, signaling that the prevailing uptrend remains intact.
The longer this consolidation lasts, the more powerful the potential breakout due to the buildup of momentum.
Upside Targets:
A breakout from the rectangle could propel BTC towards $125,000–$130,000, aligned with Fibonacci extensions and prior bullish projections.
This would mark a continuation of Bitcoin's impressive rally while remaining technically structured and sustainable.
Support Levels:
$78,000–$80,000: Critical support zone to maintain the bullish structure.
Higher Low Formation: Reinforces buyers’ confidence and indicates the rally is built on a solid foundation.
Market Implications:
The current consolidation serves to stabilize the market, reducing the likelihood of a sharp correction.
Sustained buying interest at current levels suggests healthy accumulation, further strengthening the bullish narrative.
Outlook:
As long as BTC holds above $78,000–$80,000, the technical picture remains firmly bullish. A breakout above the rectangle’s resistance could trigger a swift move toward six-figure levels, marking the next phase of the uptrend. Patience is key, as extended consolidations often lead to explosive upward moves.

AGLD/USDT, Ascending Channel with 2:6 Risk-Reward SetupThis chart displays an Ascending Channel Pattern where the price is trending upward within parallel support and resistance lines. The long position designed here follows a 2:6 risk-reward ratio , indicating a calculated trade setup with a potential 50% profit at the target price of $3.717 and a controlled 18% loss at the stop-loss of $2.016 .
The ascending channel suggests bullish momentum, and the strategy aligns with a breakout continuation toward the upper resistance level. However, if the price fails to sustain above the lower trendline, the trade could hit the stop-loss. This setup offers a favorable risk-reward profile for traders looking to capitalize on the channel's upward trajectory.

Ethereum Analysis: Key Support & Resistance LevelsHere's a detailed look at CRYPTOCAP:ETH price action on the 1H chart (Binance):
🚀 Resistance at $3,680 and $3,740.
🛡️ Strong support zones at $3,580 and $3,440.
⚡ Price currently consolidating near $3,640.
Volume profile indicates critical levels for the next breakout.
Are we set for a bullish continuation or a pullback? 🤔
#Ethereum #CryptoTrading #DayTrading"

#VOXEL/USDT Symmetrical Triangle Breakout Long Setup#VOXEL is breaking out of a symmetrical triangle, signaling potential bullish momentum. The entry is around $0.1983, with a stop loss at $0.1523 and a target of $0.3643, offering a favorable risk-to-reward ratio. Watch for volume confirmation to validate the breakout. This setup has the potential for a 2X move if the momentum sustains. Keep it on your radar!

XRP/USDT Bullish Pennat Breakout LoadingXRP/USDT, Bullish Pennant Formation in Progress
The chart displays a Bullish Pennant, signaling potential upward momentum. However, the price is currently rejecting near the upper trendline, indicating that the breakout may take some time.
Key Insights
1. The pennant structure remains intact, but consolidation might continue before a decisive breakout.
2. Watch for a confirmed breakout above the upper trendline before considering a long trade.
3. Once the breakout occurs, the target range is $2.8 to $3.0.
Patience is crucial as the price may test the trendline support or consolidate further before breaking out.

#WOO Getting Ready for a Major Breakout | Key Levels to WatchYello, Paradisers! Will #WOOUSDT finally break out of its descending channel, or are we heading for another drop? Let’s break it down #WOO:
💎#WOO has been trading within a descending channel on the 8-hour chart, showcasing a classic consolidation structure. Currently, the price is approaching a critical descending resistance, making this a pivotal moment for traders.
💎A break above the resistance at $0.3041 could confirm a bullish breakout which would set the stage for an extended rally. If bulls gain control, the next target zone lies between $0.4000–$0.4500, a significant supply zone where sellers may reappear. We need strong confirmation with robust volume and bullish momentum for this scenario to play out.
💎On the downside, $0.2044 serves as an essential demand zone and has been a reliable support level during the recent consolidation. If #WOOUSD fails to hold this demand we may see a retest of this strong support at $0.161.
💎A close below the $0.161 strong support would invalidate the bullish outlook and could result in a deeper correction. If this happens, the price may drop to test the $0.1500 region, marking a significant shift in sentiment.
Stay focused, patient, and disciplined, Paradisers🥂
MyCryptoParadise
iFeel the success🌴

ETHUSD: MA Bullish Cross triggering rally to 4,300Ethereum is marginally neutral on its 1D technical outlook (RSI = 55.733, MACD = -18.850, ADX = 38.044), which along with today's rise, indicates the high upside potential of this move. The 1D MA100 has crossed over the MA200, forming a rare Bullish Cross that we last saw on December 12th 2023 and March 3rd 2023. That was a technical buy signal that targeted on a minimum the 4.0 Fibonacci extension. That is our target (TP = 4,300).
## If you like our free content follow our profile to get more daily ideas. ##
## Comments and likes are greatly appreciated. ##

Supper bullish SUI SUI/USDT is showing a super bullish setup, with strong buying momentum driving the price higher.
The recent breakout above key resistance levels suggests further upside potential, with the next targets likely in focus.
As long as support zones hold, SUI remains positioned for continued upward movement.
dyor, nfa

Is ARB Poised for a Major Move? Here’s What You Need to WatchYello, Paradisers! Are you ready for a potential game-changing move in #ARBUSDT? The current setup hints at a decisive moment that could lead to either a breakout or a steep decline. Let’s dive into the details to see what’s unfolding.
💎#ARBUSDT is currently sitting between two critical levels. On the upside, the $0.8400 minor resistance is a key threshold that buyers need to breach to regain momentum. A successful break above this level could open the door to $1.00 and eventually test the major resistance zone at $1.2389–$1.2949. This area represents a psychological and technical barrier likely to attract significant profit taking. Overcoming it, however, could trigger an explosive rally as bullish sentiment takes hold.
💎On the downside, the support zone at $0.6515 is acting as a safety net for now. If this level fails, #Arbitrum could descend into the demand zone at $0.5685. A decisive bounce from here, coupled with increased volume, could signal the start of a rally targeting resistance levels and beyond. Conversely, a failure to hold this zone would confirm a bearish breakdown, inviting further downside movement.
💎The battle between bulls and bears hinges on how #ARB reacts to these critical levels. If buying volume increases near $0.8400 and #ARBUSD clears it with strength, the momentum shift could drive prices higher toward the $1.2389 region. Conversely, any rejection at $0.8400 or weakness near $0.6515 would signal that sellers are still in control, increasing the likelihood of a breakdown.
Keep an eye on trading volume, as it will confirm the strength of any breakout or breakdown. Low volume moves are often fakeouts, so stay cautious and wait for clear signals before entering a trade.
MyCryptoParadise
iFeel the success🌴

Fri 3rd Jan 2025 BTC/USD Daily Forex Chart Buy SetupGood morning fellow traders. On my Daily Forex charts using the High Probability & Divergence trading methods from my books, I have identified a new trade setup this morning. As usual, you can read my notes on the chart for my thoughts on this setup. The trade being a BTC/USD Buy. Enjoy the day all. Cheers. Jim

Will #ANKR See Another Bullish Push From the Bulls? Key LevelsYello, Paradisers! Is #ANKRUSDT poised for a breakout, or are we heading deeper? Let’s break down this critical setup for #Ankr:
💎#ANKR has been trading within a descending channel on the 4-hour chart. The price is approaching the descending resistance of this channel and the next few candles will determine whether bulls are ready to take control.
💎For #ANKRUSD to confirm a breakout, it must decisively close above the $0.0406 resistance level. This would open the door to a rally towards the major resistance zone at $0.0485, where sellers may return in force. A strong breakout here could fuel momentum for further upside, potentially targeting even higher levels.
💎If buyers push the price above $0.0485, it will signify a major shift in market sentiment, and we could see #ANKR head toward $0.0580 or higher. To confirm this breakout, you need to watch for increased trading volume and strong bullish candles. Without these signals, any upward move risks being a fakeout.
💎On the flip side, failure to break the descending resistance could lead to a pullback toward the $0.03307 support level. If this support doesn't hold, the price may retest the demand zone at $0.02776.
💎A 4-hour candle close below $0.02776 would invalidate the bullish setup and could trigger a sharp decline toward $0.02500 or even lower. Traders should exercise caution if this scenario unfolds.
Stay focused, patient, and disciplined, Paradisers🥂
MyCryptoParadise
iFeel the success🌴

BTCUSD: Williams bounce points to $119k next.Bitcoin is neutral on its 1D technical outlook (RSI = 52.385, MACD = -483.200, ADX = 34.048) and just today it hit its 1D MA50, which is the first sign of restoring the bullish trend. The strongest bullish indicator is the Williams%R, which has rebounded rapidly since turning oversold at -93.00. Every time it hit that level and rebounded since July 2024, it rallied by +30%. Consequently, we aim for just under that level (TP = 115,000).
## If you like our free content follow our profile to get more daily ideas. ##
## Comments and likes are greatly appreciated. ##

#ROSE Ready for a Bullish Breakout or Not? Key Levels to WatchYello, Paradisers! Is #ROSEUSDT preparing for a bullish breakout, or will we witness a deeper correction? Let’s dive into this crucial setup for #Oasis:
💎#ROSE has been trading within a well-defined descending channel on the 8-hour chart, a structure that often precedes significant market moves. Price is currently hovering near the resistance of this descending channel, and a breakout here could be the game changer bulls have been waiting for.
💎If #ROSEUSD breaks above the descending resistance, the first major hurdle will be the resistance at $0.1159. A clean and sustained breakout above this level could signal the start of a strong bullish rally. The next target would then lie within the major resistance zone between $0.1597 and $0.1671, representing a potential upside. However, you must watch for confirmation with strong volume and clear bullish candles to avoid falling for a fake breakout.
💎On the downside, the $0.074 level serves as critical support and has been a stronghold for buyers so far. If LSE:ROSE fails to break the resistance and bears regain control, we could see the price revisit this support zone. If this level also fails, the last line of protection for bulls is the underlying strong support at $0.056.
💎A daily close below $0.0563 would invalidate the bullish setup and open the door to further downside toward the $0.0400 region, where stronger demand could be tested. However, discipline and risk management remain essential as we await confirmation of the next move.
Stay focused, patient, and disciplined, Paradisers🥂
MyCryptoParadise
iFeel the success🌴

ZILUSDT: Will Zilliqa Explode or Collapse from Here? Yello, Paradisers! #ZILUSDT is sitting at a crucial inflection point. The market is testing a strong support zone that could either trigger a significant rally or lead to a steep drop. Are we about to witness a breakout or a breakdown? Let’s dive into the details.
💎#Zilliqa is currently approaching a key support level around $0.01788, a zone that has consistently acted as a springboard for bullish momentum in the past. This level has been tested previously, showing signs of strength. However, if the support fails to hold, it could spark a cascade of selling pressure, potentially dragging the price down to the next lower Demand at $0.01600.
💎For now, all eyes should remain on the current support zone at $0.01788. A decisive bounce from here, coupled with increased volume, could signal the start of a rally targeting resistance levels and beyond. Conversely, a failure to hold this zone would confirm a bearish breakdown, inviting further downside movement.
💎The RSI is hovering near oversold levels but hasn’t yet shown a clear signal for a reversal, leaving ZIL in a precarious position. This is a critical juncture, Paradisers. The next move could set the tone for #ZILUSDT in the coming weeks. Whether the market breaks out or collapses, remember to wait for confirmation before taking action.
Discipline and patience are the foundation of successful trading. Focus on preserving capital and only act on high-probability setups.
MyCryptoParadise
iFeel the success🌴

ATAUSDT: Will the Bulls Hold the Line, or Are We Heading Lower?Yello, Paradisers! #ATAUSDT is at a pivotal moment, and the next move could define the trend for days to come. After a sharp breakout, ATA has pulled back toward a critical demand zone. Will buyers step in to defend this level, or are we about to see another leg down?
💎The supply zone at $0.1844 has proven to be a major hurdle, as sellers overwhelmed the bullish momentum after the recent breakout. This zone has become a key resistance level, and breaking above it is essential for the continuation of an uptrend. On the other hand, the demand zone at $0.1337 is where buyers need to make a stand. A failure to hold this level would likely send #ATA tumbling down toward the next significant lower demand at $0.1038.
💎Currently, the 100 EMA is providing dynamic support. If the price respects this level, it could signal the beginning of a recovery. A bounce here could trigger renewed bullish momentum, while a breakdown would confirm bearish control.
💎Paradisers should remain cautious and wait for clear signals before taking action. A strong bounce at the demand zone with high volume would be a good indicator of renewed buyer interest, while a breakdown below $0.1038 would likely open the door to much lower levels.
Stay disciplined and patient, and remember to always wait for confirmation before entering a trade. Protect your capital, stay focused, and trade like a pro! Share your thoughts in the comments what’s your move for #ATA?
MyCryptoParadise
iFeel the success🌴
