OP/USDT – Order Block Accumulation + RSI OversoldOP is currently bound within a consolidation range, showing signs of a potential order block formation—a zone where larger players may be accumulating. These structures often precede impulsive, expansive moves once the range is broken. We're seeing tight price action between $0.400 and $0.410, which could act as a springboard.
🔍 The RSI is deep into oversold territory, signaling that the selling momentum may be fading. This aligns with the idea of a reversal or breakout from the current accumulation zone. Watch for volume spikes or candle structure shifts as potential early signals.
📊 Trade Idea:
Entry Zone: $0.400 – $0.410
Take Profit Targets: $0.462 → $0.499 → $0.570
Stop Loss: Below $0.39
Cryptotrading

Bitcoin: Strong Downtrend – Don’t Miss the Sell Chance!Hello traders,
Although Bitcoin showed a slight recovery on Wednesday, the crypto market is still struggling after the sharp decline in early October. Selling pressure remains strong, as the market hovers near recent lows with no clear signs of recovery.
With uncertainty surrounding the U.S. economy and ongoing trade tensions with China, investors are avoiding risk – further weighing on risky assets like Bitcoin. In addition, the drop in gold prices hasn’t provided enough buying momentum for the crypto market to rebound.
The BTC/USDT chart clearly shows a strong downtrend with a steep descending trendline, and resistance around $112,000 has already been pushed back. The price is expected to continue falling, with the next support area around $102,000.
A great opportunity to sell Bitcoin and take advantage of this downtrend!

ETHUSDT – Sideways Trend with Clear Technical StructureETHUSDT is currently trading within a sideways range between $3,750 and $4,580. The support at $3,750 has been tested multiple times and remains strong, while the resistance at $4,580 continues to be tested but has not been broken yet.
Technical Analysis:
EMA34 and EMA89 are providing support from below, indicating that the long-term uptrend is still intact, although in the short term, the market is struggling to break through the current resistance levels.
The price is moving within a narrow range, creating a clear sideways trend. However, if the price cannot break $4,580, there is a possibility it will continue to trade within this range.
News:
Institutional inflows into ETH remain steady, supporting the long-term uptrend, although in the short term, the market lacks the momentum to break the resistance levels.
Macro factors like the U.S. CPI and expectations for Fed rate adjustments will impact the cryptocurrency market, but overall, ETH continues to maintain good stability within this range.

Price Doesn’t Move Randomly: It Hunts Liquidity1. Introduction
Every trader starts by learning “supply and demand.”
Sounds logical: buyers push price up, sellers push it down.
But that’s not how it really works.
Price doesn’t move because of demand.
It moves toward liquidity — where orders exist.
The market’s goal is simple: find liquidity, fill it, and move on.
2. What Is Liquidity?
Liquidity is the pool of pending orders sitting on the chart — stop losses, limit orders, and resting positions.
Think of them as magnets.
Above highs: stop losses from shorts.
Below lows: stop losses from longs.
Around major levels: limit orders waiting to be filled.
Institutions and large players can’t just “market buy” or “market sell” huge positions — they need liquidity to fill them efficiently.
So, price hunts it.
3. The Game of Stop Hunts
You see it all the time:
A breakout above resistance → instant reversal.
A sweep below support → immediate bounce.
That’s not coincidence — that’s a liquidity grab.
Big players push price to trigger stop losses, collect those orders, and then reverse in the true direction.
Retail traders call it “manipulation.”
Smart traders call it “the business model.”
4. How to Read It
Stop focusing on predicting direction — start identifying where liquidity sits.
Look for:
Equal highs/lows → obvious stop clusters.
Clean levels that everyone sees → perfect trap zones.
FVGs or inefficiencies → likely rebalance points post-hunt.
Instead of asking “where will it go,” ask “who’s trapped?”
5. Takeaway
The market isn’t random. It’s strategic.
Every wick, every fake breakout, every stop hit — it all serves one purpose: to find liquidity.
Stop trying to predict the next candle.
Start understanding why the candle exists.
Price hunts liquidity — not logic.
BITCOIN (BTCUSD): Bullish Move From Support Confirmed?!
There is a high probability, that Bitcoin will bounce from
a key intraday horizontal support.
As a confirmation, I see a valid bullish CHoCH and a breakout
of a resistance line of a falling parallel channel.
I expect growth at least to 110.800 level.
❤️Please, support my work with like, thank you!❤️
I am part of Trade Nation's Influencer program and receive a monthly fee for using their TradingView charts in my analysis.

SUI Analysis (1H)It seems that an ABC pattern is forming on the 1-hour chart, with wave B already completed.
Wave B appears to have been a triangle.
A buy/long position can be entered on the pullback to the green zone.
The targets marked on the chart are for wave C, which is a bullish wave.
A daily candle close below the invalidation level would invalidate this analysis.
For risk management, please don't forget stop loss and capital management
Comment if you have any questions
Thank You

BTC/USD: Downtrend After RecoveryHello Traders,
Bitcoin is facing a strong downtrend after the weekend recovery lost momentum, with the cryptocurrency lagging behind other risk markets in gaining momentum, thanks to easing US-China trade tensions. Despite an improved risk sentiment, Bitcoin failed to maintain above the 110,000 USD level.
The BTC/USD chart shows a strong bearish pattern. After hitting a high earlier in the month, a sharp decline pulled Bitcoin away from its record highs, wiping out approximately 500 billion USD in market capitalization.
Forecasts suggest that BTC/USD may continue to decline towards support levels at 103,500 USD and 97,900 USD, with TP1 and TP2 targets respectively.
Other News:
Bitcoin is struggling to maintain above 110,000 USD after a sudden drop in early October, increasing risk-averse sentiment in the cryptocurrency market. The optimism surrounding "uptober" is also quickly fading, with Bitcoin showing a loss of over 2% for the month.

SOLUSDT – Short-Term Bearish BiasHello traders,
In my view, SOLUSDT is likely to lean toward a slightly bearish trend in the coming sessions. The preferred strategy is to sell the rally when price approaches the confluence zone around 196–199. Currently, Solana is testing the descending trendline that has been in place since early October — a level that has previously formed multiple tops and faced strong rejections.
News Overview:
The recent listing of the Solana ETF in Hong Kong is a positive sign for the medium term. However, the broader crypto market remains under pressure due to uncertainty in the United States , as ETF approvals are delayed by the government shutdown and the unclear regulatory stance from the SEC. This has limited short-term speculative capital and created a cautious sentiment across the market.
In addition, rumors claiming that a Solana ETF was approved in the U.S . have been refuted by Reuters and Bloomberg, indicating that the market may have overreacted to unverified information. This kind of overhype often leads to short-term corrections following technical rebounds.
Technical Analysis:
On the 4H timeframe, SOL is clearly moving within a downtrend structure, forming a series of lower highs and lower lows.
The 196–199 zone aligns with the descending trendline, the EMA89, and a key dynamic resistance level.
Price is showing weak reaction in this area, suggesting that buying momentum is fading.
If a rejection candle pattern or SFP (swing failure pattern) appears near 197, it could be a good opportunity to enter short positions.
The near-term target lies around 182–175, a strong support zone where price previously bounced. If 175 breaks, the decline could extend further toward 170–168.

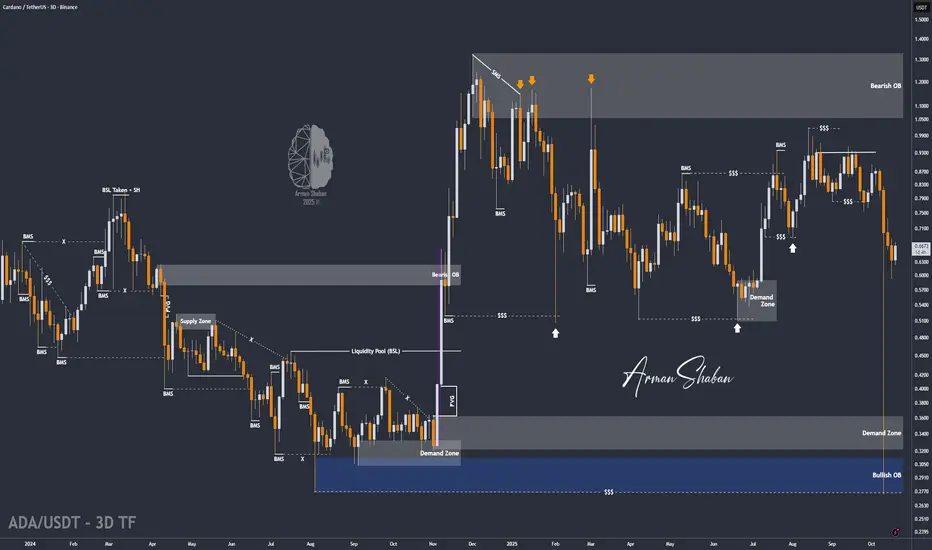
ADA/USDT | Demand Zone Holds, Bulls Gaining MomentumBy analyzing the #Cardano chart on the 3-day timeframe, we can see that after dropping to around $0.59 , ADA once again reacted strongly to demand, rebounding to the $0.66 area. This confirms that buyers are still defending lower levels and that the $0.58–$0.63 zone remains a key support range.
The overall structure is still bullish within accumulation, and this latest bounce could mark the beginning of a gradual recovery phase. As long as ADA holds above $0.63 , the next upside targets remain $0.75, $0.85, and $1.00 — with momentum likely to build if Bitcoin maintains stability above $112K .
This recovery reinforces the idea that ADA is quietly preparing for its next major move upward after weeks of consolidation.
Please support me with your likes and comments to motivate me to share more analysis with you and share your opinion about the possible trend of this chart with me !
Best Regards , Arman Shaban
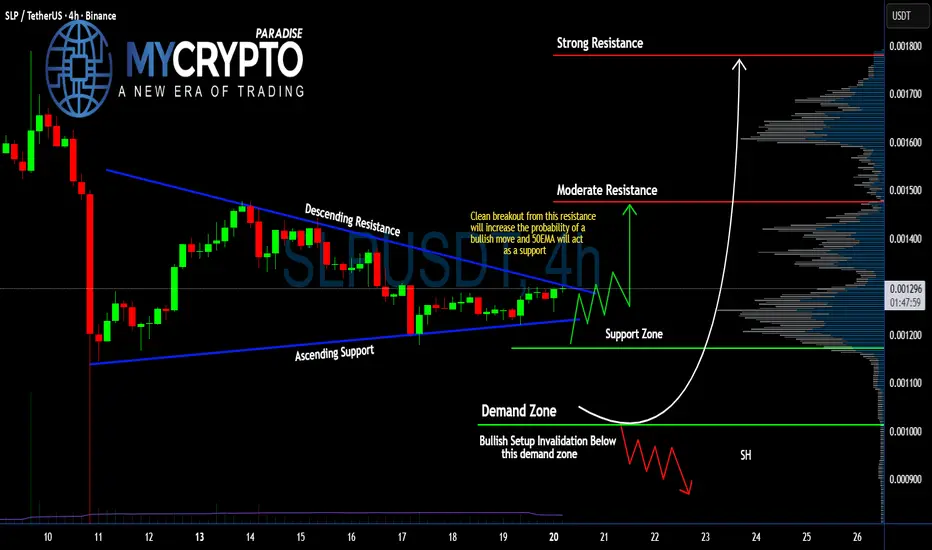
Is #SLP About to Explode Upwards or Another Trap is Set? Yello Paradisers! Are we staring at a breakout just hours away, or is #SLP setting up the perfect trap before the next rug pull? Let's break down what’s really happening with #SLPUSDT:
💎#SLPUSD is currently trading at $0.001296, and it’s stuck inside a narrowing symmetrical triangle with ascending support and descending resistance lines converging quickly. The squeeze is getting tighter, and the price is now right at the edge of a potential breakout.
💎A clean break above the descending resistance, combined with 50EMA acting as support, would significantly increase the chances of a bullish leg up. If that happens, the first target sits at moderate resistance near $0.0014, and we may see an explosive move toward the strong resistance at $0.0017 if volume supports it.
💎On the flip side, if #SmoothLovePotion gets rejected and drops below the ascending support and key demand zone around $0.0010, the bullish scenario will be invalidated. In that case, we expect a steep leg down, especially with low-volume support below. That would trap late buyers and trigger a cascade of liquidations.
💎The support zone between $0.001172–$0.001200 has already shown signs of buyer activity, and as long as we hold above it, bulls still have the upper hand in the short term. Keep an eye on how the price reacts here — it’s the true battleground.
Strive for consistency, wait for clear confirmations, and remember that discipline always beats chasing quick profits.
MyCryptoParadise
iFeel the success🌴
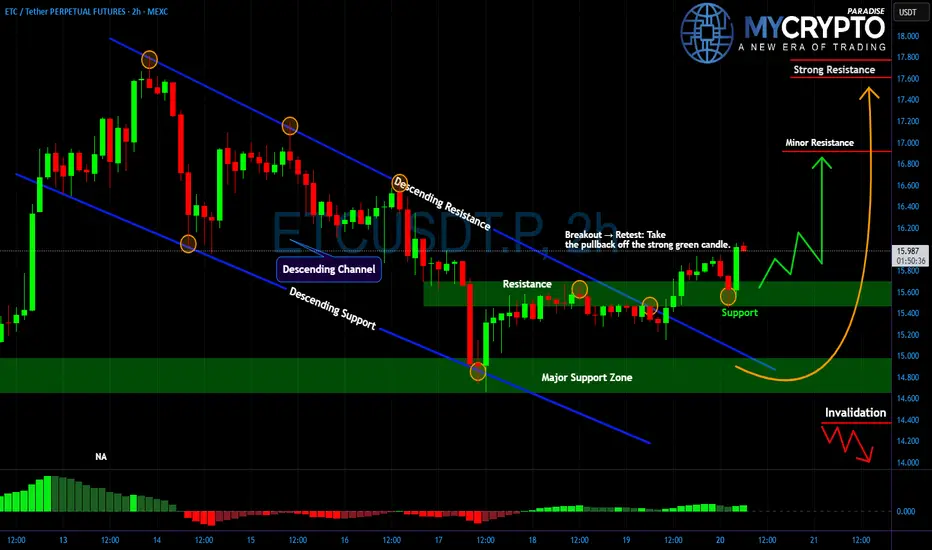
ETC Breakout Confirmed… But Will It Hold or Fake Out?Yello Paradisers, did you catch this clean breakout from the descending channel on ETCUSD just as we expected? If not, you might already be late to the first leg but the real move might still be ahead.
💎#ETCUSDT was trading inside a well-defined descending channel for days, respecting both trendline resistance and support beautifully. The market structure shifted when price broke above the upper boundary of this trend, followed by a textbook retest right at the $15.60 level turning former resistance into support.
💎This move was confirmed by a strong green bullish candle and an uptick in volume, hinting at momentum building up behind the bulls.
💎Currently, #ETC is holding above the key support zone $15.40–$15.80. If this zone holds firm, we expect the price to continue pushing toward the next resistance levels at $16.60 and $17.40. The $17.40 zone is especially important it marks a strong resistance that could either trigger a reversal or lead to an explosive breakout if flipped.
💎On the other hand, any clean breakdown below $15.40 followed by weakness would invalidate this bullish setup and likely drive price back to the $14.00 zone, so risk management is key.
Discipline, patience, robust strategies, and trading tactics are the only ways you can make it long-term in this market.
MyCryptoParadise
iFeel the success🌴
BTCUSDT – Correction Pressure ReturnsHello traders,
After a weak rebound earlier this week, Bitcoin is showing signs of losing momentum as it continues to face rejection around the 110,000 USD zone. On the 4-hour chart, price action remains clearly within a descending channel, indicating that the short-term trend still favors the bearish side.
From a technical perspective, BTC is currently being capped by the EMA 34 and EMA 89, both acting as dynamic resistance levels. The recent bounce appears to be merely a technical pullback following the previous strong sell-off, but lacks the strength to establish new upward momentum. The price structure is forming a tight consolidation zone near the upper boundary of the channel — typically a signal of “a pause before continuation of the prior trend.”
On the news side – Policy and sentiment headwinds
This week, the FSB (G20) warned of “major gaps” in global crypto regulation — a negative sign for market confidence, especially after a massive mid-month liquidation shook investor sentiment.
At the same time, China’s tighter stance on stablecoins is raising concerns about slower Asian inflows, while institutional demand remains weak.
Together, these factors create a market environment of low buying pressure and rising risk , giving bears the upper hand in the short term.
Possible Scenario
At the moment, BTCUSDT is trading within the 106,000 – 110,000 USD range.
If the price fails to make a decisive breakout above 110,000 USD, a continuation of the correction toward the 100,000 USD area remains highly possible — aligning with the lower boundary of the descending channel and a key psychological support zone.

Sell XAU and buy BTCBitcoin’s been creeping up on gold for years. Every dip gets bought. Every lower high gets higher. Now we’re sitting right under that line again.
This looks like the kind of setup that prints history books later. Gold’s had its time.
Not saying to dump your gold chains. Just saying... if you still think gold is the move in 2025, you’re missing the bigger picture.
The world’s changing. So is money.

Bitcoin Under Fire: Bears Take Full Control Below $110KHello traders,
Today, let’s take a look at the overall picture of BTCUSD – where the market is gradually losing its recovery momentum and shifting into a defensive phase. After a series of negative headlines recently, Bitcoin remains under strong selling pressure, and the downtrend is now clearer than ever.
📰 Key News Highlights
Over the past week, several macro factors have weighed heavily on investor sentiment:
- U.S.–China trade tensions have escalated after the U.S. announced expanded tariffs on Chinese tech products, triggering capital outflows from risk assets — including crypto.
- The G20 and FSB issued warnings about “significant gaps” in global crypto regulations, sparking fears of tighter oversight ahead.
- The Federal Reserve struck a more hawkish tone as Vice Chair Michael Barr warned of financial stability risks posed by stablecoins, adding further psychological pressure to the crypto market.
➡️ Combined, these factors have pushed Bitcoin down nearly 15% since the start of the month, reaching around $109,000 with no clear signs of reversal yet.
📉 Technical Analysis
The chart shows that BTC continues to move within a downward-sloping channel, with the EMA34 and EMA89 acting as dynamic resistances — a clear reflection of short-term weakness.
The $110,000 level is a key resistance zone, aligning with both the descending trendline and EMA34. Failure to break above this area could send BTC lower toward $103,000, or even $100,000 if selling pressure expands.
Only a confirmed H4 close above $112,500 would signal a temporary technical rebound.
💡 Trading Advice
The market is weak — don’t try to catch the bottom. Prioritize capital preservation and wait for clear signals before taking action.
Short-term traders: Look to sell on rallies around $110,000–$111,000.
Long-term investors: Watch for price action in the $103,000–$105,000 range, where a potential mid-term technical bottom could form.

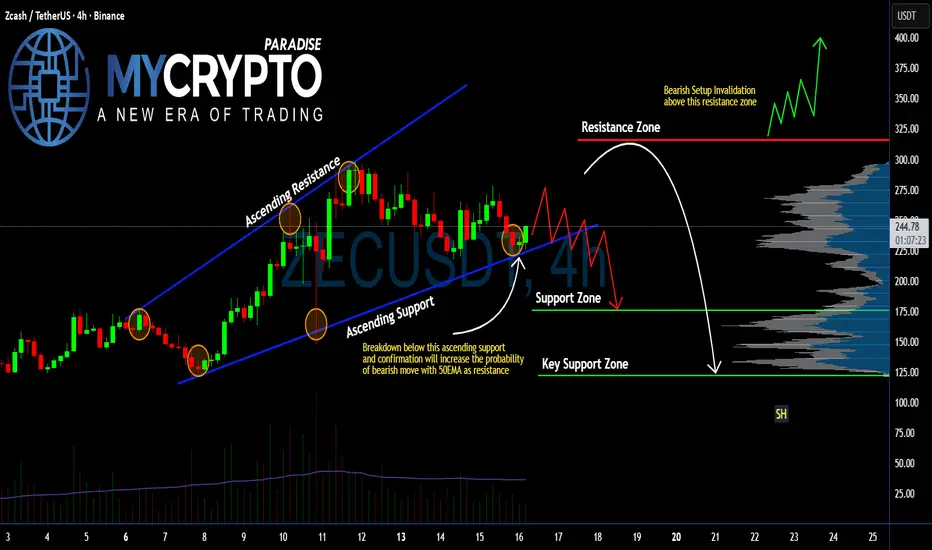
#ZEC Ready to Collapse? Breakdown Here Could Trigger Panic Sell Yello Paradisers! Are you really paying attention to what’s brewing on #ZECUSDT? Because if not, you might be blindsided by what could be a brutal move down. Let's get into the #ZEC setup:
💎#Zcash has been trading inside an Ascending channel, but the momentum is clearly fading. The last bounce off the ascending support was weak, and now we are testing that same ascending support again, but this time, with growing selling pressure.
💎Current price of #ZEC is around $242, and the situation is getting critical. A confirmed breakdown below this ascending support will flip the structure bearish and open up a clean setup toward significantly lower levels. The 50 EMA, which is now acting as dynamic support, will act as resistance. It will only accelerate the downside if this breaks.
💎If this breakdown plays out and is followed by a failed retest of the broken trendline, we could easily see price dump into the Support Zone around $175, and possibly even fall into the Key Support Zone near $121, where stronger buyers may finally step in.
💎On the flip side, the bearish setup is invalidated only if #ZECUSD breaks back above the Resistance Zone at $316. That would shift momentum in favor of the bulls and could spark a sharp rally.
Trade smart, Paradisers. This setup will reward only the disciplined.
MyCryptoParadise
iFeel the success🌴
BTC/USDT – Downtrend ContinuesBitcoin is facing downward pressure after the escalation of US-China trade tensions. Although President Trump made more conciliatory remarks, which helped ease short-term concerns, the global economic uncertainty remains a major factor driving BTC/USDT into a downtrend.
On the chart, BTC/USDT is moving within a clear downtrend channel. Despite a slight recovery, the price is currently fluctuating around $113,129 and could continue to adjust towards the 106,500 USD and 101,800 USD targets in the near term.
With ongoing macroeconomic instability and no strong signs of recovery, Bitcoin may continue to decline in the short term.

BTCUSD Plunges: USD Intensifies Downward Pressure!BTCUSD is currently in a downtrend, with the chart showing Bitcoin's price moving below a clear downward trendline. The resistance level at 116,100 USD remains a key point to watch. If the price fails to break this level, BTCUSD is likely to continue its decline towards the next support levels at 104,500 USD.
A strong increase in USD buying by hedge funds and asset managers, combined with rising trade tensions between the US and China, is driving the strength of the US dollar. As the USD strengthens, BTCUSD faces downward pressure, as risk assets like Bitcoin tend to decrease in value.
With fundamental factors supporting the USD and the chart showing a bearish adjustment, BTCUSD is likely to continue its downward trajectory in the short term, targeting the support zone at 104,500 USD.

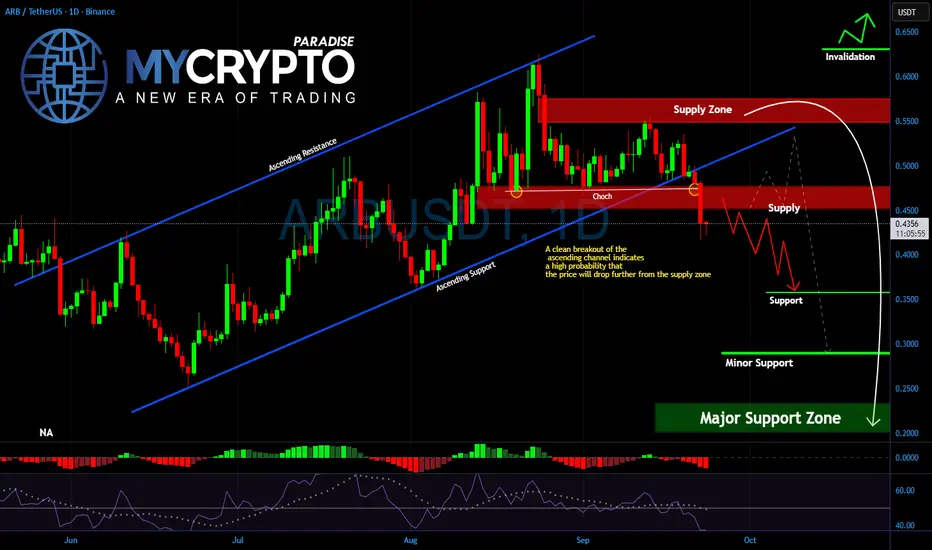
ARB Breaks Structure – Is the Drop to $0.30 Already in Motion?Yello Paradisers, what happens when a strong uptrend finally cracks under pressure? That’s exactly what we are seeing with #ARBUSDT right now. The ascending channel that carried price action since June has officially been broken, and history tells us this is rarely a small signal. A clean breakdown from such a channel often marks the beginning of a deeper move, and #ARB is showing all the signs that more downside could unfold.
💎After failing to hold inside the channel, #ARB retested the broken zone but quickly rejected from supply around $0.45–$0.50. This rejection zone is now the key barrier standing above price. As long as #ARBITRUM trades below it, sellers are in control, and the probability of further decline remains high.
💎The next important area to watch lies at $0.35, which acts as the first strong support. If that level gives way, the move could accelerate toward the $0.30 minor support before potentially reaching the major support zone around $0.20–$0.25. This entire area is where bigger buyers could look to step in, but until then, the path of least resistance is clearly to the downside.
💎Invalidation for this bearish outlook would only come if AMEX:ARB reclaims the $0.55 supply zone and holds above it. Until then, traders must respect the bearish momentum.
🎖Strive for consistency, not quick profits. These breakdowns are where inexperienced traders get wiped out, while disciplined ones wait patiently for the best opportunities.
MyCryptoParadise
iFeel the success🌴
Is #HBAR About to Break Down Hard? Don’t Get Trapped by BearsYello Paradisers! Are you prepared for what might be the next major shakeout on #HBARUSDT? Let’s break down the current setup of #Hedera:
💎#HBAR has been moving within a descending channel since mid-July, consistently being rejected by the descending resistance trendline. Each bounce has been weaker than the last, and we're now approaching the lower edge of this structure with selling pressure intensifying.
💎As of now, HBAR is trading around $0.224, and the next few daily candles will be critical. If you're not managing your risk carefully here, the upcoming volatility could eat your capital alive. The 50 EMA is currently acting as a dynamic resistance, pushing the #HBARUSD lower each time it attempts a bounce. As long as the price remains below this level, the bearish pressure will likely continue.
💎A clean breakdown below the descending support of this channel would be a high-probability bearish confirmation. If we get a breakdown + retest rejection, #HBAR could accelerate toward the Moderate Support zone at $0.166. Then eventually, reach the Strong Demand Zone near $0.127, where we expect more serious buy interest to step in.
💎The bearish setup is invalidated on a confirmed breakout above the resistance zone at $0.255–$0.278. Only if price reclaims and holds above this range will we consider shifting back to a bullish bias. Until then, every bounce is likely to be sold into.
Trade smart, Paradisers. This setup will reward only the disciplined.
MyCryptoParadise
iFeel the success🌴

Bitcoin Bullish Confirmation Above $119500 | Watch November MoveBitcoin is currently trading below a key resistance level of **$114,500**, and a **strong Monday closing on 13 October above this level** is crucial for confirming a short-term bullish recovery.
If BTC successfully closes above **$114,500**, the next important resistance will be around **$119,500**.
A **Monday closing on 20 October above $119,500** would confirm a temporary bullish structure, giving Bitcoin the strength to test higher levels toward the **$127,600 liquidity zone** in November.
Currently, major liquidity is sitting near **$124,600 and $127,600**, which might attract price movement before any major reversal begins.
The market has already taken liquidity around **$101,000**, trapping retail sellers — and now, it may move up to grab the **short-side liquidity** before the next larger downtrend begins.
⚠️ **Be patient and stay disciplined. Avoid long positions for now.**
Focus on the market’s move toward the top, and prepare for **short positions near the highs** to capture the **2026 bear market** — which is expected to last from **September to November 2026**.
📊 The market often manipulates both sides before showing the real direction. Watch levels carefully and trade with confirmation.
💬 **Follow me on TradingView** for more Bitcoin and Ethereum updates — and comment below which coin you’d like me to analyze next!

XCN Analysis (12H)From the point marked START on the chart, the correction of XCN seems to have begun.
Based on the wave structure, the price now appears to be in a complex ABC. Wave B of B looks like a diametric, and we are currently in the middle of wave F.
Once wave g of this diametric is completed, we can enter a position within the green zones, which represent our entry areas.
⚠️ Note that this asset is risky and highly volatile, so make sure to enter only in spot with proper risk management.
The closing of a daily candle below the invalidation level will invalidate this analysis.
For risk management, please don't forget stop loss and capital management
When we reach the first target, save some profit and then change the stop to entry
Comment if you have any questions
Thank You

INJ Looks Bearish (8H)The INJ coin is under selling pressure, forming a bearish triangle that has recently completed. This triangle ended at the point where we placed the red arrow on the chart.
After the triangle, we expect at least three legs down to complete the minimum sub-waves of a bearish pattern.
Once Wave B is completed around this area (or slightly higher), the price may enter a bearish phase.
The target is the green line on the chart.
If a daily candle closes above the invalidation level, this analysis will be invalidated.
For risk management, please don't forget stop loss and capital management
Comment if you have any questions
Thank You

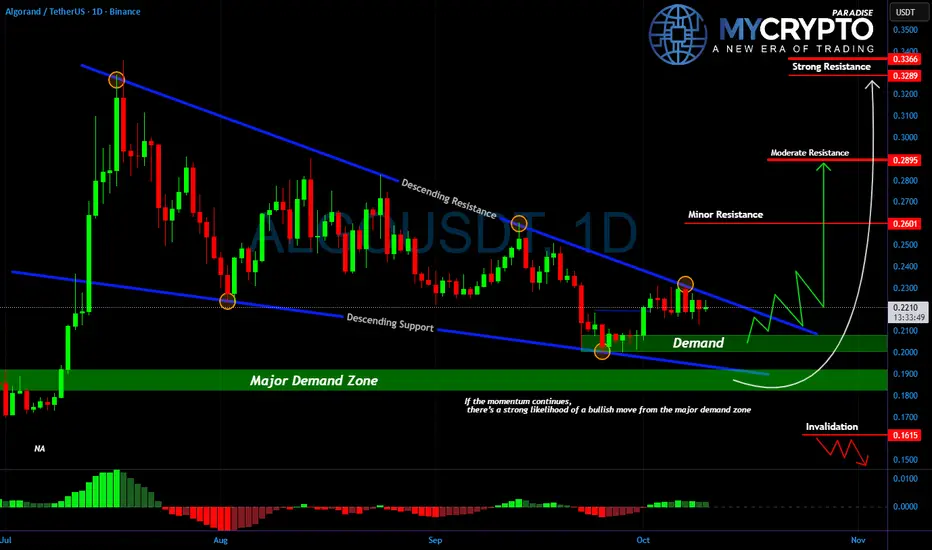
ALGO on the Edge: Will the Next Move Catch Everyone Off Guard?Yello Paradisers, are you prepared for what could be the breakout that surprises the entire market? While most traders are distracted, #ALGOUSDT is quietly compressing inside a clean descending wedge structure, and the pressure is reaching a critical point.
💎After weeks of bleeding, #ALGO has established a solid base within the major demand zone between $0.185 and $0.20. This area has held strong multiple times, showing clear signs of aggressive buying each time price touches down. It’s no coincidence this zone is being defended, and smart money knows it.
💎Price is now consolidating just below the descending resistance line, and every touch to the downside has become weaker, signaling a potential shift in market control. If momentum builds from here, a confirmed breakout above the $0.23 level could open the path toward higher targets. The $0.26 region will likely act as the first minor resistance, followed by stronger supply zones around $0.288 and $0.3289, where historical selling has previously stepped in.
💎However, as always, we must stay grounded in probabilities. Invalidation sits clearly below $0.1615. A break beneath that level would invalidate the bullish structure and shift the momentum back into the hands of the bears.
💎Until then, this remains a high-probability accumulation pattern. But remember, the market often fakes in one direction before delivering the real move. That means a final shakeout can’t be ruled out before the breakout. This is where emotional traders get liquidated and where the disciplined ones wait with confidence.
Strive for consistency, not quick profits. Treat the market as a businessman, not as a gambler. This is the only way you will make it far in your crypto trading journey. Be a PRO.
MyCryptoParadise
iFeel the success🌴