Cartesi LongBuying CTSI here ($0.34)
- Daily trendline ✔️
- Rsi Daily Div ✔️
- Under Value Area ✔️
Observation:
I'm buying before daily close so if it closes below I can cut it with min risk.
Best entry would be closer to trendline level $0.33 and use RSI 52 at daily close to use it as a confirmation that price will bounce from that area.
Target $0.40
CTSIUSDT


#CTSI/BTC Breaking out ready for Potential 85% Rally.Welcome to this quick altcoin setup.
CTSI is breaking out with all the strong fundamentals in the coming few weeks.
Expecting this one to perform well.
Technically it broke out of the triangle showing signs of accumulation at this price level.
ENTRY: 512 TO 540
TARGET:
687
715
845
937
SL : 467
DYOR before taking this trade.
Do hit the like button if you like my setups and 100% accurate BTC updates.
Thank you
#PEACE

CTSI - $0.7858CTSI is trading above the resistance zone of $0.2845. As long as it is above this support area, we could start seeing a move towards $0.3465, $0.4303, $0.5661, $0.7019 and $0.7858. Failure to hold the support of $0.2845 could lead to a drop towards $0.2107 which would be a good area to long CTSI. CTSI has a good support at $0.2107 and $0.1536.
CTSI is currently trading at $0.303785 with a market cap of $90,588,068. Its 24 hour trading volume was $11,139,359.

CTSI ready for pumpCTSI is trading smoothly inside the parallel channel. Also created a bull flag with 50MA support.

CTSI Ascending Triangle*CTSI is forming ascending triangle
*testing previous high level at $0.30
*small cup&handle as well
*as well as above moving averages, price will push until triangle formation near $0.45
Please read this first !
This post does not provide financial advice. It is for educational purposes only! You can use the information from the post to make your own trading plan for the market. But you must do your own research and use it as the priority. Trading is risky, and it is not suitable for everyone. Only you can be responsible for your trading.
Regards


CTSI/USDT triangle and g hooktriangle and g hook pattern created if snnr level is broken its can Grow up between 10 to 47 %%


CTSI: About 100% profitThe wedge broke up and it's about to explode!
Please hit LIKE if you find this useful!

CSTIUSDT 4H long setup; W-formation patternTA Explained
After a strong impulsive move CTSI pulled back and formed a support area. It dropped below it twice but regained it now again. Price action is forming a W-formation now. Consolidation at the neckline would increase the trade probability.
Trade setup
Best entries: 0.18439 - 0.20996
TP1: 0.26322
TP2: 0.34242
TP3: 0.41718
SL: 0.15344
RR: 5.09
Max leverage: 1x
—————
Do Your Own Research (of course)
Trade at own risk (of course)
Only trade what you can afford to lose (of course)

CTSI looks like it has found strong support at 0.195-0.2 rangeCTSI has found strong support at 0.195-0.20 range. Looks bullish . Predicted price action given.
NOT FINANCIAL ADVISE!

Cartesi (CTSI) formed Gartley move for upto 200% bullish rallyHi, dear friends, hope you are well and welcome to the new update on Cartesi (CTSI) token.
On the daily time frame chart, the priceline of CTSI token has completed the final leg of the bullish Gartley and entered the potential reversal zone. There is also 25 SMA in buying zone and the 50 SMA below the buying zone.
This trade has a huge profit possibility up to 200%, and the loss possibility is 35%.
Note: Above idea is for educational purpose only. It is advised to diversify and strictly follow the stop loss, and don't get stuck with trade.

CTSI Long Midterm SignalGiven the strong resistance that has formed in the range of 0.20 and on the other hand based on the RSI and MACD, we expect it to resume its growing trend, I entered the Long Position and I am waiting for up to 100% profit in a short time.

🆓Cartesi/USDT Analysis (18/2) #CTSI $CTSIThe selling force has decreased and we can expect a recovery in CTSI in the next few days.
However, to be sure, we should wait for CTSI to close the 8H candle above $0.24 zone, then we will buy because if the buying force does not return to CTSI, it will easily fall to $0.15 zone or deeper.
📅NEWS
👉Mar 31 : Descartes SDK v1.0
👉Mar 31 : Noether's PoS v1.1
👉Jun 30 : Rollups on Testnet
👉Jun 30 : On-Chain Infrastructure
👉Jun 30 : Noether's PoS v2.0
👉Dec 31 : Rollups on Mainnet
👉Dec 31 : Rollups Marketplace
👉Dec 31 : Rollups Aggregator
📈BUY
-Buy: 0.22-0.24$ if A. SL if B
📉SELL
-Sell: 0.33-0.35$. SL if A
-Sell: 0.43-0.45$. SL if A
♻️BACK-UP
-Sell: 0.22-0.24$ if B. SL if A
-Buy: 0.15-0.16$. SL if B
❓Details
Condition A : "If 8H candle closes ABOVE this zone"
Condition B : "If 8H candle closes BELOW this zone"

CTSI DAILY CHART LOOKING BULLISHIf CTSI closes above the resistance line on the daily chart, this will be huge.
Entry: Daily close above the resistance line
Potential target would be 0.53
Note: Please also closely watch BTC dominance and total market cap charts. BTC dominance < 0.62 and increase in total market cap would be important for this to work out.

#CTSI .. #Cartesi is forcing a breakoutPefect buy now...
We just retraced to golden ratio fib 0.618... we make breakout soon and we are ready for new ATH
Very good coin to just buy and hold...
Stacking is huge 189% APY
These prices will be history soon..
On 31 Mar big update for #CTSI
Now is 0.245$ .... easy 4x - 10x next weeks!!!
Enjoy!!!

Nice upside trade with 3 entrys Hello traders, here we have a perfect trade with a very nice impulse and a complete correction. This trade has the huge potential to make ATH so don t miss the moves.

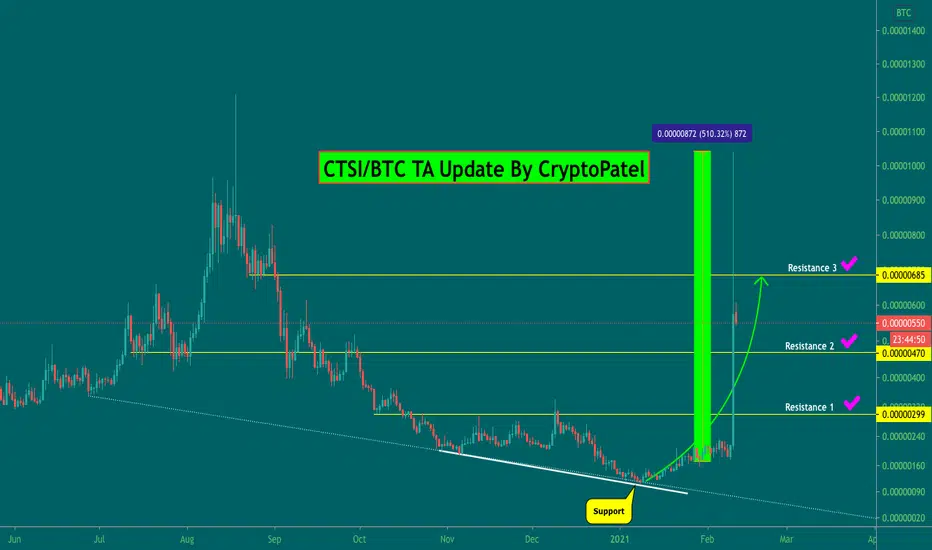
CTSI/BTC now 600% profit so Please profit Guys#CTSI/BTC profit update:-
#CTSI/BTC currently trading at 580 Satoshi and Went upto 1000 Satoshi.
600% pure profit guys.
Hope you all are happy with my analysis.
Entry:- 170 Satoshi
Targets:-
Target 1:- 299 ✅
Target 2:- 470 ✅
Target 3:- 685 ✅
Target 4:- Moon ✅
Please click LIKe button and Appreciate my hard work.
Must follow me for latest crypto real time updates.
Thank you.
CTSI Cartesi has to decideCan we see more upside or are we going to correct
Indicators and Bitcoin rising again telling me we could go down VS BTC
But
Lot's of events in calendar: coinmarketcal.com
Tell me what you think?

#CTSIUSDT Trading plan!Hi friends!
The coin has been accumulating energy since September, the last 2 months the price has been pushed towards a strong mirror level.
I will buy on the breakdown of the 0.06348 level!
I expect a good upward movement.
Stroke potential + 40%
✔ Do not forget to trade using your own trading system and with stops!
✔ If you like what I do, put 👍 and subscribe! 🙌👀
✔ This is the best gratitude for my work! 💕
