2298% ROI on CTSICartesi (CTSI) is one of my favourite coins in which I believe because of their technology and community. It is decentralized infrastucture that supports Linux and mainstream software components. There are apps on their Blockchain OS like Creol, Simracer Coin, Dakai Locus etc. Also you can find pr

CTSI/USDT i think price might go up
Remember to have entry orders in place to average this trade’s entry, and take 30% of profits in the first 2 Targets. After taking profits, move stops to entries or to breakeven levels. Keep in mind current market conditions and risk management.

CTSIUSDT UPDATE#CTSIUSDT
UPDATE
Hey all friends and traders. Hope you are enjoying our analysis. we are here to analyze CTSI today.
Falling wedge formation in 1W time frame .
Incase of Successfully breakout Expecting Massive Bullish wave📈

CTSIUSDT IDEAHello Trading view Family / Fellow Traders.
I hope you have used and benifited from the previous analysis .
In today trading session we are monitoring CTSIUSDT for a buying opportunity,
CTSIUSDT UPDATE
Falling Wedge Breakout Has Already done in 1D time frame ✅💥
Expecting Bullish Rally Towards 0.

CTSI/USDT in the crucial area is required to bouncing from here!💎 The recent market dynamics surrounding #CTSI have indeed been quite notable. Currently, the price is at a critical support demand area, where a bounce is necessary to sustain upward momentum.
💎 If the bounce proves to be valid, the next hurdle is breaking out of the descending channel. Achieving
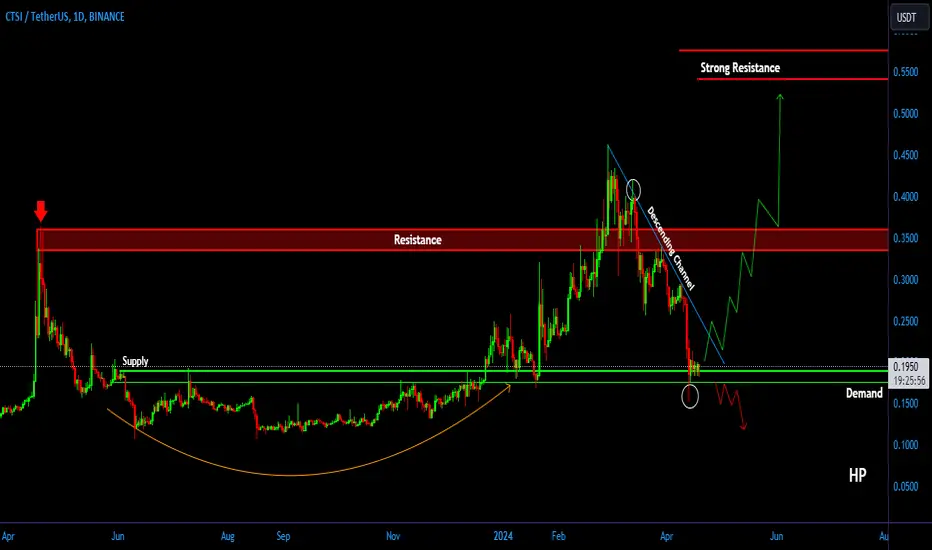
#CTSI +500% PROFIT IN Q1 2024#CTSI has Confirmed a Descending Channell Breakout and retest after a Long Consolidation.
Now, Bulls need Volume to PUMP it Hard 📈📈🚀🚀🔥🔥..

i see bullish momentum on Cartesi ( CTSI )i see bullish momentum on Cartesi ( CTSI ) targets and tps and Sl mentioned
lets see market prove me right or rong

CTSI/USDT Breakout Alert! Indicating Continue the Upward Move.💎 CTSI has made a significant breakthrough in the cryptocurrency market by successfully breaking out of the resistance rounding bottom pattern, indicating a bullish reversal movement.
💎 The price is currently undergoing a retest at the support level ranging from 0.354 to 0.324, with the potential t

CTSI/USDT bullish reversal from key support? 👀 🚀CTSI analysis💎 Paradisers, get ready for an electrifying trading journey with #CTSIUSDT, now stationed at a pivotal support zone, hinting at an imminent market turnaround.
💎 An exploration of #CTSI recent movements reveals struggles to break past the resistance at $0.3825, suggesting potential bearish signals.

CTSI/USDT I BUY SETUP✔︎📈 BINANCE:CTSIUSDT SIGNAL
✔︎ENTRY : 0.4068
🏓TARGETS :
✔︎T1 : 0.4319
✔︎T2 : 0.4570
✔︎T3 : 0.4880
✔︎Long term T4 - T5
✘STOP : 0.3817
🚦Stop Trigger:
• If you make capital management: Stop is activated when one candle opening and closing
below the stop level of the same time frame of the signal.

See all ideas
Frequently Asked Questions
The current price of CTSI / TetherUS (CTSI) is 0.1901 USDT — it has fallen 0.94% in the past 24 hours. Try placing this info into the context by checking out what coins are also gaining and losing at the moment and seeing CTSI price chart.
CTSI / TetherUS (CTSI) reached the lowest price of 0.0151 USDT on Apr 23, 2020. View more CTSI / TetherUS dynamics on the price chart.
See the list of crypto losers to find unexpected opportunities.
See the list of crypto losers to find unexpected opportunities.
Crypto markets are famous for their volatility, so one should study all the available stats before adding crypto assets to their portfolio. Very often it's technical analysis that comes in handy. We prepared technical ratings for CTSI / TetherUS (CTSI): today its technical analysis shows the sell signal, and according to the 1 week rating CTSI shows the sell signal. And you'd better dig deeper and study 1 month rating too — it's sell. Find inspiration in CTSI / TetherUS trading ideas and keep track of what's moving crypto markets with our crypto news feed.
CTSI / TetherUS price has fallen by 5.47% over the last week, its month performance shows a 29.64% decrease, and as for the last year, CTSI / TetherUS has increased by 12.29%. See more dynamics on CTSI price chart.
Keep track of coins' changes with our Crypto heatmap.
Keep track of coins' changes with our Crypto heatmap.
CTSI / TetherUS (CTSI) reached its highest price on May 9, 2021 — it amounted to 1.7500 USDT. Find more insights on the CTSI price chart.
See the list of crypto gainers and choose what best fits your strategy.
See the list of crypto gainers and choose what best fits your strategy.
CTSI / TetherUS (CTSI) is just as reliable as any other crypto asset — this corner of the world market is highly volatile. Today, for instance, CTSI / TetherUS is estimated as 4.87% volatile. The only thing it means is that you must prepare and examine all available information before making a decision. And if you're not sure about CTSI / TetherUS, you can find more inspiration in our curated watchlists.
You can discuss CTSI / TetherUS (CTSI) with other users in our public chats, Minds or in the comments to Ideas.
CTSI / TetherUS highest price ever is 1.7500 USDT, and the maximum drawdown from this value it has ever experienced is 11.52 K%, when CTSI / TetherUS reached 0.0151 USDT. See more of CTSI price dynamics on the chart.
The safest choice when buying CTSI is to go to a well-known crypto exchange. Some of the popular names are Binance, Coinbase, Kraken. But you'll have to find a reliable broker and create an account first. You can trade CTSI right from TradingView charts — just choose a broker and connect to your account.