NQ and ES quarterly theory cycle.There you have it ,the manipulation has happened ,just go check on my previous analisi here attached.
IF the leg in the purple box will be broken ,meaning that the weekly down colse candle will close below the lower previous swing ,we will certainly see new lower targets for the year to come .
Cycleanalysis

Bitcoin 15m | Measured Cycle RecurrenceThe current decline is occurring within a recurring intraday cycle of roughly 144 bars, visible across multiple prior swings.
Previous cycle peaks aligned with structural resistance, followed by accelerated contraction into the next trough.
What matters here is not price direction, but phase alignment.
When cycle peaks fail to resolve higher, expansion gives way to compression regardless of narrative context.
This chart is not a forecast.
It documents recurrence and timing already expressed by price.
Cycles define the rhythm.
Price simply oscillates within it.

PONY AI - Accumulation is showing up againSomething quiet is happening here.
After a sharp selloff and failed attempts to regain momentum, price has drifted back into a zone where Accumulate is starting to light up again . This is not a breakout signal - it’s a context shift .
What matters:
• Price is trading close to a rising structural baseline
• Volatility has compressed compared to the prior leg down
• Accumulate has flagged repeated accumulation events, suggesting absorption rather than distribution
• Institutional volume remains low — this looks early, not crowded
This does not mean price has to reverse immediately. Accumulation often precedes long periods of frustration and range-building. But structurally, this is the type of zone where risk starts to compress , not expand.
Key takeaway:
Accumulate doesn’t tell you what will happen next.
It tells you where behavior is changing .
As long as price holds this region and accumulation continues, downside risk becomes more controlled - while upside remains optional.
Context ≠ signal.
Patience > prediction.
🟢 Tool used: TrendGo Accumulate (free)

TEMPUS AI (TEM) - Context Is Building AgainThis is not a signal. This is context rebuilding.
Accumulate perspective (1D)
Price is once again approaching the TrendGo Accumulate zone on the daily timeframe.
Historically, this level has been highly meaningful:
• Every previous pullback into the Accumulate zone resulted in strong upside expansions
• Accumulate acted as a structural base, not a simple price support
This is the same recurring behavior we’ve highlighted in prior TrendGo analyses:
Price tests structure → structure holds → expansion follows
What matters right now
• Price ≈ Accumulate → the market is testing whether the structural base is still valid
• No active “Accumulation Detected” yet → this is a context zone, not confirmation
• As long as Accumulate holds, the structural bias remains constructive
This is where professionals observe - not anticipate.
The Pelosi narrative (properly framed)
Recent disclosures show Nancy Pelosi increasing exposure again.
Within the TrendGo framework:
• Narrative alone is never a signal
• Narrative only matters when structure supports it
That’s what makes this setup interesting:
Recurring institutional narrative + price interacting with a proven structural zone
TrendGo takeaway
• This is not a FOMO moment
• This is a structure-awareness moment
•Real conviction only comes after system confirmation , not before
Structure → Confirmation → Timing
That’s how TrendGo removes guessing from market decisions.
Educational content only. Not financial advice.

MOS - Accumulation is active. Context first.This chart is not about timing a breakout.
It’s about recognizing where long-term interest is building .
On the weekly timeframe, TrendGo Accumulate has been active multiple times across the same price region.
Price keeps rotating around the Accumulate curve, forming a broad accumulation zone , not a trend.
What matters here:
• Accumulate continues to hold price from below
• Multiple accumulation signals appeared during weakness
• Volatility contracts → expansion will come later, not now
• Institutional volume remains low, which confirms this is still a pre-decision phase
This is not a signal.
This is context.
The market is doing what accumulation phases usually do:
absorbing supply, testing patience, and shaking confidence.
Only after structure stabilizes and other layers confirm does timing matter.
Until then - this is a zone to observe , not to predict.
Accumulate shows where patience matters .
Nothing more. Nothing less.
Structure → then momentum → then timing.
—
TrendGo Accumulate
Clarity over chaos.

OXY (Occidental Petroleum) - Weekly - Accumulation DetectedOXY doesn’t look like a trend right now. It looks like a compressed spring - quiet, coiled, and waiting for release.
1) What Accumulate is showing (free tool only)
On the weekly timeframe, TrendGo Accumulate is detecting a clear accumulation phase .
This tells us the market has entered a zone where, historically, position building matters more than short-term noise.
A key detail: Institutional Volume remains LOW.
That’s important. This is not a euphoric, headline-driven move - it’s a quiet phase , where strong moves often start after most participants lose interest.
2) Price structure: compression and decision zones
Price has spent a long time moving sideways in a tight consolidation range.
This kind of structure usually does three things:
• drains patience,
• shakes out weak positioning,
• sets the stage for a decisive expansion.
Key weekly levels to monitor:
• Support / defense zone: around $38.50
→ If this level fails, the accumulation thesis weakens.
• Mid-range reaction level: around $48.50
→ Acts as a recurring balance point inside the range.
• Critical breakout level: around $56.50
→ Above this level, the market stops being a range and starts attempting a trend transition.
3) How to interpret this (no guessing)
This is not a buy signal. It’s context.
• While price remains compressed → treat OXY as a tracked setup, not a forced trade.
• A weekly break and hold above $56.50 would be the first real confirmation that accumulation is resolving into a higher-volatility move.
• Rejection from resistance does not invalidate accumulation — it simply means the process is still ongoing and patience is required.
Bottom line
OXY is in a classic “quiet before the move” phase.
Accumulate confirms accumulation, price is compressed, and volatility is being stored rather than released.
The real question is not if the range breaks — but when , and in which direction.
Question for you:
Do you prefer to track setups before they become obvious - or only once the breakout is already behind you?

BTC Bearish cycleAs I see it BTC we are going into a long term retracement below the 50% of the previous bullish range.
The price target is at OTE level (Optimal Target Entry)around 45.000$ .
BTC revolve in cycles ,bearish and bullish and it often ,almost always repeat the same price delivery at the same time.
The bearish cycle :
-365 day
The bullish cycle :
-around 1060 days
But how do I calculate?
Placing a Fib projection from the lower low to the higher high of the BEARISH range, once the leg(range) is broken(the higher have been taken , we can approximate our target as you can see in the image are pretty precise.
To find the bearish target ,always below 50% of the Bullish (explanation on image).
I do so expect to go into a big buy by this year October .
This is a fully technical and only analysis ,but long term calculations do not lie.
Let me know in the comments what you think about it.

CHAINLINK (LINK) - Are you watching accumulation, or just price?Most traders focus on price swings .
Institutions focus on where price stops falling and time starts doing the work .
That’s exactly what we’re seeing on LINK right now.
⸻
🔍 What TrendGo Accumulate is showing
For 94 bars , LINK has been moving inside a clear Accumulation zone :
• Price is holding above the Accumulate baseline
• Volatility is compressed
• Institutional volume remains low but persistent
• Every deeper pullback gets absorbed, not rejected
This is not a breakout phase.
This is inventory building .
⸻
🧠 How to read this correctly
Accumulation phases are not about speed.
They are about patience and positioning .
Historically, when LINK entered similar Accumulate zones:
• Price stopped trending down
• Time replaced volatility
• Expansion came after most traders lost interest
Right now, price is still boring.
That’s usually when risk is lowest - not highest.
⸻
⚠️ What would invalidate the idea?
• Losing and closing below the Accumulate zone
• Accumulation turning into distribution (no longer absorption)
Until then, this is structure before direction .
⸻
📌 Final thought
You don’t need to predict the breakout.
You need to recognize when the market is preparing one .
This is what TrendGo Accumulate was built for.
What do you see here - accumulation or just another range? 👇

Ripple -Keep an eye on cycles Hello everyone. I hope you had some wonderful days with your family and loved ones over the last two weeks during the Christmas and New Year holidays. Now we are at the start of a new year, which is usually the time when we step back and scan higher degree time frame charts to get a sense of what may happen in 2026, especially by looking at monthly and even yearly structures.
The first market I want to look at is Ripple. As you know, XRP has a lot of upside potential and there is a lot of optimism around this coin, mainly because it was trapped in a very large range for a long time due to the lawsuit filed by the U.S. Securities and Exchange Commission against Ripple Labs back in December 2020. The SEC claimed that XRP was an unregistered security, which created huge legal uncertainty. Many US exchanges delisted or suspended XRP, large funds avoided it, and new capital stayed away. With demand capped, price moved sideways for years.
Now that the market has finally broken to new all time highs, it feels like everyone wants to ride this trend further, and I do think more upside is possible. However, as you know, markets never move in straight lines, and even in strong uptrends we get sharp and sometimes aggressive pullbacks. These large swings, especially when they appear late in a cycle, can offer both opportunities and serious risks.
If you look at the cycle analysis on the monthly chart, it suggests we could already be in the late stages of the current bull run. On top of that, the structure can be interpreted as a fifth wave coming out of a large triangle. This opens the door for another push higher, possibly toward the 4 area, or even higher into the 5 to 6 zone. However, this could also represent a final leg up before the market starts a much larger and higher degree correction.
If we do get one more strong push higher next year, it is important to be very careful. Cryptocurrencies are extremely volatile, and once sentiment shifts, retracements can be deep and fast. If you are already riding this move and are waiting for one more new high, that could very well be the opportunity to take profits, while others are rushing in late.
All the best and good luck catching some nice trades in 2026.
Grega

Predicting Bitcoin Cycle Tops and Bottoms with Schiff PitchforksIntroduction: What is the Schiff Pitchfork ?
On Bitcoin's monthly timeframe, the pitchfork filters out noise and creates a stable rising channel where the median line and outer bands act as dynamic support and resistance. This framework helps identify where expansions and corrections tend to begin and end, making it exceptionally useful for spotting cycle tops and bottoms.
The 2017 Cycle: Pitchfork Accuracy in
The 2021 Cycle: Repeating Pattern Confirmation
The Top:
Bitcoin accelerated sharply into the cycle top near the upper boundary of the pitchfork
Price pierced above the channel then failed to hold, signaling an overheated phase
This marked the transition from expansion to bear market
The Bottom:
The corrective leg drove BTC down into the lower half of the pitchfork
The eventual cycle bottom formed close to the channel floor
The same structure that capped the bull market caught the bottom of the bear
Key Takeaway:
The 2021 cycle replicated the 2017 pattern, proving this isn't curve-fitted to one move
The tool works consistently across multiple cycles
The Current Cycle: What the Pitchfork Shows for 2025–2026
The Top Formation
Cycle top marked near the upper boundary of the pitchfork, exactly as predicted
The top aligns perfectly with the upper band trajectory, matching the 2017 and 2021 patterns
This confirms the pitchfork's predictive power across three consecutive cycles
Projected Bottom Level
Based on the current pitchfork geometry, the lower band projects to approximately $36,500–$49,000 range
This gives a clear risk/reward for the next major move
Important Note : While the pitchfork structure suggests a cycle bottom near $46,000 in late 2026, I still expect a relief rally for Bitcoin before we reach that level.

Bitcoin Cycle Forecast 2024–2028 Based on the Previous CyclesHi all. In my small research study, I've identified certain patterns from the previous three BTC cycles. Based on these patterns, I've created a forecast for BTC peaks and bottoms for the current cycle. I tried to build my model only on elements that have already appeared in previous cycles.
1) Summary.
Each new cycle begins with a confident breakout and subsequent consolidation above the high of the previous cycle. Each cycle lasts approximately 1250-1400 days. Each cycle consists of two peaks, two lows, and then transitions into the next cycle.
Using a Fibonacci grid, the cycle end is 1 and the beginning is 0 . Previous cycle peaks have always ranged between 0.69 and 1 . When price drops below 0 on the fibo at the lowest points, we mark these with a negative sign .
The table shows the values of key points for each cycle: 2 lows, 2 highs, the cycle start (0) and end (1) . The table also calculates price movement in Fibonacci points how much the chart moved between adjacent key points. I then calculated the Total downward movement (2 moves) and Total upward movement (3 moves) for each cycle.
2) Forecasting the base scenario for bottom and peak points in the new cycle.
The previous 3 cycles always started with a strong first peak ( 1, 1, or 0.91 ). This cycle has played out differently. We're seeing price fall after a modest rise. This is the main difference between the current cycle and previous ones. This is what people point to when they claim that cycles supposedly no longer work.
However, there are two key facts:
a) In the 2021-2024 cycle: 0.91 was the first peak, 1 was the second. So the first peak can be lower than the second.
b) The smallest peak across all studied cycles occurred in the 2017-2021 cycle at 0.69 , followed by the smallest move to a low - 0.55 fibo points. This is highlighted in the table.
Since we only know the beginning (0) of the new cycle, for the base scenario Base 1 , I'm using the second peak and the price movement to the second low from the 2017-2021 cycle. I'm applying this data to our new cycle as the first peak and first low to build the forecast.
With this setup, the second peak (1 on fibo) comes out at around 151k USD. It's disappointing that it's so low. I'd be happy to be proven wrong.
For the second low of the current cycle, I'm trying 0.1 , taken from the same 2017-2021 cycle, specifically from its first bottom low. This Base 1 variant is essentially a copy of the 2017-2021 cycle, just with peak1-low1 and peak2-low2 swapped.
Since we already touched 0.14 on fibo (November 17, $80,200) after the supposed first peak, there's reason to believe the first low has already occurred.
If we use a more "optimistic" number for bottom low2, say 0.2 , we'd exceed the average movement of our cycles. So in this scenario, 0.1 is already the upper boundary (with the first low at 0.14 ).
Total downward movement and Total upward movement .
There's a strong similarity between the 2013-2017 and 2021-2024 cycles in this metric. Meanwhile, the 2017-2021 cycle differs from the other two. For all forecasts of the 2024-2028 cycle, we'll stay within the price movement values of previous cycles—between 1.45 and 1.76 for total downward movement.
3) Addition to the base scenario
What if the 1st low turns out lower than expected?
If we're using the average movement of the 2017-2021 cycle, this situation still fits within the model.
Low 1 ∈
Low 2 ∈
Low 2 = 0.24 - Low1
Base 2/3/4 outline scenarios that still align with the 2017-2021 cycle model.
Base 1 2 3 4 - price movement parameters match 2017-2021
Base 5-6 - intermediate version between 2017-2021 and 2013-2017/2021-2024
Base 7 - price movement parameters match 2013-2017 and 2021-2024
Since we only have 3 cycles to study, we can't know for certain what the current cycle's price movement will be or accurately forecast both low positions right away. Since the similarity with the 2017-2021 cycle seems more significant, I'm using that cycle's price movement as the base scenario.
4) Alternative scenarios
Could the second peak be higher than 150k?
This variant is presented as ALT 8, 9, 10 with a second peak at 180k. But in this scenario, the first peak would be at 0.5 on fibo, which is a significant departure from the previous 3 cycles (since the minimum peak was 0.69 ).
ALT 8 - price movement parameters match 2017-2021
ALT 9 - middle ground between them
ALT 10 - price movement parameters closer to 2013-2017 and 2021-2024
Thanks for reading. I welcome your comments. I did this for myself originally but decided to share it with everyone. I'd appreciate if you point out any issues you find or share thoughts that could help develop the model further.

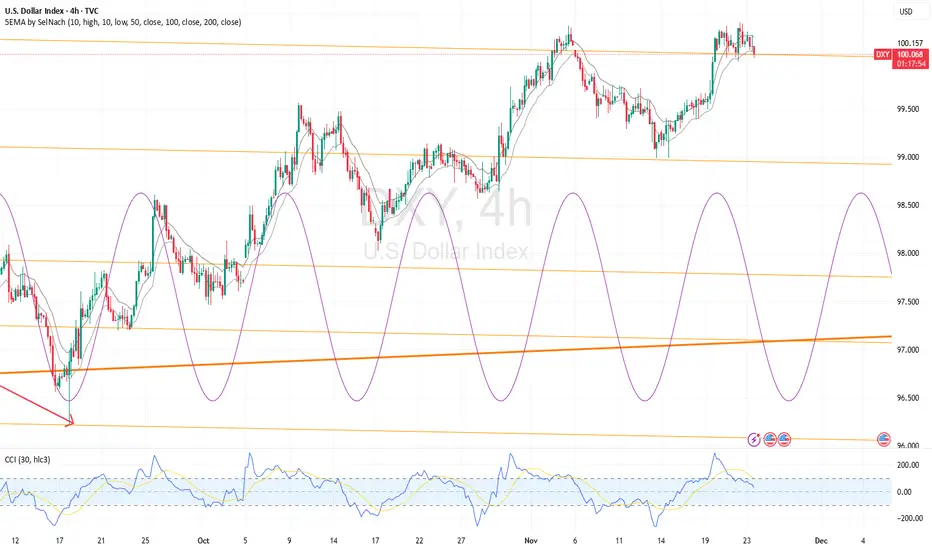
FractalCycles at Work: Analysis of the U.S. Dollar Index (DXY)This chart highlights the dominant 62-period cycle currently steering short-term swings in the U.S. Dollar Index. Price has been respecting the rhythm of this cycle, with recent highs and lows forming close to the projected turning points.
At the moment, DXY is trading near a potential cycle peak, and with the next downward phase approaching, the probability of a short-term pullback increases. Momentum indicators are also softening, offering further confirmation of cycle pressure beginning to turn.
Takeaway:
The 62-period cycle continues to provide reliable structure for timing DXY’s shorter-term movements. If the pattern persists, traders should be prepared for a potential downswing as the next cycle trough unfolds.
$Gold Technical Analysis October 2025 📊 #GOLDUSD Update
🔑 Key Zones
PRZ: $4,371 (Gold stopped nicely at $4,381!)
Local Support Zone: $4,180–$4,050
Holding this range can send Gold soaring again toward:
➡️ $4,500 → $4,750 → $5,200
If these supports are lost, → next downside zones are:
➡️ $3,950 → $3,850 → $3,750
📅 Timeframe & View
Short-term:
Gold trading between $4,180–$4,050 — key range before the next big leg.
Long-term:
ATH projection levels:
💎 $5,300 → $5,700 → $7,300 → $7,700
These correspond with critical years for the global cycle:
2025 (Oct–Nov) performance
2027
2031
2033
Every pullback in this decade-long uptrend remains a buy opportunity.
⚖️ Gold or BTC?
For the short term, my focus shifts to BTC.
But once that phase completes, I’ll move back to Gold for the long wave.
💰 Long-Term Holders
For those holding gold long-term (1 year+):
Any pullback below $3750 remains a strong buy zone for adding.
✅ Quick Recap
📍 PRZ hit: $4,371–$4,381
🛡 Support: $4,180–$4,050
🚀 Upside Targets: $4,500–$4,750–$5,200
⚠️ Downside Risk: $3,950–$3,850–$3,750
🧭 Cycle Years: 2025, 2027, 2031, 2033
💰 Focus: Short-term BTC → Long-term Gold
🧭 Personal Trading Note
I only trade Gold in the real market, and use the demo setup here purely for tracking and study.
⚓ Renzo Tip
“When the tide turns, the wise trader doesn’t fight it — he rides one wave, then waits for the next.”
🤲 Prayer
May Allah bless us with patience in the long waves, wisdom in every entry,
and reward us with clarity in both gold and time.

Market Psychology: Gold vs Bitcoin - Where We Really Are🧠 The Psychology Test That Changes Everything
Here's a simple test that will tell you everything about where TVC:GOLD and IG:BITCOIN is in its cycle:
Look at these two charts. Which one screams "bull market euphoria"?
────────────────────────────────────
Chart One
🥇 TVC:GOLD : A Textbook Bull Market
Current Price: $4,000.92
Peak Price: $4,390 (Recently hit)
RSI: 69.15
Phase: EUPHORIA → COMPLACENCY (Post-peak pullback)
What the Psychology Chart Shows:
Looking at FOREXCOM:XAUUSD price action overlaid with the Wall Street Cheat Sheet:
✅ Clean parabolic structure - No ambiguity
✅ Multiple phases completed - Hope → Optimism → Belief → Thrill → Euphoria
✅ Peak already hit at $4,390 - The pink Euphoria circle was touched
✅ Now pulling back from peak - Classic post-euphoria behavior
✅ RSI cooling from overbought - Down from 85+ to 69.15
✅ Volume still elevated as reality sets in
This is what a COMPLETED bull market looks like.
When you see this chart, you don't second-guess. You don't wonder "is this a bull market?"
You KNOW it is.
────────────────────────────────────
Chart Two
₿ IG:BITCOIN : Still in Early Stages
Current Price: $101,802.2
RSI: 44.61
Phase: OPTIMISM (not even Belief yet)
What the Psychology Chart Shows:
Looking at INDEX:BTCUSD price action overlaid with the Wall Street Cheat Sheet:
⚠️ "We are here" marker - Sitting in the OPTIMISM phase
⚠️ Haven't reached Belief yet - The green zone is still ahead
⚠️ Thrill phase - Blue circle far above current price
⚠️ Euphoria phase - Pink circle even further away
⚠️ RSI at 44.61 - Not even close to overbought
⚠️ Fourth Halving marker - April 22, 2024 clearly noted
This is what mid-cycle consolidation looks like.
────────────────────────────────────
🔍 The Critical Difference
Let me use an analogy: Think of market cycles like a marathon.
FOREXCOM:GOLD (Chart 1):
Mile 26 - Just crossed finish line - Race is over, starting to cool down
Runners are slowing down after sprint (Post-euphoria)
Crowd peaked, now dispersing (Volume still high but declining)
Everyone saw the finish (Peak at $4,390)
Now wondering if they should have sprinted harder
CRYPTOCAP:BTC (Chart 2):
Mile 8 of 26 - Still early in the race
Runners are fresh and steady (Optimism)
Crowd is watching but not cheering wildly yet
Most people aren't even at the venue yet
Many spectators think the race might be cancelled
────────────────────────────────────
📊 Side-by-Side Psychology Comparison
────────────────────────────────────
🎯 What This Tells Us About IG:BITCOIN
If COINBASE:BTCUSD were truly at a cycle top, it would look like CAPITALCOM:GOLD :
❌ Parabolic vertical moves
❌ RSI pinned above 75 for weeks
❌ Volume exploding
❌ Everyone saying "Bitcoin to $500K"
❌ Taxi drivers asking about crypto
❌ Magazine covers everywhere
❌ No doubt whatsoever about the trend
But OANDA:BTCUSD looks nothing like that:
✅ Choppy consolidation
✅ RSI in neutral zone (44.61)
✅ Volume moderate
✅ Everyone asking "Is the bull market over?"
✅ Retail despair and fear
✅ Zero mainstream coverage
✅ Maximum doubt about the trend
────────────────────────────────────
💡 The Psychology Principle
Here's the key insight from behavioral finance:
**"If you have to ask whether you're in a bubble, you're not in a bubble."**
TVC:GOLD : No one is asking if TVC:GOLD is in a bull market. It's obvious.
IG:BITCOIN : Everyone is asking if IG:BITCOIN is in a bull market. That's your answer.
────────────────────────────────────
🧩 Where Each Asset Really Is
TVC:GOLD - Post-Peak Bear Market Transition:
Completed Phases:
✅ Hope (Oct '23 - May '24)
✅ Optimism (May '24 - Dec '24)
✅ Belief (Dec '24 - May '25)
✅ Thrill (May '25 - Sep '25)
✅ EUPHORIA - PEAKED at $4,390 (Oct '2025)
Current Phase:
🔶 COMPLACENCY - "It'll come back to $4,390"
Price: $4,000.92 (down ~9% from peak)
Classic post-euphoria denial behavior
What's Next:
Anxiety → Denial → Panic → Capitulation (2026+)
Time Remaining: Bull market is OVER - bear phase beginning
────────────────────────────────────
KRAKEN:BTCUSD - Early-Mid Bull Market:
Completed Phases:
✅ Hope (2023 - Post-FTX recovery)
🟡 OPTIMISM (Current - 2024-2025)
Phases Still Ahead:
⬜ Belief
⬜ Thrill
⬜ Euphoria
What's Next:
Break into Belief phase → Thrill → Euphoria
Time Remaining: Given CRYPTOCAP:BTC high volatile nature - 2-6 months of upside potential
────────────────────────────────────
🎨 The Visual Test (Do This Right Now)
Step 1: Look at the TVC:GOLD chart
Does it look like a bull market? YES
Could you be wrong? NO
Is there any doubt? ZERO
Step 2: Look at the IG:BITCOIN chart
Does it look like a bull market? MAYBE?
Could you be wrong? POSSIBLY
Is there any doubt? TONS
Step 3: Ask yourself
**"Would a cycle TOP have this much doubt and fear?"**
The answer is NO.
────────────────────────────────────
📈 What the RSI Divergence Tells Us
TVC:GOLD RSI Pattern:
Peaked above 85 during euphoria
Currently cooling at 69.15
Rolling over from overbought
Classic post-peak behavior
This is bear market transition
IG:BITCOIN RSI Pattern:
Sitting at 44.61
Plenty of room to run
Not even approaching overbought
Recent "Bear" signals flushing out
This is early-cycle behavior
Think of it like a gas tank:
TVC:GOLD : Hit redline at $4,390, now coasting down on fumes
IG:BITCOIN : 45% full, tons of room to run
────────────────────────────────────
🔥 The Contrarian Insight
What the majority thinks:
" TVC:GOLD is in a bubble, IG:BITCOIN topped"
What the charts actually show:
TVC:GOLD is in a mature bull market (near end)
IG:BITCOIN is in early-mid bull market (tons of runway)
The irony:
Everyone trusts TVC:GOLD rally (late stage)
Everyone doubts IG:BITCOIN rally (early stage)
This is exactly backwards.
────────────────────────────────────
🎭 The Emotional State Comparison
TVC:GOLD Holders Right Now:
😰 Starting to feel anxious (down from $4,390)
🤔 "It'll bounce back, right?"
📉 Checking price hoping for recovery
🙃 "I should have sold at $4,390"
😬 "This is just a healthy correction"
This is COMPLACENCY - the denial phase after euphoria.
IG:BITCOIN Holders Right Now:
😰 Anxious and doubtful
🤐 Not talking about their positions
😔 Wondering if they should sell
📉 Feeling defeated
💀 "Maybe the cycle is over"
Which emotional state typically marks:
Post-cycle tops? → TVC:GOLD current state (Complacency/Denial after Euphoria peak)
Cycle middles? → IG:BITCOIN current state (Doubt during Optimism)
────────────────────────────────────
💎 The Bottom Line
Using the Wall Street Cheat Sheet as our guide:
TVC:GOLD :
Phase: Thrill → Euphoria
Completion: ~95% through cycle
Risk/Reward: High risk, limited reward
Action: Take profits soon
IG:BITCOIN :
Phase: Optimism (just finished Hope)
Completion: ~30% through cycle
Risk/Reward: Moderate risk, massive reward
Action: Accumulate aggressively
────────────────────────────────────
🧠 The Psychology Lesson
The market is designed to make you feel wrong at exactly the wrong time:
When TVC:GOLD peaked at $4,390 (Euphoria) → You felt confident, " TVC:GOLD to $5K!"
Now TVC:GOLD is pulling back (Complacency) → You feel like "it's just a correction"
When IG:BITCOIN is cheap and poised (Optimism) → You feel scared to buy
This is why most people:
Miss selling tops (felt too good at $4,390)
Hold through corrections (denial and complacency)
Sell bottoms during fear (Optimism feels scary)
To win, you must:
Trust the structure over the sentiment
Buy when it feels uncomfortable (Optimism/Belief)
Sell when it feels amazing (Euphoria/Peak)
────────────────────────────────────
📍 Where We Actually Are
HOPE → OPTIMISM( IG:BITCOIN ) → BELIEF → THRILL → EUPHORIA ( TVC:GOLD $4390 Peak) → COMPLACENCY → ( TVC:GOLD Current)
IG:BITCOIN is 3-4 phases behind TVC:GOLD .
TVC:GOLD already peaked. IG:BITCOIN hasn't even started its parabolic phase yet.
────────────────────────────────────
🎯 What This Means for Your Portfolio
If you're holding TVC:GOLD at $4,000:
You missed the peak at $4,390
You're in post-euphoria complacency
"It'll bounce back" is denial
Risk/reward is terrible now
Exit strategy needed YESTERDAY
If you're doubting IG:BITCOIN at $102K:
You're sitting in Optimism
You're early to the party
Peak is 3-4 phases away
Risk/reward is excellent
Accumulation strategy needed NOW
────────────────────────────────────
🔚 Final Thought
The next time someone tells you " IG:BITCOIN topped," show them these two charts side by side.
Ask them: "Which one actually topped?"
The answer is clear: TVC:GOLD peaked at $4,390 and is now in complacency denial. IG:BITCOIN is still in optimism.
TVC:GOLD finished its race.
IG:BITCOIN is just finishing Act 1.
The Golden Bull Run isn't over—it's barely begun.
────────────────────────────────────
This is educational content comparing market psychology across asset classes. Not financial advice. Always do your own research and manage risk appropriately.
────────────────────────────────────

I would call this a Change of Character (CHoCH) for BTCI want to share with you that the 2 Day On Balance Volume (OBV) is now below its EMA(100).
The last time this happened was at ATH in November 2021.
Also the 2D OVB EMA(100) was spot on at the ATL in January 2023.
BTC has reached it's 6.618 Fibonacci of Wave 1 resulting in 698%.
Don't you think a correction would be in order?
And yet people are still talking about a coming bull run ;)))
I don't say this is the final top, even though it looks like it… one more high after a short correction could still be possible.
I'm just saying this is something to keep in mind » Already 7x, bullish OBV is finished AND … according to a simple sine wave (yellow) we are now in a down phase until around February - March 2026.
Let's see what happens.

Low High High pivot called 2017 TopFib time of Low High High pivot called the 2017 top to the EXACT DAY. I have similar fib time that predicted our local BTC top to the exact day. Keep in mind that the pivots are based off of the respective current cycles starting from the low that was put in at the previous bear cycle. These fib times were not taking from just the higher time frames such as monthly or weekly but from the EXACT day the pivot was put in. I’ll share the current fib time in my next post.

SPX - The Road to 6900 Begins “History never repeats itself. Man always does.”
A deep look into SPX History exposes the path of a market cycle and tells us the truth on where markets are headed.
Percentages don't lie.
See you guys at 6900!

ETH Daily Technical Overview — Cycle & Box AnalysisCycle Structure:
HWC (Higher Wave Cycle – Long-Term): Bullish 🔼
MWC (Middle Wave Cycle – Mid-Term): Range 🔁
LWC (Lower Wave Cycle – Short-Term): Bearish 🔽
Market Context:
The first step is to assess the market from a cycle and wave perspective 🧐. Recent sharp down moves are ignored as they are emotional reactions.
The current support is a box 📦 that has been tested for around 35 days with four significant touches. My bias is long here 🚀.
Long Setup:
Weakness in the short-term MWC 🔁 could trigger a bullish move if 4232 resistance is broken and confirmed ✅.
The next resistance at 4757 🚧 could turn all cycles bullish 🔼🔼🔼 if broken, offering strong upside potential 📈.
Short Consideration:
The market is unpredictable ⚠️, so short scenarios should be considered too.
Until price reaches 3708 ⬇️, I won’t consider shorts ❌.
Shorts require more structure and confirmation.
Remember, downside moves are still possible ⚡, so risk management is key 🛡️.
📌 Signature:
If you want a specific coin analyzed, drop a comment 💬👇 and I’ll cover it.
⚠️ Without proper risk management, you're just a ticking time bomb 💣

EUR/USD: Cycle Analysis You Can’t IgnoreThis chart reveals a dominant 220-bar cycle in the EUR/USD pair ..a repeating rhythm that has shaped market structure for decades. Out of the last 13 major cycle signals, 10 have delivered strong trade results, each aligning closely with turning points in the broader trend.
Every major turning point has followed this same cyclical rhythm, proving that even through major global shifts, the market still moves in repeating, fractal patterns.
Cycle and fractal analysis continue to provide some of the most objective timing tools in modern trading. While many still dismiss cycles as “theoretical,” the data says otherwise.
Question for You:
Are you still dismissing cycle analysis, or are you ready to use it to stay ahead of the next major move? Watch the current cycle high!

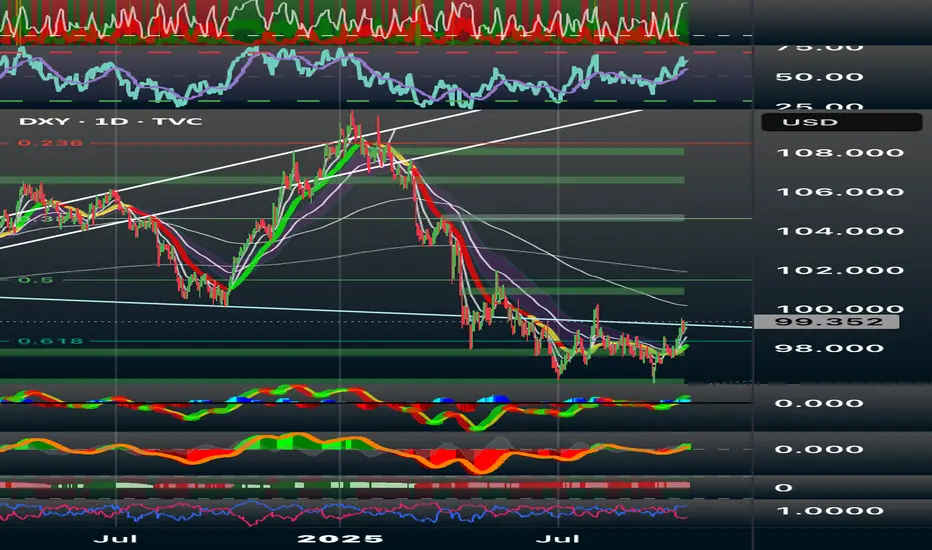
DXY: Key Reversal or Dead Cat Bounce?The U.S. Dollar Index has found footing around the 0.618 Fibonacci retracement near 97.8, breaking a long downtrend. Its push toward the 99.35–100 range suggests a possible retest of a broken structure and alignment with the 50-day EMA. I noticed this move also aligns with short-term recovery signals.
Technical View (1D)
RSI climbing above 50 hints at renewed momentum.
MACD turning green shows early signs of follow-through.
Price is testing 100–101, a former support turned resistance.
If momentum holds, 102, 104, and 106 are the next resistance zones.
Support remains steady at 98, 97, and 95.8, which are shown as strong confluence points with Fibonacci structure.
Scenarios:
If DXY closes above 100.3, I’d expect continuation toward 102.4 or 104.2.
Failure to clear 100 followed by a drop under 98.5 could send it back toward 97.2 or even 95.8.
For now, my bias stays neutral to slightly bullish in the short term. A clean breakout above 100 would confirm a structural shift upward. None the less, I’m watching U.S. yields and upcoming CPI data closely and considering the factor that stronger inflation or a hawkish Fed tone could fuel the next DXY leg higher.
Thank you for your time and support, and as always please remember that this is always NFA and DYOFR, respectfully.
Gold's cycle analysis. 3/Oct/25XAUUSD both medium term cycle number 14 (bold balck ) AND short term cycle number 12 ( Red Bold) are due anytime on October. Probably after hitting 4000 psychological level.
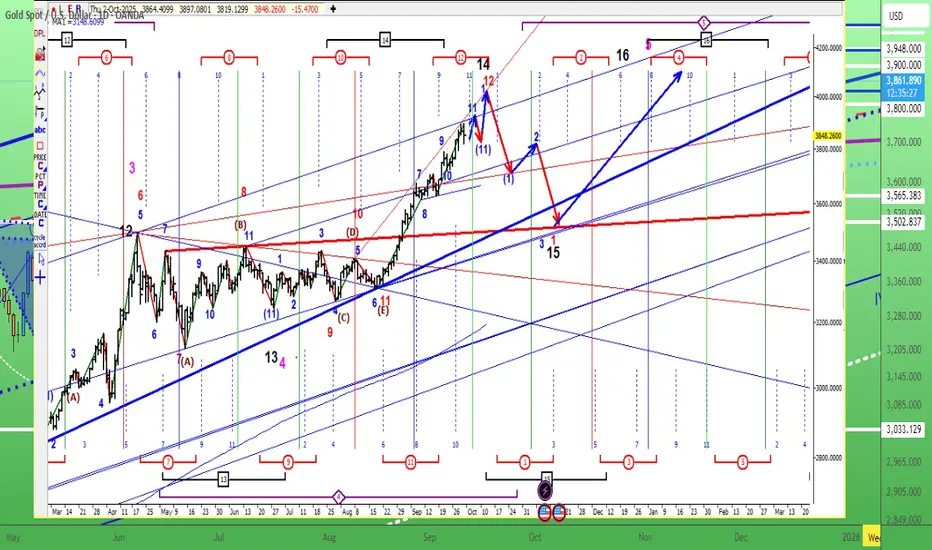
Gold cycle analysis. 30/Sept/2025 Gold parabolic rocket launching was much difficulty to catch then falling knife. Gold medium cycle Number 15 probably Only will be due by last week of Oct 2025. at around 3500 a fibo 0.618 plus multi trendline confluence zone which "matched" tradingview Mod idea as well. A daily pin bar could be formed again on today closed daily bar.

Gold's cycle analysis. 28/Sept/25 XAUUSD's medium cycle is trending down toward medium cycle number 15 ( bold black ) which is due at around mid of Oct 2025.. "Buying deep" price would be around 3468 - 3478...
