Is Morgan Stanley right about NZD?With the RBNZ set to deliver its Monetary Policy Statement this week, Morgan Stanley sees the New Zealand dollar recovering as growth stabilises. Technically, NZD/USD is sitting right on the edge of its potential correction zone, holding above the recent 0.5485 low. A bounce into 0.5650–0.5700 is on the table if buyers protect this level. A clean break under 0.5485 could reopen downside risk.
AUD/NZD remains firmly in an uptrend. Price is consolidating above the 1.14 breakout, and the Fib circle projections from the chart point toward an extension into the 1.1650–1.1700 region if momentum builds. Morgan Stanely expects the Australian dollar to keep outperforming. Stronger Australian data and higher migration flows continue to widen the gap between the two economies, favouring further gains in AUD/NZD.
D-AUD

Could this week’s RBNZ cut mark the peak in AUD/NZD? Is it too early to call the Aussie dollar peaking against the New Zealand dollar? Several analysts suggesting the AUD/NZD rally is losing momentum ahead of this week’s Reserve Bank of New Zealand decision.
Markets expect the RBNZ to deliver a 25-basis-point cut, taking the Official Cash Rate to 2.25%.
Strategists at Bank of New Zealand and National Australia Bank say the currency pair, which recently traded near decade-high levels, may start to retreat toward 1.14 if the RBNZ indicates it is close to ending its easing cycle.
Technical signals could be reinforcing the idea that AUD/NZD may be nearing a turning point. A bearish candlestick resembling a shooting star formed on 13 November, a pattern often associated with reversals after extended uptrends.
Still, not all factors favour the kiwi. Australia maintains a sizable rate advantage over New Zealand

Could we see a bearish reversal from here?Aussie (AUD/USD) is falling towards the pivot and could bounce to the 1st resistance.
Pivot: 0.6384
1st Support: 0.6275
1st Resistance: 0.6540
Disclaimer:
The opinions given above constitute general market commentary and do not constitute the opinion or advice of IC Markets or any form of personal or investment advice.
Any opinions, news, research, analyses, prices, other information, or links to third-party sites contained on this website are provided on an "as-is" basis, are intended to be informative only, and are not advice, a recommendation, research, a record of our trading prices, an offer of, or solicitation for, a transaction in any financial instrument and thus should not be treated as such. The information provided does not involve any specific investment objectives, financial situation, or needs of any specific person who may receive it. Please be aware that past performance is not a reliable indicator of future performance and/or results. Past performance or forward-looking scenarios based upon the reasonable beliefs of the third-party provider are not a guarantee of future performance. Actual results may differ materially from those anticipated in forward-looking or past performance statements. IC Markets makes no representation or warranty and assumes no liability as to the accuracy or completeness of the information provided, nor any loss arising from any investment based on a recommendation, forecast, or any information supplied by any third party.

AUDUSD H4 | Bearish Reversal Off Key ResistanceMomentum: Bearish
Price has rejected the sell entry zone, which aligns with the 38.2% Fibonacci retracement, and is also trading below the Ichimoku cloud, reinforcing bearish pressure.
Sell Entry: 0.6513
Strong overlap resistance
38.2% Fibonacci retracement
Stop Loss: 0.6539
Pullback resistance
61.8% Fibonacci retracement
Take Profit: 0.6447
Multi swing-low support
61.8% Fibonacci projection
High Risk Investment Warning
Stratos Markets Limited (tradu.com ), Stratos Europe Ltd (tradu.com ):
CFDs are complex instruments and come with a high risk of losing money rapidly due to leverage. 70% of retail investor accounts lose money when trading CFDs with this provider. You should consider whether you understand how CFDs work and whether you can afford to take the high risk of losing your money.
Stratos Global LLC (tradu.com ): Losses can exceed deposits.
Please be advised that the information presented on TradingView is provided to Tradu (‘Company’, ‘we’) by a third-party provider (‘TFA Global Pte Ltd’). Please be reminded that you are solely responsible for the trading decisions on your account. Any information and/or content is intended entirely for research, educational and informational purposes only and does not constitute investment or consultation advice or investment strategy. The information is not tailored to the investment needs of any specific person and therefore does not involve a consideration of any of the investment objectives, financial situation or needs of any viewer that may receive it. Past performance is not a reliable indicator of future results. Actual results may differ materially from those anticipated in forward-looking or past performance statements. We assume no liability as to the accuracy or completeness of any of the information and/or content provided herein and the Company cannot be held responsible for any omission, mistake nor for any loss or damage including without limitation to any loss of profit which may arise from reliance on any information supplied by TFA Global Pte Ltd.

AUSSIE H4 | Heading Into 61.8% Fibonacci ResistanceMomentum: Bearish
The price is rising towards the sell entry which aligns with the 61.8% Fibonacci retracement and al;so trading below the ichimoku cloud.
Sell entry: 0.6451
Pullback resistance
61.8% FIbonacci retracement
Stop loss: 0.6516
Overlap resistance
Slighlty above the 50% Fibonacci retracement
Take profit: 0.6389
Swing low support
161.8% FIbonacci extension
High Risk Investment Warning
Stratos Markets Limited (tradu.com ), Stratos Europe Ltd (tradu.com ):
CFDs are complex instruments and come with a high risk of losing money rapidly due to leverage. 70% of retail investor accounts lose money when trading CFDs with this provider. You should consider whether you understand how CFDs work and whether you can afford to take the high risk of losing your money.
Stratos Global LLC (tradu.com ): Losses can exceed deposits.
Please be advised that the information presented on TradingView is provided to Tradu (‘Company’, ‘we’) by a third-party provider (‘TFA Global Pte Ltd’). Please be reminded that you are solely responsible for the trading decisions on your account. Any information and/or content is intended entirely for research, educational and informational purposes only and does not constitute investment or consultation advice or investment strategy. The information is not tailored to the investment needs of any specific person and therefore does not involve a consideration of any of the investment objectives, financial situation or needs of any viewer that may receive it. Past performance is not a reliable indicator of future results. Actual results may differ materially from those anticipated in forward-looking or past performance statements. We assume no liability as to the accuracy or completeness of any of the information and/or content provided herein and the Company cannot be held responsible for any omission, mistake nor for any loss or damage including without limitation to any loss of profit which may arise from reliance on any information supplied by TFA Global Pte Ltd.

AUD/JPY: Exhaustion at The High?AUD/JPY briefly traded at a 16-month high on Thursday before reversing lower. At current levels it’s on track to form a spinning-top doji on the weekly chart, and it has already printed a shooting-star candle on the daily at the November high and monthly S1 pivot.
Given the multi-week bearish RSI divergence and false breakout at the highs, the bias is for some mean reversion towards at least the 20-day EMA. The 100 handle and 50-day EMA near the January high also make viable downside targets for bears, should the yen enjoy a bout of risk-on strength.
Matt Simpson, Market Analyst at City Index.

Bullish bounce off 50% Fibonacci support?AUD/JPY has bounced off the pivot, which is an overlap support that aligns with the 50% Fibonacci retracement and could potentially rise to the 1st resistance.
Pivot: 101.30
1st Support: 100.85
1st Resistance: 102.22
Disclaimer:
The opinions given above constitute general market commentary and do not constitute the opinion or advice of IC Markets or any form of personal or investment advice.
Any opinions, news, research, analyses, prices, other information, or links to third-party sites contained on this website are provided on an "as-is" basis, are intended to be informative only, and are not advice, a recommendation, research, a record of our trading prices, an offer of, or solicitation for, a transaction in any financial instrument and thus should not be treated as such. The information provided does not involve any specific investment objectives, financial situation, or needs of any specific person who may receive it. Please be aware that past performance is not a reliable indicator of future performance and/or results. Past performance or forward-looking scenarios based upon the reasonable beliefs of the third-party provider are not a guarantee of future performance. Actual results may differ materially from those anticipated in forward-looking or past performance statements. IC Markets makes no representation or warranty and assumes no liability as to the accuracy or completeness of the information provided, nor any loss arising from any investment based on a recommendation, forecast, or any information supplied by any third party.

Bearish drop off?AUD/CHF is rising towards the pivot, which acts as an overlap resistance and could drop to the 1st support.
Pivot: 0.52231
1st Support: 0.51502
1st Resistance: 0.52684
Disclaimer:
The opinions given above constitute general market commentary and do not constitute the opinion or advice of IC Markets or any form of personal or investment advice.
Any opinions, news, research, analyses, prices, other information, or links to third-party sites contained on this website are provided on an "as-is" basis, are intended to be informative only, and are not advice, a recommendation, research, a record of our trading prices, an offer of, or solicitation for, a transaction in any financial instrument and thus should not be treated as such. The information provided does not involve any specific investment objectives, financial situation, or needs of any specific person who may receive it. Please be aware that past performance is not a reliable indicator of future performance and/or results. Past performance or forward-looking scenarios based upon the reasonable beliefs of the third-party provider are not a guarantee of future performance. Actual results may differ materially from those anticipated in forward-looking or past performance statements. IC Markets makes no representation or warranty and assumes no liability as to the accuracy or completeness of the information provided, nor any loss arising from any investment based on a recommendation, forecast, or any information supplied by any third party.

Bullish bounce off key support?AUD/NZD has bounced off the pivot and could potentially rise to the 1st resistance.
Pivot: 1.15287
1st Support: 1.15006
1st Resistance: 1.15909
Disclaimer:
The opinions given above constitute general market commentary and do not constitute the opinion or advice of IC Markets or any form of personal or investment advice.
Any opinions, news, research, analyses, prices, other information, or links to third-party sites contained on this website are provided on an "as-is" basis, are intended to be informative only, and are not advice, a recommendation, research, a record of our trading prices, an offer of, or solicitation for, a transaction in any financial instrument and thus should not be treated as such. The information provided does not involve any specific investment objectives, financial situation, or needs of any specific person who may receive it. Please be aware that past performance is not a reliable indicator of future performance and/or results. Past performance or forward-looking scenarios based upon the reasonable beliefs of the third-party provider are not a guarantee of future performance. Actual results may differ materially from those anticipated in forward-looking or past performance statements. IC Markets makes no representation or warranty and assumes no liability as to the accuracy or completeness of the information provided, nor any loss arising from any investment based on a recommendation, forecast, or any information supplied by any third party.

AUDUSD: Complexity is in it's peak!Dear Traders, The Aussie is not easy to trade these days! However, I've been asked for an analysis. I suggested to risk less than an ordinary trade!
This is the daily chart
We might have seen newly form bearish channel! However, it might be just a correction!
We'll see
While we are ready for long in this setup!
A shorting from here with stop-loss over the bearish trendline is also considerable.

Bullish reversal for the Aussie?The price has bounced off the pivot, which is a pullback support, and could rise to the 1st resistance, which has been identified as an overlap resistance.
Pivot: 0.6468
1st Support: 0.6444
1st Resistance: 0.6512
Disclaimer:
The opinions given above constitute general market commentary and do not constitute the opinion or advice of IC Markets or any form of personal or investment advice.
Any opinions, news, research, analyses, prices, other information, or links to third-party sites contained on this website are provided on an "as-is" basis, are intended to be informative only, and are not advice, a recommendation, research, a record of our trading prices, an offer of, or solicitation for, a transaction in any financial instrument and thus should not be treated as such. The information provided does not involve any specific investment objectives, financial situation, or needs of any specific person who may receive it. Please be aware that past performance is not a reliable indicator of future performance and/or results. Past performance or forward-looking scenarios based upon the reasonable beliefs of the third-party provider are not a guarantee of future performance. Actual results may differ materially from those anticipated in forward-looking or past performance statements. IC Markets makes no representation or warranty and assumes no liability as to the accuracy or completeness of the information provided, nor any loss arising from any investment based on a recommendation, forecast, or any information supplied by any third party.

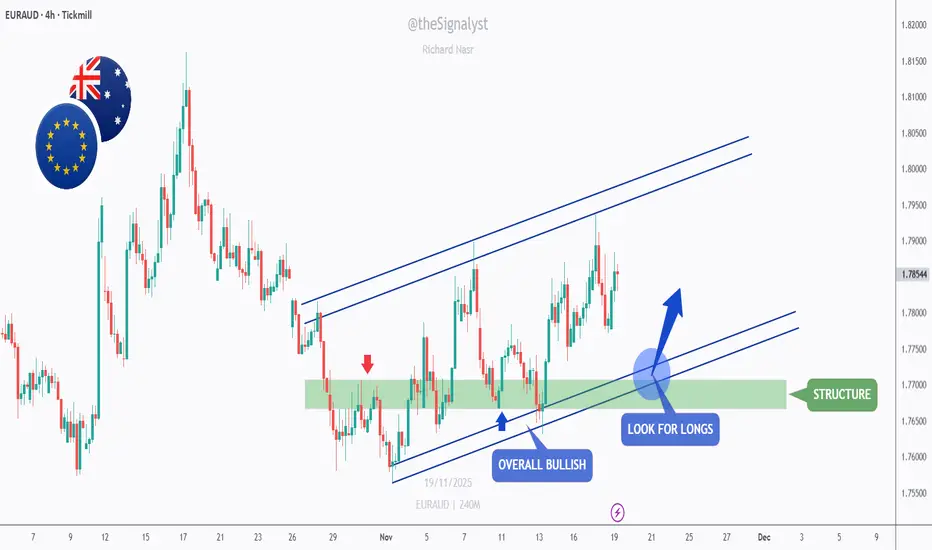
EURAUD - Bulls Still in Control… Waiting for the Next Retest!📈EURAUD continues to hold a clean bullish structure , trading inside an ascending channel while respecting the major support zone around 1.7650–1.7700.
⚔️This green zone has acted as a strong rejection area multiple times , showing clear buying pressure each time price dips into it.
As long as EURAUD remains above this structure, the bullish bias stays intact. I will be looking for longs on the next retest of the channel’s lower boundary, which aligns perfectly with the green demand zone - a powerful confluence area for trend-following entries.
🏹If the bulls manage to defend this zone once again, the next wave upward toward the upper boundary of the channel becomes the most likely scenario. But if price breaks below the structure, the bullish outlook would weaken.
We’re now waiting for the market to make the next move… will the bulls step in again at support? 🤔
⚠️ Disclaimer: This is not financial advice. Always do your own research and manage risk properly.
📚 Stick to your trading plan regarding entries, risk, and management.
Good luck! 🍀
All Strategies Are Good; If Managed Properly!
~Richard Nasr.
GBPAUD: volume Profile and Static levelsHello everyone!
This is the daily chart!
As you can see, there 2 channels here. One bearish and the other one is bullish. In coincide of two supports of them we see a strong previous S&R!
V.P of October is out strong resistance! We see a great momentum after it. There is middle of the bearish channel around too.
If we see a weak upward move, we can enter a short trade around the volume profile POC.
The TP is just over the static support and around the dynamic support.
You can also buy from support if we see a weakness in bears.

Bullish bounce off?EUR/AUD has bounced off the pivot which is a pullback support and could rise to the 1st resistance.
Pivot: 1.77607
1st Support: 1.76733
1st Resistance: 1.79621
Disclaimer:
The opinions given above constitute general market commentary and do not constitute the opinion or advice of IC Markets or any form of personal or investment advice.
Any opinions, news, research, analyses, prices, other information, or links to third-party sites contained on this website are provided on an "as-is" basis, are intended to be informative only, and are not advice, a recommendation, research, a record of our trading prices, an offer of, or solicitation for, a transaction in any financial instrument and thus should not be treated as such. The information provided does not involve any specific investment objectives, financial situation, or needs of any specific person who may receive it. Please be aware that past performance is not a reliable indicator of future performance and/or results. Past performance or forward-looking scenarios based upon the reasonable beliefs of the third-party provider are not a guarantee of future performance. Actual results may differ materially from those anticipated in forward-looking or past performance statements. IC Markets makes no representation or warranty and assumes no liability as to the accuracy or completeness of the information provided, nor any loss arising from any investment based on a recommendation, forecast, or any information supplied by any third party.

GBPAUD has formed a double top.GBPAUD - 24h expiry
Posted a Double Top formation.
We look for a temporary move higher.
The bearish engulfing candle on the 4 hour chart is negative for sentiment.
The overnight rally has been sold into and there is scope for further bearish pressure going into this morning.
Risk/Reward would be poor to call a sell from current levels.
We look to Sell at 2.0305 (stop at 2.0381)
Our profit targets will be 2.0085 and 2.0045
Resistance: 2.0260 / 2.0343 / 2.0400
Support: 2.0150 / 2.0100 / 2.0030
Risk Disclaimer
The trade ideas beyond this page are for informational purposes only and do not constitute investment advice or a solicitation to trade. This information is provided by Signal Centre, a third-party unaffiliated with OANDA, and is intended for general circulation only. OANDA does not guarantee the accuracy of this information and assumes no responsibilities for the information provided by the third party. The information does not take into account the specific investment objectives, financial situation, or particular needs of any particular person. You should take into account your specific investment objectives, financial situation, and particular needs before making a commitment to trade, including seeking, under a separate engagement, as you deem fit.
You accept that you assume all risks in independently viewing the contents and selecting a chosen strategy.
Where the research is distributed in Singapore to a person who is not an Accredited Investor, Expert Investor or an Institutional Investor, Oanda Asia Pacific Pte Ltd (“OAP“) accepts legal responsibility for the contents of the report to such persons only to the extent required by law. Singapore customers should contact OAP at 6579 8289 for matters arising from, or in connection with, the information/research distributed.

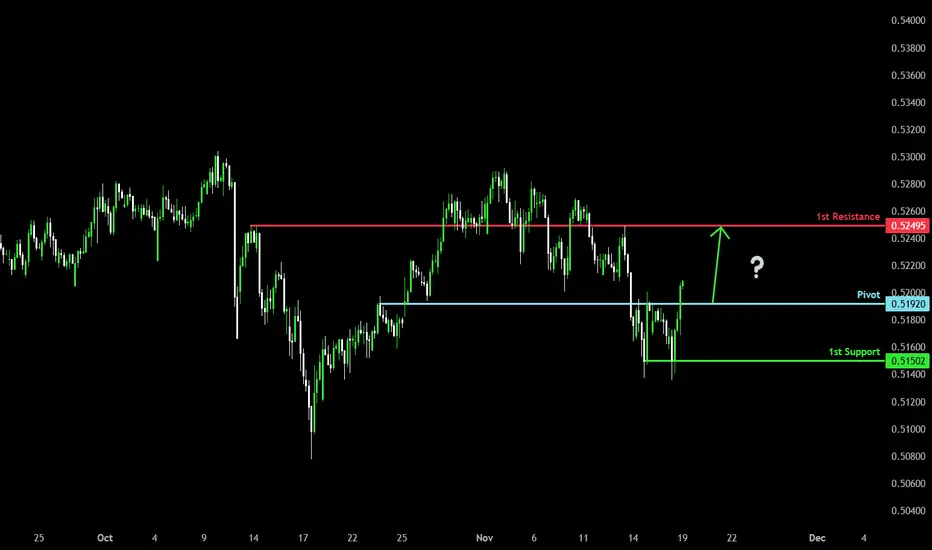
Bullish reversal?AUD/CHF could make a short-term pullback to the pivot, which acts as an overlap support, and could bounce to the 1st resistance.
Pivot: 0.51920
1st Resistance: 0.52495
1st Support: 0.51502
Disclaimer:
The opinions given above constitute general market commentary and do not constitute the opinion or advice of IC Markets or any form of personal or investment advice.
Any opinions, news, research, analyses, prices, other information, or links to third-party sites contained on this website are provided on an "as-is" basis, are intended to be informative only, and are not advice, a recommendation, research, a record of our trading prices, an offer of, or solicitation for, a transaction in any financial instrument and thus should not be treated as such. The information provided does not involve any specific investment objectives, financial situation, or needs of any specific person who may receive it. Please be aware that past performance is not a reliable indicator of future performance and/or results. Past performance or forward-looking scenarios based upon the reasonable beliefs of the third-party provider are not a guarantee of future performance. Actual results may differ materially from those anticipated in forward-looking or past performance statements. IC Markets makes no representation or warranty and assumes no liability as to the accuracy or completeness of the information provided, nor any loss arising from any investment based on a recommendation, forecast, or any information supplied by any third party.
AUDUSD: Watching 0.6470 as Fed Cut Bets GrowHey Traders,
In today’s session we’re monitoring AUDUSD for a potential buying opportunity around the 0.64700 zone. The pair remains in a clear uptrend, and price is currently pulling back toward a major trend support / S&R confluence at 0.64700 — a level where bulls have previously stepped in with conviction.
On the macro side, I continue to think that the incoming data will ultimately force the FED into a December cut, despite the market still being mixed on the odds. If that scenario plays out, it would set the stage for broad USD weakness, which aligns perfectly with a bullish continuation on AUDUSD.
A reaction from the 0.64700 area could offer a solid continuation setup if the trend structure holds.
Trade safe,
Joe.

Falling towards key support?AUD/USD is pulling back toward the pivot level, which serves as a multi–swing-low support zone. From this area, the pair may find buying interest and potentially rebound toward the 1st resistance level.
Pivot: 0.6468
1st Support: 0.6444
1st Resitance: 0.6498
Disclaimer:
The opinions given above constitute general market commentary and do not constitute the opinion or advice of IC Markets or any form of personal or investment advice.
Any opinions, news, research, analyses, prices, other information, or links to third-party sites contained on this website are provided on an "as-is" basis, are intended to be informative only, and are not advice, a recommendation, research, a record of our trading prices, an offer of, or solicitation for, a transaction in any financial instrument and thus should not be treated as such. The information provided does not involve any specific investment objectives, financial situation, or needs of any specific person who may receive it. Please be aware that past performance is not a reliable indicator of future performance and/or results. Past performance or forward-looking scenarios based upon the reasonable beliefs of the third-party provider are not a guarantee of future performance. Actual results may differ materially from those anticipated in forward-looking or past performance statements. IC Markets makes no representation or warranty and assumes no liability as to the accuracy or completeness of the information provided, nor any loss arising from any investment based on a recommendation, forecast, or any information supplied by any third party.

EURAUD dips continue to attract buyers.EURAUD - 24h expiry
Indecisive price action has resulted in sideways congestion on the intraday chart.
Pivot support is at 1.7600.
Risk/Reward would be poor to call a buy from current levels.
A move through 1.7850 will confirm the bullish momentum.
The measured move target is 1.7875.
We look to Buy at 1.7775 (stop at 1.7700)
Our profit targets will be 1.7925 and 1.7950
Resistance: 1.7850 / 1.7900 / 1.7950
Support: 1.7800 / 1.7775 / 1.7750
Risk Disclaimer
The trade ideas beyond this page are for informational purposes only and do not constitute investment advice or a solicitation to trade. This information is provided by Signal Centre, a third-party unaffiliated with OANDA, and is intended for general circulation only. OANDA does not guarantee the accuracy of this information and assumes no responsibilities for the information provided by the third party. The information does not take into account the specific investment objectives, financial situation, or particular needs of any particular person. You should take into account your specific investment objectives, financial situation, and particular needs before making a commitment to trade, including seeking, under a separate engagement, as you deem fit.
You accept that you assume all risks in independently viewing the contents and selecting a chosen strategy.
Where the research is distributed in Singapore to a person who is not an Accredited Investor, Expert Investor or an Institutional Investor, Oanda Asia Pacific Pte Ltd (“OAP“) accepts legal responsibility for the contents of the report to such persons only to the extent required by law. Singapore customers should contact OAP at 6579 8289 for matters arising from, or in connection with, the information/research distributed.

AudUsd Next Move In This Chart Showing
Red Horizantal Lines = Strong Support
Blue Diagonal Line = Trendline support
Best Trade: Sell Setup ( High Probability )
Aud Usd Chart Showing A Downtrend So The Sell Side Is Stronger.
Sell Entry
Enter a SELL only when the blue trendline breaks:
A candle closes below the trendline
Then wait for a retest
Enter at the retest of the trendline from below
This gives the safest entry.
Stop Loss (SL)
Place SL above the broken trendline
→ Usually 50–100 pips on M1.
Take Profit (TP)
TP1: nearest swing low
TP2: next support zone
TP3: last liquidity area lower on the chart
On M1, typical targets:
TP1 = 100–150 pips
TP2 = 200–300 pips
2. BUY Setup (Low Probability)
A buy is only valid if price breaks the red resistance line.
Buy Entry
Candle closes above the red line
Then wait for a retest
Enter BUY on the retest
Stop Loss:
Below the red line (50–100 pips)
Take Profit:
TP1 — previous high
TP2 — next resistance
TP3 — liquidity above the last high
Buy Sell Your Own Research
For More Updates Stay Alert

AUD/USD Holds Above 100-day EMAWhile the Aussie saw two-way volatility last week and a narrow open-to-close range between Tuesday and Friday, my bias remains bullish with scope for a move towards the 0.6580 high.
Risk reversals point to limited downside for AUD/USD on the options market. The pair also posted four consecutive daily closes above the 100-day EMA, with prices attempting to hold above the 20-day EMA. Monday’s strong bullish candle set the tone for the current range, and Thursday’s spinning-top doji highlights demand sitting just above the 200-day EMA.
The one-hour chart shows volumes rising during Friday’s rally but fading during the pullback, suggesting the move lower lacks real bearish intent. If AUD/USD can hold above the September low, the oversold hourly RSI(2) supports a bounce towards 0.6550. A break above that level exposes the weekly R1 near the 0.6580 high.
Matt Simpson, Market Analyst at City Index.

Aussie H4 | Could We See A Reversal From Here?Momentum: Bearish
The price is moving upward toward the sell entry, which is positioned slightly below the 78.6% Fibonacci retracement, adding significant strength to this resistance level.
Sell Entry: 0.6572
Pullback resistance
Slightly below the 78.6% Fibonacci retracement
Stop Loss: 0.6619
Multi swing high resistance
Take Profit: 0.6517
Overlap support
High Risk Investment Warning
Stratos Markets Limited (tradu.com ), Stratos Europe Ltd (tradu.com ):
CFDs are complex instruments and come with a high risk of losing money rapidly due to leverage. 70% of retail investor accounts lose money when trading CFDs with this provider. You should consider whether you understand how CFDs work and whether you can afford to take the high risk of losing your money.
Stratos Global LLC (tradu.com ): Losses can exceed deposits.
Please be advised that the information presented on TradingView is provided to Tradu (‘Company’, ‘we’) by a third-party provider (‘TFA Global Pte Ltd’). Please be reminded that you are solely responsible for the trading decisions on your account. Any information and/or content is intended entirely for research, educational and informational purposes only and does not constitute investment or consultation advice or investment strategy. The information is not tailored to the investment needs of any specific person and therefore does not involve a consideration of any of the investment objectives, financial situation or needs of any viewer that may receive it. Past performance is not a reliable indicator of future results. Actual results may differ materially from those anticipated in forward-looking or past performance statements. We assume no liability as to the accuracy or completeness of any of the information and/or content provided herein and the Company cannot be held responsible for any omission, mistake nor for any loss or damage including without limitation to any loss of profit which may arise from reliance on any information supplied by TFA Global Pte Ltd.

Bullish bounce off 50% Fibonacci support?GBP/AUD has bounced off the pivot level, which is acting as a pullback support, and the pair could potentially rise toward the 1st resistance.
Pivot: 2.0082
1st Support: 1.9995
1st Resistance: 2.0272
Disclaimer:
The opinions given above constitute general market commentary and do not constitute the opinion or advice of IC Markets or any form of personal or investment advice.
Any opinions, news, research, analyses, prices, other information, or links to third-party sites contained on this website are provided on an "as-is" basis, are intended to be informative only, and are not advice, a recommendation, research, a record of our trading prices, an offer of, or solicitation for, a transaction in any financial instrument and thus should not be treated as such. The information provided does not involve any specific investment objectives, financial situation, or needs of any specific person who may receive it. Please be aware that past performance is not a reliable indicator of future performance and/or results. Past performance or forward-looking scenarios based upon the reasonable beliefs of the third-party provider are not a guarantee of future performance. Actual results may differ materially from those anticipated in forward-looking or past performance statements. IC Markets makes no representation or warranty and assumes no liability as to the accuracy or completeness of the information provided, nor any loss arising from any investment based on a recommendation, forecast, or any information supplied by any third party.
