Falling towards strong support?Aussie (AUD/USD) is falling towards the pivot and could bounce to the 1st resistance.
Pivot: 0.6516
1st Support: 0.6503
1st Resistance: 0.6548
Disclaimer:
The opinions given above constitute general market commentary and do not constitute the opinion or advice of IC Markets or any form of personal or investment advice.
Any opinions, news, research, analyses, prices, other information, or links to third-party sites contained on this website are provided on an "as-is" basis, are intended to be informative only, and are not advice, a recommendation, research, a record of our trading prices, an offer of, or solicitation for, a transaction in any financial instrument and thus should not be treated as such. The information provided does not involve any specific investment objectives, financial situation, or needs of any specific person who may receive it. Please be aware that past performance is not a reliable indicator of future performance and/or results. Past performance or forward-looking scenarios based upon the reasonable beliefs of the third-party provider are not a guarantee of future performance. Actual results may differ materially from those anticipated in forward-looking or past performance statements. IC Markets makes no representation or warranty and assumes no liability as to the accuracy or completeness of the information provided, nor any loss arising from any investment based on a recommendation, forecast, or any information supplied by any third party.
D-AUD

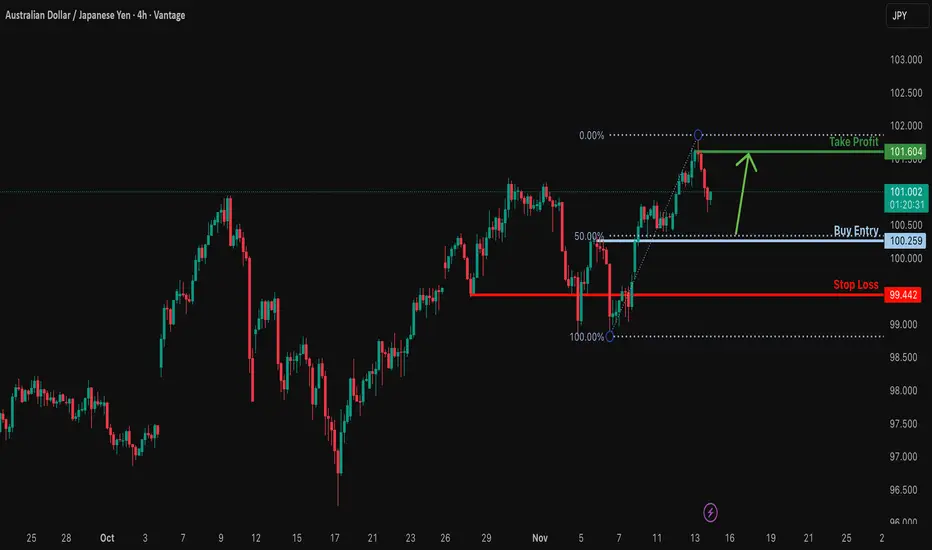
Bullish bounce off 50% Fibonacci support?AUD/JPY is declining toward a key support area, which is a pullback level aligned with the 50% Fibonacci retracement. From this level, the pair could potentially bounce toward our take-profit target.
Entry: 100.25
Why we like it:
Price is approaching a pullback support zone that aligns with the 50% Fibonacci retracement.
Stop Loss: 99.44
Why we like it:
This level is positioned just below the pullback support, providing a logical risk buffer.
Take Profit: 101.60
Why we like it:
This target aligns with a swing-high resistance level.
Enjoying your TradingView experience? Review us!
Please be advised that the information presented on TradingView is provided to Vantage (‘Vantage Global Limited’, ‘we’) by a third-party provider (‘Everest Fortune Group’). Please be reminded that you are solely responsible for the trading decisions on your account. There is a very high degree of risk involved in trading. Any information and/or content is intended entirely for research, educational and informational purposes only and does not constitute investment or consultation advice or investment strategy. The information is not tailored to the investment needs of any specific person and therefore does not involve a consideration of any of the investment objectives, financial situation or needs of any viewer that may receive it. Kindly also note that past performance is not a reliable indicator of future results. Actual results may differ materially from those anticipated in forward-looking or past performance statements. We assume no liability as to the accuracy or completeness of any of the information and/or content provided herein and the Company cannot be held responsible for any omission, mistake nor for any loss or damage including without limitation to any loss of profit which may arise from reliance on any information supplied by Everest Fortune Group.
Bearish drop off?AUD/CHF is rising towards the resistance level, which is an overlap resistance, and could reverse from this area toward our take-profit target.
Entry: 0.52169
Why we like it:
There is an overlap resistance level.
Stop Loss: 0.52670
Why we like it:
There is a pullback resistance level.
Take Profit: 0.50994
Why we like it:
There is a swing-low support level.
Enjoying your TradingView experience? Review us!
Please be advised that the information presented on TradingView is provided to Vantage (‘Vantage Global Limited’, ‘we’) by a third-party provider (‘Everest Fortune Group’). Please be reminded that you are solely responsible for the trading decisions on your account. There is a very high degree of risk involved in trading. Any information and/or content is intended entirely for research, educational and informational purposes only and does not constitute investment or consultation advice or investment strategy. The information is not tailored to the investment needs of any specific person and therefore does not involve a consideration of any of the investment objectives, financial situation or needs of any viewer that may receive it. Kindly also note that past performance is not a reliable indicator of future results. Actual results may differ materially from those anticipated in forward-looking or past performance statements. We assume no liability as to the accuracy or completeness of any of the information and/or content provided herein and the Company cannot be held responsible for any omission, mistake nor for any loss or damage including without limitation to any loss of profit which may arise from reliance on any information supplied by Everest Fortune Group.

AUDNZD Massive sell opportunity.The AUDNZD pair has been trading within a 5-year Channel Up since the March 2020 COVID flash-crash. The pattern has been on its latest Bullish Leg since the April 21 Low and just hit this week the 0.786 Fibonacci level of the Channel.
The 1.0 - 0.786 Fibonacci Zone has started the pattern's two Bearish Legs. The market already favors selling inside this Zone, with the Risk/ Reward ratio very appealing with the most optimal Sell Signal being when the 1W RSI touches its long-term Higher Highs trend-line.
If that happens with the pair around the 0.786 Fib, our Target will be 1.12000 (Fib 0.382). If it happens with the pair closer to the 1.0 Fib, our Target will be 1.11000 (Fib 0.236).
---
** Please LIKE 👍, FOLLOW ✅, SHARE 🙌 and COMMENT ✍ if you enjoy this idea! Also share your ideas and charts in the comments section below! This is best way to keep it relevant, support us, keep the content here free and allow the idea to reach as many people as possible. **
---
💸💸💸💸💸💸
👇 👇 👇 👇 👇 👇

AUDUSD Breakout and Potential RetraceHey Traders, in today's trading session we are monitoring AUDUSD for a buying opportunity around 0.64800 zone, AUDUSD was trading in a downtrend and successfully managed to break it out. Currently is in a correction phase in which it is approaching the retrace area at 0.64800 support and resistance area.
Trade safe, Joe.

EURAUD to find buyers at current market price?EURAUD - 24h expiry
Indecisive price action has resulted in sideways congestion on the intraday chart.
Pivot support is at 1.7600.
Risk/Reward would be poor to call a buy from current levels.
A move through 1.7750 will confirm the bullish momentum.
The measured move target is 1.7875.
We look to Buy at 1.7700 (stop at 1.7625)
Our profit targets will be 1.7850 and 1.7875
Resistance: 1.7750 / 1.7800 / 1.7850
Support: 1.7725 / 1.7700 / 1.7650
Risk Disclaimer
The trade ideas beyond this page are for informational purposes only and do not constitute investment advice or a solicitation to trade. This information is provided by Signal Centre, a third-party unaffiliated with OANDA, and is intended for general circulation only. OANDA does not guarantee the accuracy of this information and assumes no responsibilities for the information provided by the third party. The information does not take into account the specific investment objectives, financial situation, or particular needs of any particular person. You should take into account your specific investment objectives, financial situation, and particular needs before making a commitment to trade, including seeking, under a separate engagement, as you deem fit.
You accept that you assume all risks in independently viewing the contents and selecting a chosen strategy.
Where the research is distributed in Singapore to a person who is not an Accredited Investor, Expert Investor or an Institutional Investor, Oanda Asia Pacific Pte Ltd (“OAP“) accepts legal responsibility for the contents of the report to such persons only to the extent required by law. Singapore customers should contact OAP at 6579 8289 for matters arising from, or in connection with, the information/research distributed.

Bearish drop off pullback resistance?GBP/AUD has reacted off the pivot and could drop to the 1st support.
Pivot: 0153
1st Support: 1.9970
1st Resistance: 2.0309
Disclaimer:
The opinions given above constitute general market commentary and do not constitute the opinion or advice of IC Markets or any form of personal or investment advice.
Any opinions, news, research, analyses, prices, other information, or links to third-party sites contained on this website are provided on an "as-is" basis, are intended to be informative only, and are not advice, a recommendation, research, a record of our trading prices, an offer of, or solicitation for, a transaction in any financial instrument and thus should not be treated as such. The information provided does not involve any specific investment objectives, financial situation, or needs of any specific person who may receive it. Please be aware that past performance is not a reliable indicator of future performance and/or results. Past performance or forward-looking scenarios based upon the reasonable beliefs of the third-party provider are not a guarantee of future performance. Actual results may differ materially from those anticipated in forward-looking or past performance statements. IC Markets makes no representation or warranty and assumes no liability as to the accuracy or completeness of the information provided, nor any loss arising from any investment based on a recommendation, forecast, or any information supplied by any third party.

How i trade This is how i trade.
Looking at AUDJPY, I want to show you step by step how i trade using volume, momentum and rsi, looking at each timeframe from the monthly to the 5 min.

GBPAUD to continue in the downward move?GBPAUD - 24h expiry
Daily signals are bearish.
The overnight rally has been sold into and there is scope for further bearish pressure going into this morning.
20 1day EMA is at 2.0276.
Previous resistance located at 2.0285.
We look for a temporary move higher.
We look to Sell at 2.0275 (stop at 2.0351)
Our profit targets will be 2.0055 and 2.0015
Resistance: 2.0192 / 2.0260 / 2.0342
Support: 2.0134 / 2.0100 / 2.0020
Risk Disclaimer
The trade ideas beyond this page are for informational purposes only and do not constitute investment advice or a solicitation to trade. This information is provided by Signal Centre, a third-party unaffiliated with OANDA, and is intended for general circulation only. OANDA does not guarantee the accuracy of this information and assumes no responsibilities for the information provided by the third party. The information does not take into account the specific investment objectives, financial situation, or particular needs of any particular person. You should take into account your specific investment objectives, financial situation, and particular needs before making a commitment to trade, including seeking, under a separate engagement, as you deem fit.
You accept that you assume all risks in independently viewing the contents and selecting a chosen strategy.
Where the research is distributed in Singapore to a person who is not an Accredited Investor, Expert Investor or an Institutional Investor, Oanda Asia Pacific Pte Ltd (“OAP“) accepts legal responsibility for the contents of the report to such persons only to the extent required by law. Singapore customers should contact OAP at 6579 8289 for matters arising from, or in connection with, the information/research distributed.

AUDUSD H1 | Heading Into Overlap ResistanceMomentum: Bearish
Price is rising toward the sell entry, which aligns with the 50% Fibonacci retracement and the 127.2% Fibonacci extension.
Sell Entry: 0.6538
Overlap resistance
50% Fibonacci retracement and 127.2% Fibonacci extension
Stop Loss: 0.6557
Strong overlap resistance
61.8% Fibonacci retracement
Take Profit: 0.6503
Pullback support
Stratos Markets Limited (tradu.com ):
CFDs are complex instruments and come with a high risk of losing money rapidly due to leverage. 68% of retail investor accounts lose money when trading CFDs with this provider. You should consider whether you understand how CFDs work and whether you can afford to take the high risk of losing your money.
Stratos Europe Ltd (tradu.com ):
CFDs are complex instruments and come with a high risk of losing money rapidly due to leverage. 70% of retail investor accounts lose money when trading CFDs with this provider. You should consider whether you understand how CFDs work and whether you can afford to take the high risk of losing your money.

AUDUSD Potential DownsidesHey Traders, in today's trading session we are monitoring AUDUSD for a selling opportunity around 0.65100 zone, AUDUSD is trading in a downtrend and currently is in a correction phase in which it is approaching the trend at 0.65100 support and resistance area.
Trade safe, Joe.

Aussie H1 | Bearish Momentum To ExtendBased on the H1 chart analysis, we could see the price rise to the sell entry, whichis a pullback resitance that aligns with the 61.8% Fibonacci retracement and could drop from this level to the downside.
Sell entry is at 0.6502, which is a pullback resistance.
Stop loss is at 0.6532, which is a pullback resistance that is slightly below the 50% Fibonacci retracemnt.
Take profit is at 0.6446, which is a pullback support that aligns with the 78.6% Fibonacci projection.
SStratos Markets Limited (tradu.com ):
CFDs are complex instruments and come with a high risk of losing money rapidly due to leverage. 68% of retail investor accounts lose money when trading CFDs with this provider. You should consider whether you understand how CFDs work and whether you can afford to take the high risk of losing your money.
Stratos Europe Ltd (tradu.com ):
CFDs are complex instruments and come with a high risk of losing money rapidly due to leverage. 70% of retail investor accounts lose money when trading CFDs with this provider. You should consider whether you understand how CFDs work and whether you can afford to take the high risk of losing your money.

EUR/AUD, EUR/NZD Technical SetupsThe euro has seen a fresh burst of bullish momentum against the Australian and New Zealand dollars, providing a near-term bullish bias for EUR/AUD and a longer-term one for EUR/NZD.
Matt Simpson, Market Analyst at City Index.

AUD/USD – Smart Money Building Quietly at the BottomThe AUD/USD pair is trading around 0.6510, consolidating after an extended bearish move. From a Smart Money Concept (SMC) perspective, price action suggests that institutional players may be absorbing liquidity at discounted prices, hinting at a potential accumulation phase before driving price upward to collect liquidity at higher zones.
💭 1️⃣ Market Structure – When Price Pauses to “Take a Breath”
Following a series of bearish legs, AUD/USD has formed a Market Structure Shift (MSS) near the 0.6460 zone, signaling early signs of weakening bearish momentum.
Currently, price is holding within 0.6500 – 0.6510, forming a stable base of support. If this structure holds, it may serve as the foundation for a short-term bullish correction targeting the upper supply zones.
Each dip into the lower range has shown long lower wicks and narrow candle bodies — a classic footprint of Smart Money absorbing sell-side liquidity in preparation for accumulation.
🩶 2️⃣ Supply & Demand Zones – Footprints of Smart Money
Karina is closely monitoring three key structural zones:
Demand Zones:
0.6462 – 0.6432: A strong demand base where price has reacted multiple times — likely a zone of institutional accumulation.
0.6504: A short-term demand area currently being tested, acting as the first layer of support.
Supply Zones:
0.6570: A local supply zone where price may react upon retracement.
0.6642 – 0.6667: A higher supply zone filled with resting buy-side liquidity — potential target area for the next institutional move.
🧭 3️⃣ Liquidity Context – When Smart Money Buys Low to Sell High
The liquidity landscape shows that sell-side liquidity has already been swept near 0.6460, while buy-side liquidity remains untouched around 0.6618 – 0.6707.
This aligns perfectly with a common SMC narrative:
Smart Money absorbs liquidity below → builds structure → drives price upward to collect liquidity above.
If price maintains structure above 0.6504 – 0.6462, we could see a bullish displacement toward the next liquidity pools around 0.6570 and 0.6640 – 0.6660.
🌙 4️⃣ Trade Scenario – Follow Smart Money, Don’t Fight It
Karina’s current bias favors buying from discount zones once structure confirms a shift.
Entry: 0.6465 – 0.6500
Stop Loss: below 0.6430
Take Profit: 0.6570 – 0.6660
This setup aligns with institutional logic — buy where Smart Money accumulates, take profit where they distribute.
🌷 5️⃣ Reflection – When the Market Is Quiet, Institutions Are Working
The market doesn’t need loud volatility to tell a story — often, quiet accumulation speaks the loudest.
To Karina, this phase is about patience and observation — letting structure reveal its intent instead of rushing into noise.
Right now, the market feels like it’s taking a deep breath before its next move. Smart Money usually moves in silence — they buy low, and sell high. 🌸

Bearish reversal off 50% Fibonacci resistance?The Aussie (AUD/USD) is rising towards the pivot which lines up with the 50% Fibonacci retracement and could reverse to the 1st support.
Pivot: 0.6537
1st Support: 0.6442
1st Resistance: 0.6606
Disclaimer:
The above opinions given constitute general market commentary, and do not constitute the opinion or advice of IC Markets or any form of personal or investment advice.
Any opinions, news, research, analyses, prices, other information, or links to third-party sites contained on this website are provided on an "as-is" basis, are intended only to be informative, is not an advice nor a recommendation, nor research, or a record of our trading prices, or an offer of, or solicitation for a transaction in any financial instrument and thus should not be treated as such. The information provided does not involve any specific investment objectives, financial situation and needs of any specific person who may receive it. Please be aware, that past performance is not a reliable indicator of future performance and/or results. Past Performance or Forward-looking scenarios based upon the reasonable beliefs of the third-party provider are not a guarantee of future performance. Actual results may differ materially from those anticipated in forward-looking or past performance statements. IC Markets makes no representation or warranty and assumes no liability as to the accuracy or completeness of the information provided, nor any loss arising from any investment based on a recommendation, forecast or any information supplied by any third-party.

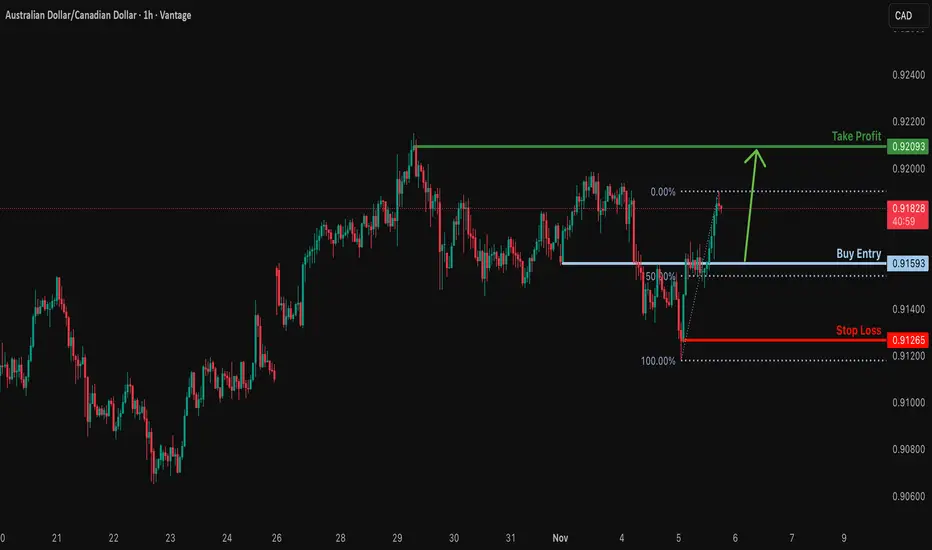
Bullish bounce off overlap support?AUD/CAD is falling towards the support level, which is a pullback support that is slightly above the 50% Fibonacci retracement and could bounce from this level to our take profit.
Entry: 0.91593
Why we like it:
There is a pullback support that is slightly above the 50% Fibonacci retracement.
Stop loss: 0.91265
Why we like it:
There is a swing low support level.
Take profit: 0.92093
Why we like it:
There is a swing resistance level.
Enjoying your TradingView experience? Review us!
Please be advised that the information presented on TradingView is provided to Vantage (‘Vantage Global Limited’, ‘we’) by a third-party provider (‘Everest Fortune Group’). Please be reminded that you are solely responsible for the trading decisions on your account. There is a very high degree of risk involved in trading. Any information and/or content is intended entirely for research, educational and informational purposes only and does not constitute investment or consultation advice or investment strategy. The information is not tailored to the investment needs of any specific person and therefore does not involve a consideration of any of the investment objectives, financial situation or needs of any viewer that may receive it. Kindly also note that past performance is not a reliable indicator of future results. Actual results may differ materially from those anticipated in forward-looking or past performance statements. We assume no liability as to the accuracy or completeness of any of the information and/or content provided herein and the Company cannot be held responsible for any omission, mistake nor for any loss or damage including without limitation to any loss of profit which may arise from reliance on any information supplied by Everest Fortune Group.
Bearish reversal off pullback resistance?EUR/AUD is rising towards the pivot and could reverse to the multi-wing low support.
Pivot: 1.78317
1st Support: 1.75799
1st Resistance: 1.79621
Disclaimer:
The above opinions given constitute general market commentary, and do not constitute the opinion or advice of IC Markets or any form of personal or investment advice.
Any opinions, news, research, analyses, prices, other information, or links to third-party sites contained on this website are provided on an "as-is" basis, are intended only to be informative, is not an advice nor a recommendation, nor research, or a record of our trading prices, or an offer of, or solicitation for a transaction in any financial instrument and thus should not be treated as such. The information provided does not involve any specific investment objectives, financial situation and needs of any specific person who may receive it. Please be aware, that past performance is not a reliable indicator of future performance and/or results. Past Performance or Forward-looking scenarios based upon the reasonable beliefs of the third-party provider are not a guarantee of future performance. Actual results may differ materially from those anticipated in forward-looking or past performance statements. IC Markets makes no representation or warranty and assumes no liability as to the accuracy or completeness of the information provided, nor any loss arising from any investment based on a recommendation, forecast or any information supplied by any third-party.

Bearish drop off?AUD/JPY is rising towards the pivot which is a pullback resitance and could reverse to the 50% Fibonacci support.
Pivot: 100.37
1st Suport: 98.78
1st Resistance: 101.16
Disclaimer:
The above opinions given constitute general market commentary, and do not constitute the opinion or advice of IC Markets or any form of personal or investment advice.
Any opinions, news, research, analyses, prices, other information, or links to third-party sites contained on this website are provided on an "as-is" basis, are intended only to be informative, is not an advice nor a recommendation, nor research, or a record of our trading prices, or an offer of, or solicitation for a transaction in any financial instrument and thus should not be treated as such. The information provided does not involve any specific investment objectives, financial situation and needs of any specific person who may receive it. Please be aware, that past performance is not a reliable indicator of future performance and/or results. Past Performance or Forward-looking scenarios based upon the reasonable beliefs of the third-party provider are not a guarantee of future performance. Actual results may differ materially from those anticipated in forward-looking or past performance statements. IC Markets makes no representation or warranty and assumes no liability as to the accuracy or completeness of the information provided, nor any loss arising from any investment based on a recommendation, forecast or any information supplied by any third-party.

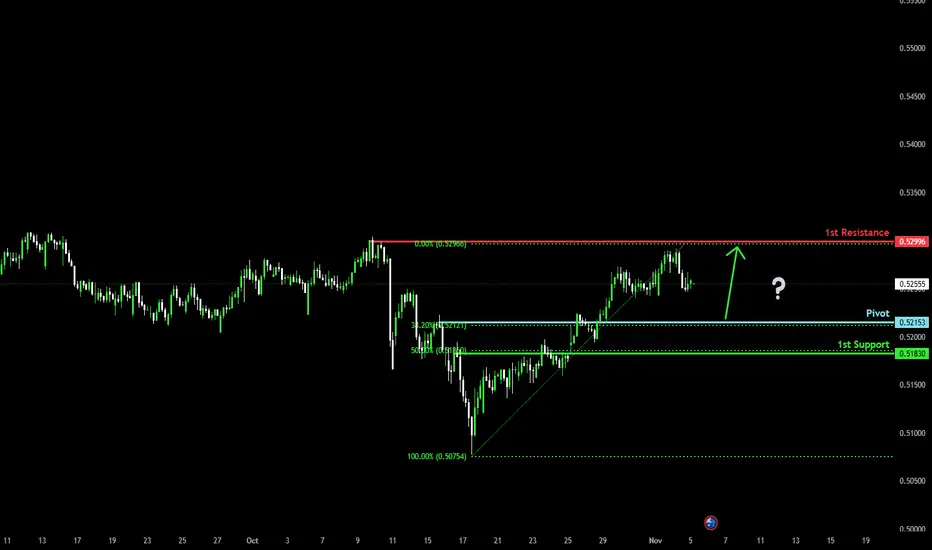
Bullish bounce off 38.2% Fibonacci support?AUD/CHF is falling towards the pivot which is a pullback support that aligns with the 38.2% Fibonacci retracement and could bounce to the 1st resistance, which is a swing high resistance.
Pivot: 0.52153
1st Support: 0.51830
1st Resistance: 0.52996
Disclaimer:
The above opinions given constitute general market commentary, and do not constitute the opinion or advice of IC Markets or any form of personal or investment advice.
Any opinions, news, research, analyses, prices, other information, or links to third-party sites contained on this website are provided on an "as-is" basis, are intended only to be informative, is not an advice nor a recommendation, nor research, or a record of our trading prices, or an offer of, or solicitation for a transaction in any financial instrument and thus should not be treated as such. The information provided does not involve any specific investment objectives, financial situation and needs of any specific person who may receive it. Please be aware, that past performance is not a reliable indicator of future performance and/or results. Past Performance or Forward-looking scenarios based upon the reasonable beliefs of the third-party provider are not a guarantee of future performance. Actual results may differ materially from those anticipated in forward-looking or past performance statements. IC Markets makes no representation or warranty and assumes no liability as to the accuracy or completeness of the information provided, nor any loss arising from any investment based on a recommendation, forecast or any information supplied by any third-party.
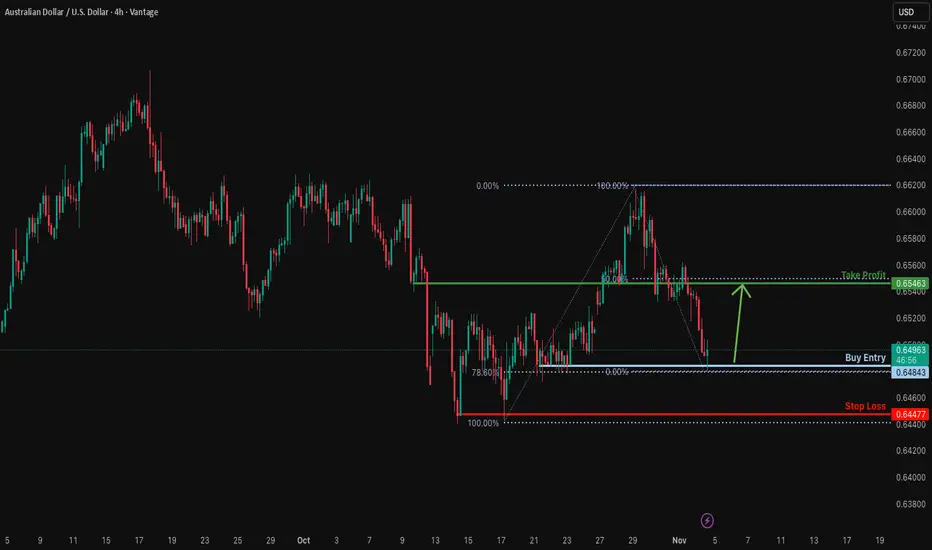
Potential bullish reversal?AUD/USD is reacting off the support level is a pullback support that aligns with the 78.6% Fibonacci retracement and could bounce from this level to our take profit.
Entry: 0.6484
Why we like it:
There is a pullback support level that aligns with the 78.6% Fibonacci retracement
Stop loss: 0.6447
Why we like it:
There is a multi-swing low support level.
Take profit: 0.6546
Why we like it:
There is an overlap resistance that aligns with the 5% Fibonacci retracement.
Enjoying your TradingView experience? Review us!
Please be advised that the information presented on TradingView is provided to Vantage (‘Vantage Global Limited’, ‘we’) by a third-party provider (‘Everest Fortune Group’). Please be reminded that you are solely responsible for the trading decisions on your account. There is a very high degree of risk involved in trading. Any information and/or content is intended entirely for research, educational and informational purposes only and does not constitute investment or consultation advice or investment strategy. The information is not tailored to the investment needs of any specific person and therefore does not involve a consideration of any of the investment objectives, financial situation or needs of any viewer that may receive it. Kindly also note that past performance is not a reliable indicator of future results. Actual results may differ materially from those anticipated in forward-looking or past performance statements. We assume no liability as to the accuracy or completeness of any of the information and/or content provided herein and the Company cannot be held responsible for any omission, mistake nor for any loss or damage including without limitation to any loss of profit which may arise from reliance on any information supplied by Everest Fortune Group.
AUDUSD Potential DownsidesHey Traders, in today's trading session we are monitoring AUDUSD for a selling opportunity around 0.65300 zone, AUDUSD is trading in a downtrend and currently is in a correction phase in which it is approaching the trend at 0.65300 support and resistance area.
Trade safe, Joe.

AUD/JPY - Bullish Flag (03.11.2025)🧠 Setup Overview:
AUD/JPY is forming a Bullish Flag Pattern on the 30-minute chart — a continuation setup suggesting potential upside momentum after consolidation. The price has respected the flag support zone and is attempting a breakout above the descending channel, signaling renewed bullish pressure.
💡 Technical Plan: Pattern: Bullish Flag Pattern
Bias: Buy after confirmation breakout and retest
Support Zone: 100.650 – 100.700
Entry Zone: Near 100.850 – 100.900 (after breakout confirmation)
Targets:
🎯 1st Resistance: 101.460
🎯 2nd Resistance: 101.753
Invalidation: Close below 100.600 negates the bullish bias
🌏 Fundamental Insight (Today – 3 Nov 2025)
The AUD finds strength as China’s manufacturing PMI beats expectations, improving sentiment for commodity-linked currencies.
Meanwhile, the JPY remains under pressure due to continued Bank of Japan dovishness and yield differentials favoring risk assets.
Market tone is risk-on, further supporting bullish momentum in AUD/JPY.
⚠️ Disclaimer:
This setup is shared for educational purposes only. It is not financial advice. Always do your own analysis and apply proper risk management before trading any setup.
#AUDJPY #Forex #TechnicalAnalysis #PriceAction #BullishFlag #BreakoutTrading #Ichimoku #KABHI_TA_TRADING #ChartsDontLieTradersDontQuit #ForexSetup #MarketAnalysis #TradingView #FXMarket #BuySetup #ForexCommunity #AUD #JPY #ForexTrader
💬 Support My Work ❤️
If you find this analysis useful — LIKE 👍, COMMENT 💭, and FOLLOW 🔔 for more daily Forex chart updates and trade setups!

Potential bearish drop?The Aussie (AUD/USD) has rejected off the pivot, which is a pullback resistance and could potentially drop to the 1st support, which acts as a pullback suport that aligns with the 61.8% Fibonacci projection.
Pivot: 0.6558
1st Support: 0.6446
1st Resistance: 0.6624
Disclaimer:
The above opinions given constitute general market commentary, and do not constitute the opinion or advice of IC Markets or any form of personal or investment advice.
Any opinions, news, research, analyses, prices, other information, or links to third-party sites contained on this website are provided on an "as-is" basis, are intended only to be informative, is not an advice nor a recommendation, nor research, or a record of our trading prices, or an offer of, or solicitation for a transaction in any financial instrument and thus should not be treated as such. The information provided does not involve any specific investment objectives, financial situation and needs of any specific person who may receive it. Please be aware, that past performance is not a reliable indicator of future performance and/or results. Past Performance or Forward-looking scenarios based upon the reasonable beliefs of the third-party provider are not a guarantee of future performance. Actual results may differ materially from those anticipated in forward-looking or past performance statements. IC Markets makes no representation or warranty and assumes no liability as to the accuracy or completeness of the information provided, nor any loss arising from any investment based on a recommendation, forecast or any information supplied by any third-party.
