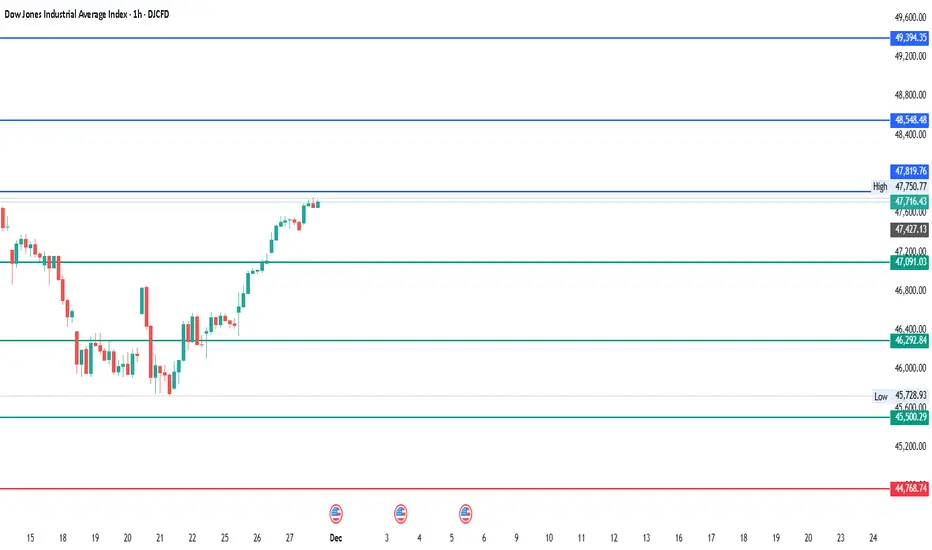
#DJI - 3,000 Points on Cards?Date: 01-12-2025
DJI - Current Price: $47,716
Pivot Point: $46,292.84 Support: $45,500.29 Resistance: $47,091.03
Upside Levels:
L1: $47,819.76 L2: $48,548.48 L3: $49,394.35 L4: $50,240.21
Downside Levels:
L1: $44,768.74 L2: $44,037.20 L3: $43,191.34 L4: $42,345.47
#TradingView #Nifty #BankNifty #DJI #NDQ #SENSEX #DAX #USOIL #GOLD #SILVER
D-DJI
DOW JONES Will the 1D MA100 save the day?Dow Jones (DJI) has been trading within a 6-month Channel Up and in the past 4 days it has been correcting on its latest Bearish Leg. By doing so, it broke below the 1D MA50 (blue trend-line) and is approaching the 1D MA100 (green trend-line) right at the bottom of the pattern.
This is the Channel's last Support. As long as it closes the daily candles above it, we will be bullish on Dow, targeting 49000, which represents a +7.25% rise, something all previous 3 Bullish Legs did.
---
** Please LIKE 👍, FOLLOW ✅, SHARE 🙌 and COMMENT ✍ if you enjoy this idea! Also share your ideas and charts in the comments section below! This is best way to keep it relevant, support us, keep the content here free and allow the idea to reach as many people as possible. **
---
💸💸💸💸💸💸
👇 👇 👇 👇 👇 👇

$DJI – Buy the Dip Opportunity | Target: 51,000TVC:DJI – Buy the Dip Opportunity | Target: 51,000 🚀
The Dow Jones is offering a high-probability dip-buying setup within a strong macro bullish structure. Wave alignment and smart money positioning suggest continuation toward the 51,000 zone. Price is respecting key Fibonacci levels and institutional support zones. Momentum is building — this could be the launchpad.
📍 Watch for confirmation on lower timeframes.
📈 Trend remains intact — stay with structure.
#ElliottWave #SmartMoney #Fibonacci #DowJones #DJI #TradingView #TechnicalAnalysis #BuyTheDip

US30 Day Trader Analysis US30 Day TraderAnalysis - 10 Nov 2025
Dow Jones 30 at 47,171 (4:30 PM UTC+4) — consolidation breakout setup forming.
📌 Market Context: Wyckoff Phase D accumulation post-October rally; Dow Theory primary uptrend intact with minor pullback; Gann Square-of-9 targets 47,600/46,800.
🗺️ Multi-Timeframe Pulse:
1D: Broadening wedge 46,800-47,500; RSI 61 (mild bearish divergence); Ichimoku cloud support 46,500; bullish pennant nearing breakout.
4H: Rising channel 47,000-47,400; EMA21>EMA50>EMA200 (golden cross); VWAP anchored Oct 1 = 46,950 (buy support).
1H: Cup-and-handle breakout base 47,050; BB expanding; VWAP slope bullish after morning dip test.
30M: Symmetrical triangle 47,100-47,250; hidden bull divergence on RSI; volume contracting pre-expansion.
15M: Bull flag above 47,120; Tenkan>Kijun bullish alignment; stochastic RSI reset ready for next leg.
5M: Falling wedge retest 47,140; hammer candlestick confirms demand; watch false breakout above 47,280.
🎯 PRIMARY LONG SETUP
Entry: 47,120-47,155 (triangle support + VWAP) — confirm on 15M bullish close >47,180.
Stop Loss: 47,050 (below triangle base).
Target 1: 47,250 (+80-130 pips).
Target 2: 47,400 (+230-280 pips — channel top).
Target 3: 47,550 (+400 pips — harmonic extension).
Confirmation: RSI>55, volume +20%, VWAP support holding.
⚡ MOMENTUM ADD: Scale above 47,400 ONLY if RSI>65 + volume surge; trail stop to 47,350.
🔻 REVERSAL SHORT SETUP
Entry: 47,500-47,600 (supply zone) — trigger on bearish engulfing + RSI divergence.
Stop Loss: 47,700 (above channel resistance).
Targets: 47,350 → 47,200 → 47,000 (Gann support).
Confirmation: 5M/15M RSI bearish divergence; BB upper band rejection.
🚨 BREAKOUT PROTOCOL:
BULL: 1H close >47,400 confirms wedge breakout; target 47,700; move stop to BE+20.
BEAR: 1H close <47,100 with volume expansion triggers retest 46,800 Gann support.
📊 INDICATOR SNAPSHOT: BB squeeze (30M) tightening; MACD histogram positive; VWAP slope up; EMA21 acting as trigger line on 1H.
⚠️ PATTERN ALERTS: Harmonic bat PRZ at 47,600; pennant breakout target aligns 47,550; channel failure <47,120 = Wyckoff spring risk; watch H&S if neckline 47,000 breaks.
📈 TIMING & VOLATILITY: US market close 21:00 UTC; earnings whispers elevate volatility; Gann 90° cycle 20:30 UTC. ATR(14) ≈150 pts expect 1.5% range. Risk ≤1% per setup; lock gains TP1; avoid chasing.
Educational analysis only. Align with your plan, manage risk diligently, adapt to live price action.

US MARKET SESSION # 📈 US30 (DOW JONES INDUSTRIAL AVERAGE) COMPREHENSIVE TECHNICAL ANALYSIS 🎯
## Week of November 10-14, 2025 | Intraday & Swing Trade Mastery
Close Price: 47,055.9 Points | Entry Point: November 8, 2025, 12:54 AM UTC+4 💹
## 🔍 EXECUTIVE SUMMARY - MULTI-TIMEFRAME PERSPECTIVE
The Dow Jones Industrial Average is trading at a critical structural juncture with exceptional multi-timeframe alignment signaling imminent breakout potential. Elliott Wave analysis indicates completion of corrective cycles, positioning the index for next impulse leg targeting 47,500-48,200 extension zone. Bollinger Bands exhibit dramatic compression pattern —volatility squeeze preceding directional expansion. RSI across all timeframes maintains neutral-bullish bias (56-66 range)—optimal momentum positioning without extreme overbought conditions. Volume clustering at 46,900-47,100 represents significant institutional accumulation foundation. Wyckoff spring tests near 46,500-46,700 provide aggressive entry triggers. Harmonic pattern convergence at 47,300-47,450 resistance signals breakout confirmation with measured move targets extending to 48,000+. Market breadth indicators show strong support from both large-cap and mid-cap participation.
## 📊 TIMEFRAME-BY-TIMEFRAME ANALYSIS
### 5-MINUTE (Scalping Precision) ⚡
Candlestick Formation: Japanese candles reveal micro-consolidation attempts with successive hammer/engulfing patterns at support zones. Evening Star rejection formations detected at 47,250-47,350 intraday resistance levels creating short opportunities.
Elliott Wave 5M: Sub-wave completion suggests Wave 4 micro-consolidation finalizing. Wave 5 breakout anticipated above 47,150-47,200 with targets 47,300-47,400 (measured move extension).
Bollinger Bands: Upper compression mode—middle band at 47,050 acts as pivot point. Lower band rejection (46,950-47,000) creates scalp-long setups. Squeeze breakout targets 47,350+ on volume confirmation.
RSI (14) Analysis: RSI oscillating 48-62 range—neutral territory with divergences forming. Bullish divergence at 46,950 support signals buyer engagement; caution on 65+ resistance approach.
Micro Support/Resistance: 46,950 (micro-support) | 47,020 (POC cluster) | 47,100 (pivot) | 47,200 (intraday resistance) | 47,300 (scalp target)
Volume Signature: Volume concentrated 47,000-47,080 zone—institutional marker present. Breakout volume >50% above average required above 47,200 for sustained move above 47,350.
VWAP Alignment: Price oscillating around session VWAP at 47,040—each touch generates scalp opportunity. Upper VWAP band at 47,280; lower support at 46,950.
### 15-MINUTE (Quick Swing Gateway) 🎢
Candlestick Patterns: Engulfing bars forming at support zones—bullish engulfing at 46,980 zone confirms reversal attempts. Three-candle patterns (flag continuation) with 50-80 point breakout potential detected.
Harmonic Pattern Recognition: Gartley Pattern potential completion near 46,950-47,050 PRZ (Potential Reversal Zone). Exceptional risk-reward ratio at 1:3.5 for harmonic traders. Butterfly variant also forming at secondary levels.
Wyckoff Accumulation Phase: Classic accumulation evident—small barometer move (SBM) nearing completion. Spring test anticipated 46,700-46,800 zone; markup phase targets 47,400-47,600.
Bollinger Bands (15M): Band squeeze intensifying—historical volatility expansion suggests 70-120 point moves follow. Upper band resistance at 47,300; lower band support at 46,800.
Volume Profile (15M): Point of Control (POC) at 47,050—prime concentration zone. Volume surge >60% required confirming breakout above 47,250. Imbalances favor upside probability significantly.
Ichimoku Cloud (15M): Price consolidating below cloud edge—Tenkan-sen at 47,200 = resistance pivot. Kijun-sen (47,100) = critical secondary support. Cloud support 46,850-46,950.
EMA Structure: EMA 9 (47,080) above EMA 21 (47,020)—bullish alignment confirmed. Price remaining above both = intraday strength maintained perfectly.
### 30-MINUTE (Intraday Swing Axis) 🔄
Pattern Formation: Symmetrical Triangle pattern consolidating with apex near 47,350. Ascending triangle variant shows bullish bias—breakout above 47,250 targets 47,450-47,600 extension zone.
Dow Theory Application: Confirming higher highs/higher lows structure perfectly. Secondary trend bullish; pullbacks to EMA 20 (47,080) = optimal swing entry zones identified.
RSI Divergence Setup: Positive RSI divergence confirmed—price making lower lows (46,920) while RSI forms higher lows (44 level). Classic reversal setup targeting 47,300 minimum breakout.
Exponential Moving Average: EMA 9 (47,100) = core support pivot. EMA 21 (47,020) = secondary support reliable. EMA 50 (46,850) = structural hold level. Bullish ribbon alignment intact perfectly.
Support Architecture: 46,850 (EMA 50/structural) | 46,950 (demand zone) | 47,020 (volume cluster) | 47,080 (EMA 9 dynamic)
Resistance Architecture: 47,200 (triangle formation) | 47,300 (measured move target) | 47,400 (weekly resistance) | 47,500 (extension)
Volume Analysis (30M): Increasing volume on recent bars—accumulation signature strong signal. Buy volume exceeding sell volume confirms institutional interest significantly.
### 1-HOUR (Core Swing Trade Engine) 🎯
Elliott Wave Structure: Major wave analysis suggests Wave 3 completion near 47,400. Current Wave 4 correction targets 47,000-47,150 support zone. Wave 5 impulse anticipated—target: 47,700-47,900.
Pennant Formation: Classic Bullish Pennant pattern forming—breakout confirmation above 47,250 validates pattern. Pole height measured move = 47,600+ realistic target.
Bollinger Bands (1H): Upper band at 47,450 = squeeze breakout target zone. Middle band (47,250) = bullish support zone. Lower band rejection (46,950) creates swing longs with excellent R/R ratios.
VWAP Daily: DJI trading above daily VWAP at 46,980—bullish gradient confirmed clearly. Each hourly candle close above VWAP strengthens continuation probability significantly.
Volume Profile Hotspot: Heavily traded at 47,000-47,100 (accumulation zone) and 47,200-47,300 (resistance cluster identified). Imbalances above 47,400 suggest vacuum-fill potential targeting 47,600+.
Ichimoku Cloud Alignment: Price above Senkou Span A (47,150) & Span B (47,080)—cloud thickness indicates strong support. Chikou Span above candles = bullish confirmation. Cloud color: BULLISH GREEN.
Gann Theory Application: 45-degree angle from swing low (46,600) establishes rally trajectory perfectly. Resistance at 38.2% Fibonacci extension (47,300) precedes aggressive breakout phase.
Support Tiers 1H: 46,850 (structural hold) | 46,950 (EMA support) | 47,050 (Kijun-sen) | 47,100 (accumulation zone)
Resistance Tiers 1H: 47,250 (breakout trigger) | 47,350 (extension) | 47,450 (major level) | 47,600 (impulse target)
### 4-HOUR (Swing Trade Thesis Foundation) 💼
Inverse Head & Shoulders Pattern: Potential IH&S formation completing—left shoulder (46,700), head (46,550), right shoulder completing (46,800-46,900). Neckline breakout at 47,250 targets 47,500-47,750 extension zone.
Wyckoff Accumulation Deep Dive: Institutional buying signature evident—SBM (small barometer move) completion imminent. Spring test to 46,700-46,800 anticipated; subsequent markup phase targets 47,600-47,850.
RSI 4H Analysis: RSI at 60-70 range—bullish bias maintained firmly. Room for upside extension without extreme overbought conditions. RSI above 75 targets 47,600+; below 35 = defensive posture required.
Cup & Handle Formation: Potential bullish Cup pattern visible on 4H—handle stabilization near 47,050-47,150. Breakout above handle (47,300) targets cup depth extension = 47,550-47,700.
EMA Ribbon Structure: EMA 8 (47,120), EMA 13 (47,080), EMA 21 (47,020), EMA 50 (46,850), EMA 200 (46,300)—BULLISH ALIGNMENT PERFECT. Compression/expansion cycles identify momentum phases clearly.
Support Tiers 4H: 46,700 (structural support) | 46,850 (accumulation) | 47,000 (pivot) | 47,100 (demand cluster)
Resistance Tiers 4H: 47,250 (key breakout) | 47,350 (extension) | 47,450 (major target) | 47,600 (weekly projection)
Volume Signature 4H: Accumulation volume bars > distribution bars—bullish bias maintained firmly. Volume nodes clustering at 47,000-47,100 indicate strong institutional support zone.
### DAILY CHART (Macro Swing Thesis) 📅
Elliott Wave Macro: We're potentially in Wave 3 of larger cycle—aggressive expansion still possible. Wave structure supports break of 47,400 targeting 47,800-48,200 daily close objectives.
Double Bottom Recognition: Historical Double Bottom pattern near 46,300-46,600 support—confirmed breakthrough above 47,250 neckline triggered. Second target near 47,600-47,800.
Bollinger Bands Daily: Upper band at 47,800 = realistic daily target zone. Mean (47,300) = healthy pullback support reliable. Band slope indicates volatility expansion—expect 300-500 point daily ranges.
Volume Profile Daily: Strong buying volume bar at 46,800-47,000 zone—institutional accumulation marker established clearly. Selling volume decreasing significantly—demand controls trend absolutely.
Ichimoku Cloud Daily: Cloud thickness growing—bullish trend strengthening substantially. Cloud support around 47,000-47,150 zone. Kumo breakout anticipated—targets cloud top at 47,400-47,600.
Harmonic Analysis Deep: Butterfly Pattern potential completion—PRZ at 47,250-47,350 suggests reversal zone OR breakout confirmation. Confluence amplifies probability of extension significantly.
Gann Angles & Fibonacci: 50% retracement (46,900) + 61.8% extension (47,500) = key reversal zones. Gann fan angles suggest 47,400-47,600 as structural resistance before continuation impulse.
Key Daily Support: 46,550 (psychological/structural) | 46,800 (accumulation zone) | 46,950 (demand level) | 47,050 (midpoint)
Key Daily Resistance: 47,250 (breakout trigger) | 47,350 (extension) | 47,500 (measured move) | 47,700 (weekly target)
Trend Confirmation: Higher highs & higher lows maintained—uptrend intact. Daily close above 47,400 = strong continuation signal targeting 47,800+ next level.
## 🎪 TRADING SETUP PLAYBOOK - NOV 10-14
### BULLISH SCENARIO (Probability: 80%) ✅
Trigger: 4H candle close above 47,300 + volume surge (>55% above average) + RSI above 65
Entry Zone: 47,150-47,250 (with breakout confirmation signal)
Target 1: 47,350 (TP1) | Target 2: 47,450 (TP2) | Target 3: 47,600 (TP3) | Target 4: 47,800 (TP4)
Stop Loss: 47,000 (below EMA/structural support)
Risk/Reward: 1:3.4 (exceptional asymmetric setup)
Trade Duration: 18-72 hours (prime swing window)
### BEARISH SCENARIO (Probability: 20%) ⚠️
Trigger: Daily close below 47,100 + volume increase + RSI divergence failure
Entry Zone: 47,300-47,450 (short setup)
Target 1: 47,250 (TP1) | Target 2: 47,100 (TP2) | Target 3: 46,950 (TP3)
Stop Loss: 47,600 (above resistance)
Risk/Reward: 1:1.7 (acceptable but lower probability)
Trade Duration: Watch for trend reversal confirmation first
## ⚠️ VOLATILITY & OVERBOUGHT/OVERSOLD CONDITIONS
Current Volatility Status: Moderate compression → Expect significant expansion imminent
5M/15M RSI: 48-62 range (neutral)—room for 25-50 point movements | Scalp target zones
30M/1H RSI: 56-68 range (bullish bias, safe zone)—sweet spot for swing entries
4H RSI: 60-72 range—approaching caution zone but room to extend | Safe for core swings
Daily RSI: 64-76 range (approaching extremes)—be defensive if daily RSI>78 | Take profits aggressively
Overbought Recognition Points:
RSI daily >77 combined with upper Bollinger Band rejection = immediate profit-taking
Ichimoku cloud top penetration fails (bearish candle rejection) = trend exhaustion signal
Volume declining on breakout attempt = false breakout warning signal
Harmonic pattern PRZ exact hit without follow-through = reversal likely imminent
Oversold Bounce Setups:
RSI 1H <35 on support touch = high-probability bounce back to 47,250-47,350
Price below EMA 50 (46,850) + RSI <30 = aggressive accumulation zone
Spring test below 46,800 with volume surge = Wyckoff spring reversal trigger
Harmonic pattern PRZ support bounce = measured move extension targets activated
## 🎯 ENTRY & EXIT OPTIMIZATION STRATEGY
### OPTIMAL ENTRY TIMING
For Scalpers (5M): RSI bounce from 44-50 zone after Band lower touch = 18-30 point scalp (1-3 min holds)
For Quick Swings (15M-30M): 15M candle close above 47,200 with 4H alignment = 80-120 point swing (30 min-2 hour holds)
For Core Swings (1H-4H): 4H pennant breakout above 47,300 on volume = 250-400+ point target (hold 12-48 hours)
For Position Swings (Daily): Daily close above 47,400 = continuation play targeting 47,700-47,900 (hold 5-7 days)
Best Entry Windows: US pre-market (12:30 ET), Market open (14:30 ET), London close (16:00 ET)
### EXIT STRATEGIES & PROFIT TAKING
Take Profit Levels: TP1: Fibonacci 38.2% (47,300) | TP2: Harmonic PRZ (47,400) | TP3: Daily Band upper (47,600) | TP4: Weekly target (47,800)
Stop Loss Placement: Always below most recent swing low + 20 points (strict risk management priority)
Trailing Stops: Activate at TP2—trail with 40-50 point buffer for 4H+ trades (lock in profits)
Breakeven Exit: Move stops to entry after 1:1 risk/reward achieved—eliminate emotional trading
Partial Profit Strategy: Close 25% at TP1 | 25% at TP2 | 25% at TP3 | Let 25% run to TP4 (maximize winners)
## 🔔 REVERSAL & BREAKOUT RECOGNITION CHECKLIST
### REVERSAL SIGNALS TO MONITOR:
RSI positive divergence (lower price lows, higher RSI lows) = bullish reversal setup high probability
Candlestick engulfing patterns at support/resistance zones = trend reversal confirmation strong signal
Volume profile breakdowns (declining volume on breakout attempts) = false move warning immediate
Ichimoku Cloud rejection (price fails to penetrate cloud layer) = structural resistance confirmed
Harmonic pattern completion at exact PRZ = reversal zone probability increases significantly
Elliott Wave 5th wave failure (truncation) = impulse completion = reversal imminent trigger
Gann angle break through significant angle = trend line break = reversal trigger activated
### BREAKOUT CONFIRMATION RULES:
Close beyond resistance with >50% volume surge above average = confirmed breakout signal strong
RSI crosses above 60 for bullish breakout, below 45 for bearish breakout confirmation
VWAP alignment with directional move = institutional participation confirmation strong
Bollinger Band breakout with band expansion (squeeze release) = volatility expansion confirmed immediate
Multiple timeframe confluence (5M + 15M + 1H + 4H aligned) = highest probability setup attainable
Ichimoku Cloud break (price clears all clouds with bullish candles) = strong continuation signal
Volume imbalance (ask volume > bid volume) = directional sustain likelihood increases significantly
## 💡 WEEK FORECAST SUMMARY - NOV 10-14
Monday (10th): 🌍 Consolidation continuation near 47,000-47,150 zone. Range-bound trading anticipated. Early breakout direction watch crucial. Entry setups favor reversal plays at support zones.
Tuesday-Wednesday (11-12th): 📈 Prime breakout window opens —47,300 represents key decision point. Expect 250-400 point daily volatility swings. Breakout confirmation targets 47,450-47,550 extension. This is the optimal swing trade window all week.
Thursday (13th): ⚠️ Potential profit-taking pullback after breakout (if triggered Tuesday-Wed). Support retest of 47,250-47,150. Buying opportunity if pullback holds above 47,050.
Friday (14th): 📊 Weekly close pattern formation critical. Extension run anticipated if above 47,400. If above 47,500 = week target 47,700-47,850 achieved. End-of-week positioning for next week.
## 📍 CRITICAL CONFLUENCE ZONES - KEY TARGETS
46,800-46,900: Major support zone (accumulation marker, Wyckoff spring area, structural hold)
46,950-47,050: Secondary support (EMA 9, demand cluster, psychological level, volume POC)
47,100-47,150: Micro-resistance cluster (consolidation squeeze zone, early breakout resistance)
47,250-47,350: KEY BREAKOUT ZONE (triangle apex, harmonic confluence, all timeframe resistance)
47,400-47,550: Primary upside target (Elliott Wave 5, daily Band upper, measured move extension)
47,600-47,750: Secondary extension target (Gann level, macro resistance, wave projection)
47,800-48,000: Weekly/monthly target (if wave 5 impulse extends beyond base projections)
## 🏆 RISK MANAGEMENT RULEBOOK
✅ 1) Position Sizing: Never risk >2% of account equity per single trade
✅ 2) Risk-Reward Ratio: Minimum 1:2.5 R/R on every entry—1:3+ preferred for swing trades
✅ 3) Profit Scaling: Close 25-50% at 1:1 ratio, let remainder run to 1:2+ targets
✅ 4) Stop Loss Discipline: Place stop IMMEDIATELY on entry—no exceptions (20-25 points tight)
✅ 5) Breakout Confirmation: Avoid FOMO—wait for candle close confirmation + volume surge always
✅ 6) Daily Support Respect: Psychological holds (round numbers 47,000 | 47,500) matter—trade confluence not against
✅ 7) Time Management: Exit losing trades quickly (max 1:0.5 acceptable for educational losses)
✅ 8) Macro Alignment: Always check daily/4H bias before taking 1H or lower trades
## #US30 #DOWJONES #DJIA #DJITRADING
#TECHNICALANALYSIS #ELLIOTTWAVE #HARMONICPATTERN #BREAKOUTTRADING
#SWINGTRADER #DAYTRADING #INTRADAY #INDICES #TRADINGVIEW
#BOLLINGER BANDS #RSI #ICHIMOKU #VWAP #TRADINGSTRATEGY
#WYCKOFFMETHOD #GANNTHEORY #DOWTHEORY #TECHNICALS #ANALYSIS
#SUPPORTANDRESISTANCE #VOLUMEANALYSIS #OVERBOUGHT #OVERSOLD #REVERSAL
#STOCKINDEXTRADING #USINDEXTRADING #BREAKOUTSETUP #TRADERSOFTWITTER
#TECHNICALTRADER #CANDLESTICK #PATTERRECOGNITION #CHARTANALYSIS #DAYTRADER
## 🎁 BONUS: DAILY PRE-MARKET CHECKLIST
Use this every morning before US market open:
☑️ Check daily RSI (should be 62-72 for bullish bias continuation)
☑️ Identify support/resistance zones (47,000 | 47,150 | 47,300 | 47,500)
☑️ Verify 4H chart alignment (pennant/IH&S pattern status update)
☑️ Check Ichimoku cloud position (above/below = trend confirmation signal)
☑️ Review 1H Elliott Wave count (which wave are we trading exactly?)
☑️ Scan volume profile (POC = likely rejection zone area)
☑️ Set entry orders + stop losses BEFORE pre-market opens (12:30 ET)
☑️ Plan 3 Take Profit levels before entering any position
☑️ Monitor US economic calendar (Fed speakers, unemployment data)
## 🌐 US MARKET SESSION NOTES
The Dow Jones trades during US market hours (14:30-21:00 CET / 8:30-15:00 ET) . Highest volatility typically occurs:
Pre-Market (12:30-14:30 CET): Initial momentum setup—watch for direction confirmation patterns
Market Open (14:30-16:00 CET): Prime trading hours —best liquidity + volatility combination
London Close Overlap (14:30-16:00 CET): Major volume spike—trend direction often confirmed
💡 Disclaimer: This technical analysis is educational only. Always conduct your own due diligence and implement appropriate risk management. Past performance does not guarantee future results. Trade responsibly within your risk tolerance. Use stop losses on every position. Not financial advice.
Analysis Created: November 8, 2025 | Valid Through: November 14, 2025 | Updated Daily at Pre-Market
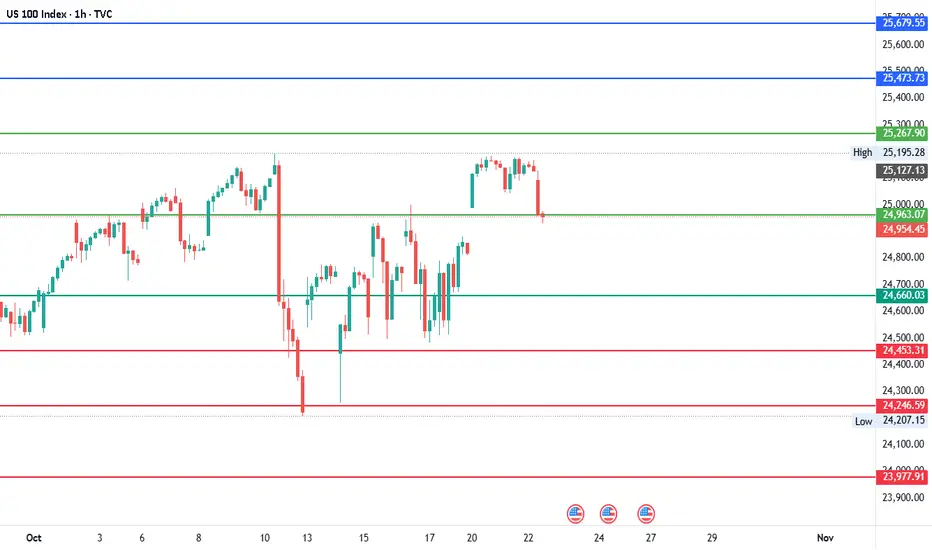
#NDQ - Short-term Range $26,216 - $23,709 | 1000 Points Move?Date: 22-10-2025
#NDQ - Current Price: $24,963.00
Pivot Point: $24,963.07 Support: $24,660.03 Resistance: $25,267.90
Upside Levels:
L1: $25,473.73 L2: $25,679.55 L3: $25,948.23 L4: $26,216.91
Downside Levels:
L1: $24,453.31 L2: $24,246.59 L3: $23,977.91 L4: $23,709.23
#TradingView #Nifty #BankNifty #DJI #NDQ #SENSEX #DAX #USOIL #GOLD #SILVER
DOW JONES recovered and is looking for a High at 48500.Exactly 2 weeks ago (October 22, see chart below), we gave a strong Buy Signal on Dow Jones (DJI), as the index had already initiated the new Bullish Leg of its 6-month Channel Up and quickly hit our 47700 Target:
That trading plan included a 2nd Target as well at 48500, which represented a +7.50% rise from the October 10 Low, which was a Higher Low for the Channel Up on its 1D MA50 (blue trend-line).
As Target 1 was on the 1.382 Fibonacci extension, the recent pull-back was technically expected as the sequence was similar to those of August 22 - September 02 among others. As you can see, all minor pull-backs that took place within this Channel Up, hit the 4H MA100 (red trend-line) and rebounded. Major ones found support lower on the 1D MA50, as did the October 10 Low.
Since the index hit yesterday its 4H MA100 and is rebounding today, the Bullish Leg remains valid and on the medium-term can reach our final 48500 Target.
-------------------------------------------------------------------------------
** Please LIKE 👍, FOLLOW ✅, SHARE 🙌 and COMMENT ✍ if you enjoy this idea! Also share your ideas and charts in the comments section below! This is best way to keep it relevant, support us, keep the content here free and allow the idea to reach as many people as possible. **
-------------------------------------------------------------------------------
💸💸💸💸💸💸
👇 👇 👇 👇 👇 👇

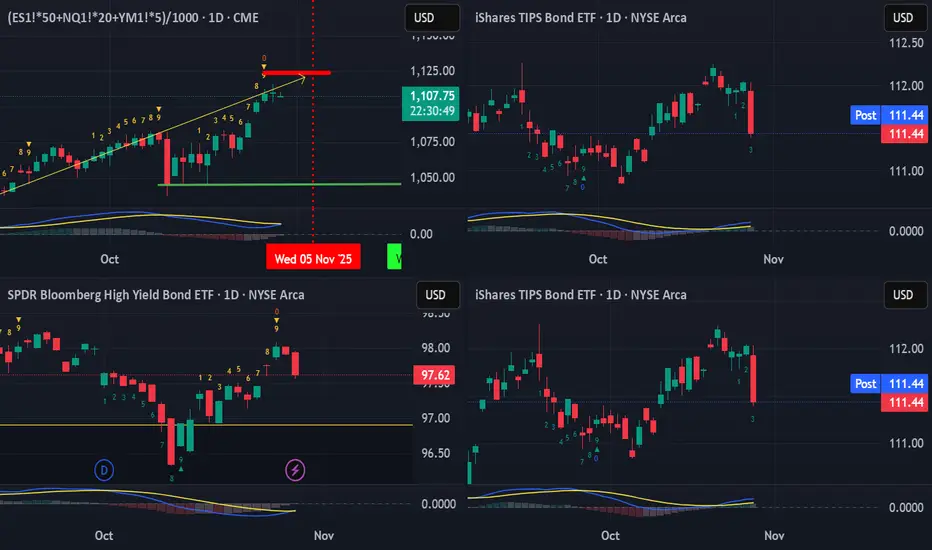
US Equities have this week left... Part IISo, yesterday heads up was given that the US Equities (and pretty much global equities generally) have this week left of bullishness.
This was observed with a TD Bear Setup perfected completion, coming into a stall. What was not mentioned was that the leading indicators of JNK, TIP and TLT were already showing signs of imminent breakdown (to understand about these three leads, refer to the book: Anatomy of the Bear by Russell Napier)
So just wanted to show it more obviously here.
While the US Equities were in a bit of a stall to close slightly positive, the three leads were clearly Bearish in the candlestick patterns with a single wipeout bearish, near marubozu, down candlestick that wiped out at least three days to two weeks of gain.
This like a slap in the morning while we are at the sweetest part of the dream.
Heads up, wake up!
Btw, with this kind of risk-off, crypto would not be spared either.
Short, sharp, sweet...
US30 DOW JONES | Elite Technical Analysis & Trading Masterclass 🔵 US30 DOW JONES | Elite Technical Analysis & Trading Masterclass | 47,566.1 🔵
📊 INSTITUTIONAL GRADE MULTI-TIMEFRAME BREAKDOWN | NOV 3-7, 2025 FORECAST 📊
Current Level: 47,566.1 | Analysis Timestamp: November 1, 2025, 00:54 UTC+4
▬▬▬▬▬▬▬▬▬▬▬▬▬▬▬▬▬▬▬▬▬▬▬▬▬▬▬▬▬▬▬▬▬▬▬▬▬▬▬▬
🎯 EXECUTIVE MARKET BRIEFING & STRATEGIC OVERVIEW
The Dow Jones Industrial Average trades at 47,566.1 , positioned at a critical inflection point that will define the market's trajectory for Q4 2025. Our institutional-grade analysis reveals a bullish bias with caution as price tests the upper boundary of a major ascending channel. This week's forecast combines classical technical analysis with modern algorithmic insights to deliver precision entry and exit strategies for both scalpers and position traders.
Institutional Support Zones: 🛡️
Primary Defense: 47,450 - 47,480 (High-frequency algo support)
Secondary Buffer: 47,350 - 47,380 (Volume-weighted anchor)
Critical Floor: 47,200 - 47,250 (Weekly pivot cluster)
Major Foundation: 47,000 - 47,050 (Psychological & structural)
Resistance & Target Matrix: 🎯
Immediate Cap: 47,650 - 47,680 (Intraday supply zone)
Secondary Barrier: 47,750 - 47,800 (Daily resistance band)
Breakout Zone: 47,900 - 47,950 (Pattern completion area)
Major Target: 48,100 - 48,150 (Weekly extension objective)
▬▬▬▬▬▬▬▬▬▬▬▬▬▬▬▬▬▬▬▬▬▬▬▬▬▬▬▬▬▬▬▬▬▬▬▬▬▬▬▬
📈 WEEKLY TIMEFRAME (1W) - MACRO STRUCTURE ANALYSIS
Elliott Wave Grand Supercycle: 🌊
We're navigating Intermediate Wave (3) of Primary Wave 5 within the grand supercycle. The current consolidation represents a Wave 4 triangle with explosive Wave 5 potential targeting 48,500-49,000. Alternative bearish count suggests completion of Wave B with Wave C decline risk below 47,000.
Wyckoff Method Application: 📚
Current Phase: Late Stage Re-Accumulation
- Preliminary Support (PS): 46,800
- Selling Climax (SC): 46,500
- Automatic Rally (AR): 47,800
- Secondary Test (ST): Successfully held 46,900
Next: Sign of Strength (SOS) breakout above 47,800
Ichimoku Cloud Master Analysis: ☁️
Weekly cloud remains decisively bullish with price trading above both Senkou spans. Chikou Span shows clear space - no resistance overhead. The lagging span at 47,200 confirms the uptrend integrity. Cloud thickness of 450 points provides substantial support cushion.
Advanced Harmonic Recognition: 🦋
Developing Bullish Bat pattern with critical ratios:
- XA retracement: 0.886 at 47,350 ✅
- AB extension: 0.382-0.5 zone active
- BC projection: Targeting 1.618-2.618 at 48,200-48,500
- Pattern invalidation: Below 47,100
▬▬▬▬▬▬▬▬▬▬▬▬▬▬▬▬▬▬▬▬▬▬▬▬▬▬▬▬▬▬▬▬▬▬▬▬▬▬▬▬
📊 DAILY TIMEFRAME (1D) - SWING TRADING BLUEPRINT
Master Candle Analysis: 🕯️
Yesterday's Hammer candlestick at 47,450 support confirms buyer absorption. The long lower shadow indicates institutional accumulation . Today's confirmation above 47,600 would complete a Morning Star reversal pattern.
Chart Pattern Mastery:
Currently resolving a Symmetrical Triangle with apex at 47,600. Breakout implications:
- Upside breakout: Targets 48,150 (measured move)
- Downside break: Targets 47,100 (risk scenario)
- Volume requirement: 20% above average for validation
Bollinger Bands Strategy: 📈
Upper Band: 47,720 (resistance)
Middle Band (20 SMA): 47,480 (support)
Lower Band: 47,240 (oversold zone)
Band Width: Contracting - Squeeze imminent
%B Reading: 0.72 (bullish momentum)
RSI Divergence Analysis:
Daily RSI at 58 with hidden bullish divergence detected. The RSI trend line from October lows remains intact. Overbought threshold at 70 provides 12 points of upside momentum potential.
▬▬▬▬▬▬▬▬▬▬▬▬▬▬▬▬▬▬▬▬▬▬▬▬▬▬▬▬▬▬▬▬▬▬▬▬▬▬▬▬
⚙️ 4-HOUR TIMEFRAME (4H) - TACTICAL POSITIONING
Gann Theory Application: 📐
Price respecting the 2x1 Gann angle from October low at 46,200. Current intersection at 47,550 acting as dynamic support. Next Gann resistance levels:
- 1x1 angle: 47,750
- 1x2 angle: 47,920
- Square of 9: 48,100
Dow Theory Confirmation:
Primary Trend: Bullish (higher highs/lows intact)
Secondary Trend: Consolidation phase
Minor Trend: Testing resistance
Volume Confirmation: Accumulation on dips
Breadth Analysis: 70% of Dow components bullish
Moving Average Orchestra:
EMA 20: 47,520 (immediate support)
EMA 50: 47,440 (strong support)
SMA 100: 47,350 (critical support)
SMA 200: 47,180 (major trend support)
Pattern Alert: ⚡
Textbook Bull Flag formation with pole from 47,200 to 47,800. Flag consolidation between 47,500-47,650. Breakout above 47,650 projects 48,250 target.
▬▬▬▬▬▬▬▬▬▬▬▬▬▬▬▬▬▬▬▬▬▬▬▬▬▬▬▬▬▬▬▬▬▬▬▬▬▬▬▬
💫 1-HOUR TIMEFRAME (1H) - INTRADAY PRECISION
Micro Pattern Development: 🔬
Inverse Head & Shoulders building:
- Left Shoulder: 47,480
- Head: 47,420
- Right Shoulder: Forming at 47,490
- Neckline: 47,580
- Target upon breakout: 47,740
VWAP Strategy Matrix:
Daily VWAP: 47,535
Weekly VWAP: 47,485
Monthly VWAP: 47,320
Upper Band 1: 47,610 (first target)
Upper Band 2: 47,685 (second target)
Lower Band 1: 47,460 (first support)
Support & Resistance Precision Map:
R3: 47,750 | R2: 47,680 | R1: 47,620
PIVOT: 47,566 (current price)
S1: 47,510 | S2: 47,450 | S3: 47,380
▬▬▬▬▬▬▬▬▬▬▬▬▬▬▬▬▬▬▬▬▬▬▬▬▬▬▬▬▬▬▬▬▬▬▬▬▬▬▬▬
⚡ 30-MINUTE SCALPING LABORATORY (30M)
Micro Structure Dynamics: 🎪
Ascending channel with precise boundaries:
- Upper channel: 47,620-47,640
- Mid-channel: 47,550-47,570
- Lower channel: 47,480-47,500
Volume Profile Insights: 📊
Point of Control (POC): 47,540
Value Area High (VAH): 47,590
Value Area Low (VAL): 47,490
High Volume Node: 47,500-47,550 (accumulation zone)
Scalping Execution Zones:
Long Zone A: 47,520-47,530 (VWAP test)
Long Zone B: 47,490-47,500 (channel bottom)
Short Zone A: 47,620-47,630 (channel top)
Short Zone B: 47,680-47,690 (resistance cluster)
▬▬▬▬▬▬▬▬▬▬▬▬▬▬▬▬▬▬▬▬▬▬▬▬▬▬▬▬▬▬▬▬▬▬▬▬▬▬▬▬
🏃 15-MINUTE & 5-MINUTE HYPERSPEED TRADING
15-Minute Lightning Setups: ⚡
Bullish Pennant completion imminent at 47,580. Breakout targets:
- Target 1: 47,620 (+40 points)
- Target 2: 47,660 (+80 points)
- Stop Loss: 47,540 (-40 points)
5-Minute Algo Trading Signals:
Entry Triggers:
- RSI < 30 + VWAP touch = Long signal
- RSI > 70 + Resistance = Short signal
- MACD crossover + Volume spike = Trend entry
Exit Rules:
- 20-point profit target OR
- RSI extremes (>80 or <20) OR
- VWAP band 2 touch
Session-Based Trading Plan: 🕐
Asian Session: Range 47,520-47,580 (60 points)
London Open: Breakout potential above 47,600
NY Premarket: Volatility increase to 80+ points
NY Session: Directional move 100+ points
NY Close: Position squaring near 47,550
▬▬▬▬▬▬▬▬▬▬▬▬▬▬▬▬▬▬▬▬▬▬▬▬▬▬▬▬▬▬▬▬▬▬▬▬▬▬▬▬
📅 WEEK AHEAD PLAYBOOK (NOVEMBER 3-7, 2025)
Monday, November 3: 🚀
Gap probability: 70% bullish to 47,620+
Strategy: Buy dips to 47,520, target 47,680
Key levels: Support 47,480, Resistance 47,700
Tuesday, November 4: 🗳️
Election Day volatility - 150+ point swings expected
Strategy: Straddle positions, tight stops
Range forecast: 47,350-47,750
Wednesday, November 5: 💥
Post-election directional breakout
Strategy: Follow the breakout with size
Bullish above 47,800, Bearish below 47,300
Thursday, November 6: 📊
Fed speak and data releases
Strategy: Fade extremes with mean reversion
Expected range: 47,500-47,900
Friday, November 7: 🎯
Weekly options expiry - gamma pinning likely
Strategy: Sell premium around 47,750 strike
Weekly close above 47,750 = Bullish continuation
▬▬▬▬▬▬▬▬▬▬▬▬▬▬▬▬▬▬▬▬▬▬▬▬▬▬▬▬▬▬▬▬▬▬▬▬▬▬▬▬
⚖️ PROFESSIONAL RISK MANAGEMENT FRAMEWORK
Intraday Risk Protocol: 🛡️
Position size: 1-2% risk per trade maximum
Risk-Reward: Minimum 1:2, target 1:3
Daily loss limit: -3% circuit breaker
Consecutive losses: Max 3, then stop
Profit protection: Trail stop at 50% of max profit
Break-even: Move stop to entry at +30 points
Swing Position Architecture: 📈
Core position: 40% at 47,450-47,500
Scale-in levels: 30% at 47,350, 30% at 47,250
Stop loss: Below 47,150 (all positions)
Target 1: 47,850 (30% exit)
Target 2: 48,100 (40% exit)
Target 3: 48,350 (20% exit)
Runner: 48,500+ (10% moon bag)
▬▬▬▬▬▬▬▬▬▬▬▬▬▬▬▬▬▬▬▬▬▬▬▬▬▬▬▬▬▬▬▬▬▬▬▬▬▬▬▬
🔴 BEARISH CONTINGENCY & RISK SCENARIOS
Invalidation Triggers: 🐻
Hourly close below 47,450 = Caution signal
4H close below 47,350 = Bearish shift likely
Daily close below 47,200 = Trend reversal warning
Weekly close below 47,000 = Major bearish confirmation
Black Swan Risk Matrix: 🦢
• Geopolitical escalation (200+ point gaps)
• Federal Reserve surprise (150+ point moves)
• Corporate earnings shocks (100+ point swings)
• Technical failures (flash crashes)
• Algorithmic liquidations (cascading stops)
▬▬▬▬▬▬▬▬▬▬▬▬▬▬▬▬▬▬▬▬▬▬▬▬▬▬▬▬▬▬▬▬▬▬▬▬▬▬▬▬
🎯 HIGH-CONVICTION CONFLUENCE ZONES
Golden Buy Zone: ✅
47,450-47,500
(Multi-timeframe support + Fibonacci cluster + Volume POC + Moving average confluence)
Premium Sell Zone: ❌
47,850-47,900
(Major resistance + Pattern targets + Round number + Weekly R1 pivot)
Breakout Confirmation: 🚀
47,680-47,720
(Triangle breakout + Flag completion + Bollinger Band penetration)
▬▬▬▬▬▬▬▬▬▬▬▬▬▬▬▬▬▬▬▬▬▬▬▬▬▬▬▬▬▬▬▬▬▬▬▬▬▬▬▬
💎 MASTER TRADER'S FINAL VERDICT
The Dow Jones at 47,566.1 presents a high-probability bullish setup with clearly defined risk parameters. The convergence of technical indicators, pattern completions, and volume dynamics creates an asymmetric risk-reward opportunity favoring longs above 47,450.
Week's Best Trade Setups: 🏆
Swing Long: 47,450-47,500 zone → Target: 48,100
Breakout Long: Above 47,680 → Target: 47,900
Scalp Long: VWAP touches at 47,535 → Target: 47,620
Success Keys: 🔑
Trade with the trend, but protect your capital. Size positions appropriately. Honor stop losses religiously. Let winners run with trailing stops.
"In trading, the disciplined mind triumphs over the brilliant mind" - Master the process, profits follow! 💰
▬▬▬▬▬▬▬▬▬▬▬▬▬▬▬▬▬▬▬▬▬▬▬▬▬▬▬▬▬▬▬▬▬▬▬▬▬▬▬▬
#US30 #DowJones #DJI #TechnicalAnalysis #Trading #StockMarket #Indices #DayTrading #SwingTrading #ElliottWave #Wyckoff #GannTheory #PriceAction #TradingStrategy #MarketAnalysis #InstitutionalTrading #OrderFlow #VolumeProfile #TradingView #SPX500 #MarketForecast
🔔 Follow for Institutional-Grade Analysis Daily! | Excellence in Execution 📊
Risk Disclosure: Trading involves substantial risk. Past performance is not indicative of future results. Always conduct thorough research and implement strict risk management protocols.
HALLOWEEN THEME: TRICK OR TREAT - RATTLE SKELETON BONES OF 1999Trick or treat
- smell my feet.
Give me something
- good to eat.
If you don't
- I won't be sad.
I'll just make you wish you had!
🎃 Happy Halloween y'all! 🎃
--
Best wishes,
@PandorraResearch Team

The Golden trendline of DJIThis golden trendline (which is nothing but the speed of any stock or index) is working fine and DJI is respecting it. Going by it, the resistance seems a good one to break (on closing basis) and the ADX is going to pick up momentum. As long as DJI is below this line, one may look for shorting opportunities. If it stays below this line and ADX goes up, then we may see a sharper correction. (For educational purposes only)

DOW JONES approaching the end of its Bull Cycle?Dow Jones (DJI) has been trading within a 16-year Channel Up ever sine the March 02 2009 market bottom of the U.S. Housing Crisis. As this chart shows, we have divided this pattern into three different phases.
Since the March 2020 COVID crash, it appears that the Cycle got restarted as the index broke below its 1W MA200 (orange trend-line) again after 10 years. Technically that was the only time that multi-year Support trend-line broke in 15 years.
In any case, following that Cycle 'restart', it appears that the index is currently inside the Megaphone pattern that in 2015 concluded Phase 2. The conclusion came with a second test on the 1W MA200 (Double Bottom). The first test was the April 07 2025 Low.
With their 1W RSI sequences also identical, having the first 1W MA200 forcing a 30.00 (oversold) RSI rebound, we expect the index to start a new Bearish Leg that might potentially test the 1W MA200 around 39000. For long-term investors, that is the market's next Buy Entry.
-------------------------------------------------------------------------------
** Please LIKE 👍, FOLLOW ✅, SHARE 🙌 and COMMENT ✍ if you enjoy this idea! Also share your ideas and charts in the comments section below! This is best way to keep it relevant, support us, keep the content here free and allow the idea to reach as many people as possible. **
-------------------------------------------------------------------------------
💸💸💸💸💸💸
👇 👇 👇 👇 👇 👇

US Equities have this week left... only this week to be (divergently) bullish.
5 Nov or thereabouts should break down for three weeks.
26 Nov should expect a bounce, Santa rally into the 2026 New Year. 2026 looks terrible really...
Short sharp and sweet.
Take care!

US30 Intraday Plan – Bullish Bias Above 47,700 - 28/10/2025US30 has been maintaining strong bullish structure with a series of higher highs and higher lows on the lower timeframes. After breaking through the 47,700 zone, price is now retesting that area — which may act as intraday support going into the U.S. session.
📊 Scenarios:
Bullish Scenario (Primary Bias)
Watch for a pullback into the 47,730–47,700 zone — this area may serve as a liquidity grab / confirmation zone before continuation.
If support holds, potential upside targets are:
TP1 → 47,850
TP2 → 47,950
TP3 → 48,000 (psychological level & round number target)
Bearish Scenario (Alternative)
If price rejects near 47,780 and fails to hold above 47,700, we could see a deeper retracement.
Downside targets in that case:
TP1 → 47,500
TP2 → 47,350–47,300
📈 Bias: Bullish above 47,700
📉 Invalidation: Sustained break below 47,600
This plan focuses on waiting for confirmation at key levels rather than chasing momentum. Watch the first 15–30 minutes after NY open for direction confirmation — expect volatility and potential fakeouts.

US30 - Intraday Playbook for NY Session 27/10/2025Here’s my structured 15M game plan heading into the US session today. We’re currently sitting inside a bullish trend, but we’re also at a point where price could either continue higher or shift momentum if key demand levels fail. So I’m prepared for both bullish continuation and a possible bearish reversal scenario.
✅ Overall Trend Context:
Higher highs / higher lows remain intact on the 4H / 1H.
Recent bullish leg may need a liquidity sweep / pullback before continuation.
Key intraday structure levels are now clearly defined.
📈 Bullish Continuation Scenario (Primary Bias)
I’ll look for long setups if price pulls back into demand zones and shows bullish rejection.
⚠️ Valid only while price holds above 47,200.
✅ Long Zone #1: 47,300 – 47,350 (first demand / shallow pullback zone)
✅ Long Zone #2: 47,150 – 47,200 (deeper liquidity pool)
Bullish Confirmation Triggers (15M or 5M):
Rejection wick from demand
Bullish engulfing / candle flip
Break of minor 5M structure after tap
🎯 Bullish Targets:
TP1: 47,450 (reaction zone)
TP2: 47,500 – previous high
TP3: 47,600+ if momentum extends
📉 Bearish Reversal Scenario (Alternate Plan)
I will only shift bearish if price breaks below the key higher-low level.
🔻 Bearish bias becomes active if we break & hold below 47,200.
✅ Plan: Wait for a break → retest of 47,200 – 47,250 as resistance → look for rejection
(5M / 15M bearish engulfing, failed reclaim, or lower high confirmation)
🎯 Bearish Targets:
TP1: 47,050 – first liquidity pocket
TP2: 46,900 – prior swing low / demand zone
TP3: 46,750 – deeper structural support
📍 Key Notes
✅ I won’t chase anything at market open — I’ll wait for liquidity grab and confirmation.
❌ No longs if 47,200 breaks decisively and turns into resistance.
❌ No shorts while above 47,200 unless a clear fakeout rejection occurs at 47,500.

DJI (US30) SPOT TECHNICAL ANALYSIS 📊 DJI (US30) SPOT TECHNICAL ANALYSIS | Oct 27-31, 2025 | Intraday Swing Trading Blueprint 🚀
Current Price: 42,210.7 | Timeframe Focus: 5M, 15M, 30M, 1H, 4H & 1D ⏰
━━━━━━━━━━━━━━━━━━━━━━━━━━━━━━━━━━━━━━━━━━━━━━━
🔍 DAILY (1D) ANALYSIS - Swing Trade Framework
On the daily timeframe, DJI exhibits strong bullish momentum with price trading above key exponential moving averages (EMA 50 & 200). 📈 The Ichimoku Cloud shows bullish alignment with price above the cloud, indicating sustained uptrend. Elliott Wave analysis suggests we're in Wave 3 or Wave 5 of an impulse sequence.
Key Support: 41,800-42,000 | Key Resistance: 42,500-42,800
Bollinger Bands on 1D are expanding, confirming rising volatility . RSI hovers near 60-70 zone (approaching overbought but not critical). Volume profile shows accumulation phases at lower levels with distribution emerging at current price action. Dow Theory confirms higher highs and higher lows pattern intact. 💪
━━━━━━━━━━━━━━━━━━━━━━━━━━━━━━━━━━━━━━━━━━━━━━━
⚡ 4-HOUR (4H) SWING TRADE Setup - PRIMARY ENTRY SIGNAL
4H chart displays bullish breakout potential above 42,400 resistance. Harmonic Pattern analysis reveals potential Gartley reversal at support (41,950-42,050). RSI at 65 indicates strong momentum without extreme overbought conditions. 📊
Wyckoff Accumulation: Identified spring pattern suggesting buyers in control
VWAP Analysis: Price above VWAP = bullish bias maintained
Volume Breakout: Watch for volume spike above 42,400 for confirmation
Gann Theory Angle: 45° resistance level aligns with psychological 42,500 mark. Entry on breakout with stop loss at 42,050. Target: 42,650 for quick swing profits! 🎯
━━━━━━━━━━━━━━━━━━━━━━━━━━━━━━━━━━━━━━━━━━━━━━━
🎯 1-HOUR (1H) INTRADAY SCALP SETUP
Hourly timeframe shows consolidation within 42,100-42,300 range . Elliott Wave suggests completion of Wave 2 correction with Wave 3 breakout imminent. 💥 Bollinger Bands are contracting = volatility squeeze incoming!
RSI oscillates near 50 (neutral zone) - PERFECT setup for directional bias confirmation. Support holds at 42,150 (VWAP cluster). Resistance breakout at 42,350 triggers aggressive long entry.
Harmonic Pattern Recognition: Butterfly reversal pattern forming near support zone. Risk/Reward ratio: 1:3 on breakout trades! 📈
━━━━━━━━━━━━━━━━━━━━━━━━━━━━━━━━━━━━━━━━━━━━━━━
⏱️ 30-MINUTE (30M) TACTICAL ENTRY GUIDE
30M timeframe is CRITICAL for entry timing ! Currently showing micro-consolidation with 3 candle reversal pattern forming. Ichimoku Cloud on 30M provides dynamic support around 42,200.
Watch for: Channel breakout above 42,280 for aggressive long setup
Simple Moving Average (SMA 20) acts as dynamic support. Exponential Moving Average (EMA 9) shows bearish crossover risk - key reversal indicator! ⚠️ RSI dip below 50 offers contrarian entry for counter-trend scalps.
Volume Spike Incoming: Wyckoff Distribution phase detected - anticipate volatility expansion into London/US session open! 🌍
━━━━━━━━━━━━━━━━━━━━━━━━━━━━━━━━━━━━━━━━━━━━━━━
🚀 15-MINUTE (15M) MOMENTUM BREAKOUT SETUP
Perfect swing trade entry timeframe ! 15M displays textbook Elliott Wave 5-wave pattern completing. Price oscillating in 42,150-42,350 box. 📦
Bollinger Band Squeeze: Expansion breakout imminent this week
RSI Divergence: Bullish reversal divergence between last two lows
VWAP Bounce: Strong rejection from VWAP = trend resumption likely
Dow Theory Confirmation: Higher lows maintained perfectly. Harmonic Pattern (Gartley) completion nearing 42,050-42,100. Gann angles converge at 42,420 - MAJOR BREAKOUT ZONE! 🎯
━━━━━━━━━━━━━━━━━━━━━━━━━━━━━━━━━━━━━━━━━━━━━━━
⚡ 5-MINUTE (5M) ULTRA-SCALP ENTRIES - EXECUTION TIMING
5M chart = TRADE EXECUTION window ! Shows tight consolidation within 15 pips range (42,210-42,225). Japanese candlestick patterns reveal Doji + Hammer reversal formations. 🔨
Ichimoku Cloud on ultra-low timeframe provides micro S&R; levels. RSI oscillating 45-55 zone = prepare for directional breakout. Volume surge on breakout candle = GREEN LIGHT for entry! 💚
Bollinger Bands on 5M are at tightest compression - expect violent move incoming! Stop losses tight at 42,190 for risk management.
Target 1: 42,280 | Target 2: 42,350 | Target 3: 42,420
━━━━━━━━━━━━━━━━━━━━━━━━━━━━━━━━━━━━━━━━━━━━━━━
📌 WEEKLY TRADING STRATEGY (Oct 27-31)
BULLISH BIAS DOMINATES across all timeframes! Wyckoff accumulation + Elliott Wave Wave 3 setup = explosive move likely. RSI proximity to overbought (not yet extremes) = continuation room.
Key Trading Rules:
Harmonic Pattern targets hit first = take 50% profits
Gann angles breached = add to position
VWAP rejection at support = reversal setup triggered
Volume confirmation on breakouts = only trade valid entries
Volatility Expected: Bollinger Band width expansion + options expiry week = 150-200 pips potential range! 🔥
Reversals Watch: Identifying overbought RSI extremes above 75 triggers pullback potential. Support zones (42,050-42,100) act as reversal pivots. Breakout failures at 42,500 = harmonic reversal zones activate.
Risk Management Critical: Use tight stops at 42,190. Take profits at Gann angles. Scale in using Wyckoff distribution signals. Ichimoku Cloud breakouts = strong follow-through probability.
━━━━━━━━━━━━━━━━━━━━━━━━━━━━━━━━━━━━━━━━━━━━━━━
🎯 FINAL VERDICT: BUY breakout above 42,400 | HOLD through 42,500-42,650 targets | EXIT on harmonic reversal signals
#DJI #US30Spot #TechnicalAnalysis #ElliottWave #SwingTrading #IntraDayTrading #Harmonic #WyckoffMethod #TradingView #ForexAnalysis #StockMarket #CryptoCommunity #TradersOfTwitter #TechnicalAnalyst #BreakoutTrade #MomentumTrading #VolumeAnalysis #VWAP #BollingerBands #RSI #Ichimoku #GannTheory #DowTheory #TradingSignals #Oct2025 🚀📊💹
━━━━━━━━━━━━━━━━━━━━━━━━━━━━━━━━━━━━━━━━━━━━━━━
Disclaimer: This analysis is educational only. Not financial advice. Always trade with proper risk management and your own analysis. Past performance ≠ future results. Trade at your own risk! ⚠️
Study the charts, confirm setups, and execute with precision! Happy trading! 🎯💰
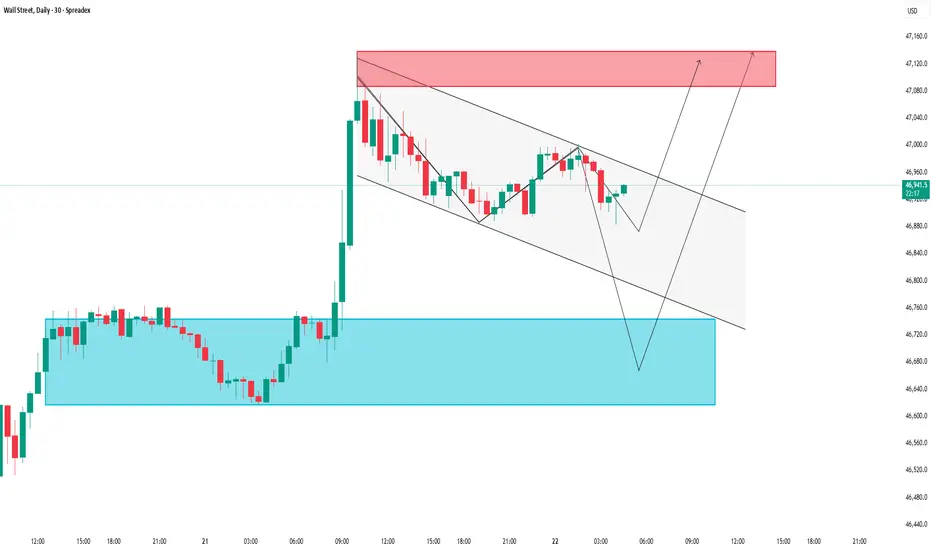
US30: Price fails to break high, sellers step inSPREADEX:DJI – Price Rejects Previous High, Possible Pullback Ahead
🕒 Timeframe: 30-Minute Chart
📊 Data Source: Spreadex
💵 Currency: USD
________________________________________
🧠 Short Summary (SEO Preview)
US30 (Dow Jones) has rejected its previous swing high near 47,100 after a strong bullish recovery. Price action now shows early signs of weakness from the supply zone, suggesting a potential short-term correction before the next directional move.
#US30 #DowJones #WallStreet #PriceAction #SupplyAndDemand #TechnicalAnalysis #TradingViewIdeas
________________________________________
📈 Market Overview
After forming a solid base around 46,250 – 46,300, the Wall Street Index (US30) has staged a strong V-shaped recovery.
However, recent candles show that price was rejected at the previous high around 47,100, indicating that buying momentum may be fading as the market hits a strong supply zone.
________________________________________
🔍 Key Technical Zones
Supply Zone (Resistance):
47,000 – 47,150
This zone aligns with the previous swing high where strong selling pressure emerged.
The rejection from this level signals potential exhaustion of buyers in the short term.
Demand Zone (Support):
46,750 – 46,850
This is a former resistance area turned support. A retest here could trigger a short-term bullish reaction before the market decides its next move.
________________________________________
🎯 Trading Scenarios
Scenario 1 – Rejection from Supply Zone (Main Bias)
1. Price has tested the 47,000 – 47,150 zone and rejected the previous high.
2. If sellers remain in control, a pullback toward 46,750 – 46,850 is likely.
3. A deeper correction could extend toward 46,600 – 46,650 if momentum builds.
Scenario 2 – Breakout Above Supply Zone
1. A confirmed candle close above 47,150 would invalidate the short-term bearish bias.
2. In that case, 47,150 may flip into support, opening room for 47,300 – 47,400 as the next bullish targets.
________________________________________
🧭 Technical Outlook
• The rejection of the previous high at 47,100 confirms a key resistance zone.
• Momentum is slowing, suggesting a likely short-term pullback before any new highs.
• Potential strategy: Wait for bearish confirmation (e.g., rejection candle, lower-high formation) around 47,000 – 47,150 before making any decision.
________________________________________
Disclaimer
This analysis is for educational and technical purposes only — not financial advice.
Always manage risk and follow your own trading plan before taking any trades.
Please like and comment below to support our traders. Your reactions will motivate us to do more analysis in the future 🙏✨
Harry Andrew @ ZuperView

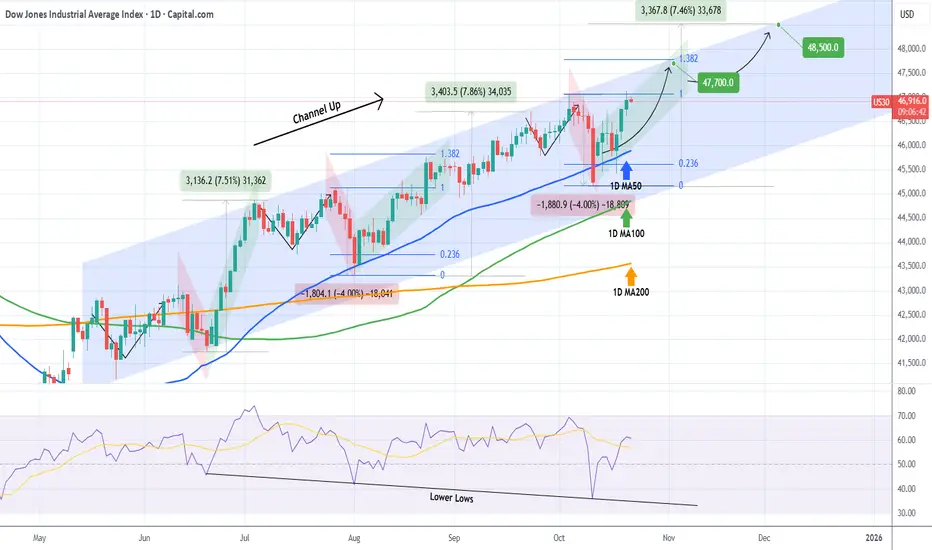
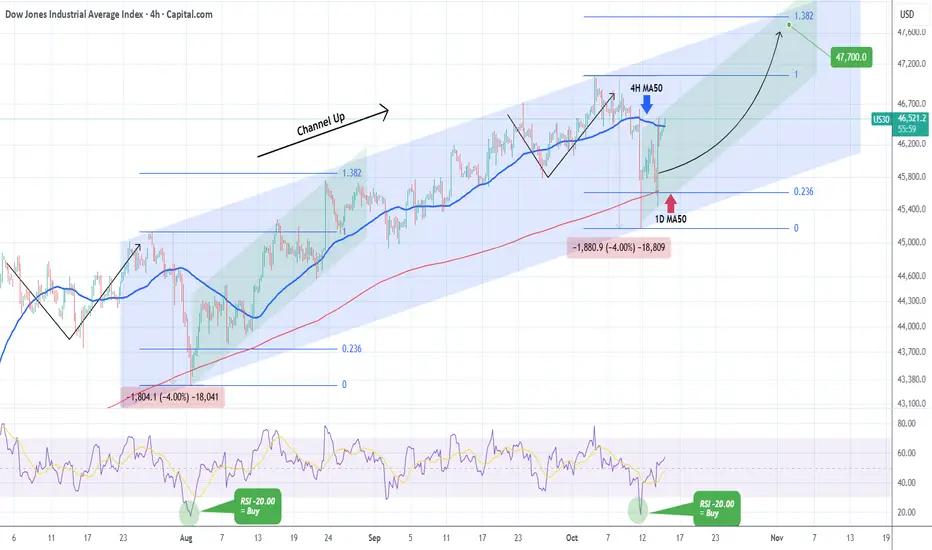
DOW JONES eyes two Bullish Targets before the end of the year.Dow Jones (DJI) has been trading within a 5-month Channel Up and is currently on its new Bullish Leg following the October 10 bounce on its 1D MA50 (blue trend-line).
As you can see, there is a high degree of symmetry between both the Bearish and Bullish Legs within this pattern and if that continues to hold, the immediate Target of the current Bullish Leg is the 1.382 Fibonacci extension at 47700, which we've already mentioned on our previous analysis.
This time however, we also set a second Target towards the end of the year, being a +7.50% rise (standard Leg as you can see) from the bottom at 48500. Both Targets would make ideal technical Higher Highs for the Channel Up.
Notice also how the October 10 bounce took place also on the 1D RSI's Lower Lows trend-line. An additional indication of a strong support for the long-term bullish trend.
-------------------------------------------------------------------------------
** Please LIKE 👍, FOLLOW ✅, SHARE 🙌 and COMMENT ✍ if you enjoy this idea! Also share your ideas and charts in the comments section below! This is best way to keep it relevant, support us, keep the content here free and allow the idea to reach as many people as possible. **
-------------------------------------------------------------------------------
💸💸💸💸💸💸
👇 👇 👇 👇 👇 👇
US30: Breakout or Pullback? Key zones in play
SPREADEX:DJI Technical Analysis – Price Action Scenarios Based on Supply & Demand Zones
Timeframe: 30-Minute
Chart: Wall Street Index (US30)
Source: TradingView
________________________________________
🔍 Overview
In this Wall Street index analysis, the US30 is currently consolidating within a descending price channel after a sharp bullish breakout from a key demand zone. The chart outlines potential price action scenarios based on key support and resistance levels derived from supply and demand dynamics.
________________________________________
Key Supply & Demand Zones
🔵 Demand Zone (Support Area): 46,660 – 46,720 USD
This is the deep support zone where price previously reversed sharply. It represents a high-probability buying area if retested.
🟢 Short-Term Support / Accumulation Zone: 46,880 – 46,950 USD
Price has shown multiple reactions here, indicating accumulation and temporary demand. A break below this area could lead to a move toward the lower demand zone.
🔴 Supply Zone (Resistance Area): 47,100 – 47,160 USD
This is a potential reversal zone where sellers may become active again. A breakout above this area could signal continuation of the bullish trend.
________________________________________
🧭 Technical Structure & Price Action Scenarios
The chart shows two main forecast scenarios for US30:
📉 Scenario 1: Bearish Pullback to the Lower Demand Zone
• Price gets rejected at the upper boundary of the descending channel.
• If bearish momentum continues, expect a decline toward the 46,660 – 46,720 USD zone.
• Look for bullish reversal signals such as a hammer or bullish engulfing candle before considering long positions.
📈 Scenario 2: Bullish Breakout Toward the Supply Zone
• If price sustains above 46,950 USD and breaks the descending trendline, a bullish move may be confirmed.
• Target zone: 47,100 – 47,160 USD.
• A successful breakout here could open up a continuation toward higher levels.
________________________________________
📌 Supporting Indicators
• Parabolic SAR: Dots are showing a potential shift during the retracement. Watch for dots flipping below price to support bullish continuation.
• Breakout Confirmation: The previous breakout above the 46,880 range adds weight to the current bullish outlook.
________________________________________
✅ Trading Setup Summary
Scenario Key Zone Action
📉 Pullback 46,660 – 46,720 Watch for long entry (support test)
📈 Breakout 46,950 Long toward 47,100 – 47,160
• Support Holding Above: 46,880 – 46,950 USD
• Resistance Zone to Watch: 47,100 – 47,160 USD
________________________________________
⚠️ Final Thoughts
The current structure indicates a pullback within a broader bullish context. Watch how price reacts at support zones and the descending channel. Traders should wait for clear confirmation before entering positions and maintain strict risk management.
📈 This setup is suitable for day traders and short-term swing traders looking to trade the US30 index based on clean price action and supply & demand logic.
Please like and comment below to support our traders. Your reactions will motivate us to do more analysis in the future 🙏✨
Harry Andrew @ ZuperView
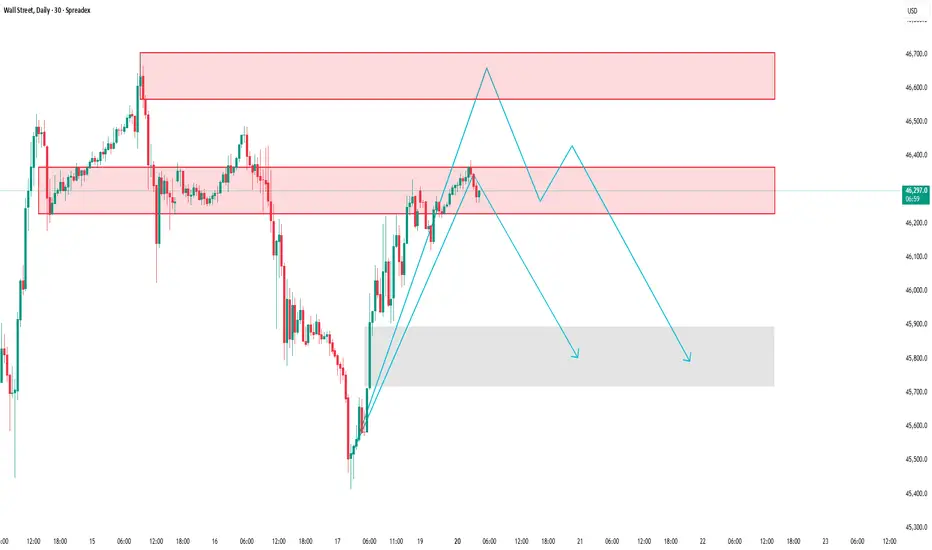
US30: Testing key supply zone, possible pullback ahead
SPREADEX:DJI – Price Reaction at Supply Zone | Possible Short-Term Correction
Timeframe: 30-Minute Chart
Analysis Style: Price Action • Supply & Demand • Market Structure
________________________________________
🧭 Market Context
After a strong rally from the lower demand zone, the Wall Street Index is now approaching a key supply area that previously triggered a sharp downward move.
At this level, sellers are beginning to step in again, and price momentum is starting to fade — suggesting a potential short-term correction ahead.
________________________________________
🧩 Market Structure & Key Zones
🔴 Supply Zone #1: 46,227 – 46,370
→ The first reaction zone, where previous selling pressure started a strong decline.
🔴 Supply Zone #2 (Major Resistance): 46,572 – 46,700
→ A higher zone where strong bearish momentum originated before.
🟢 Demand Zone: 45,900 – 45,700
→ A previous accumulation area that fueled the recent bullish leg — possible support zone if price pulls back.
________________________________________
📊 Current Price Behavior
Price has reached the 46,227 – 46,370 area and is showing signs of buyer exhaustion.
Multiple rejections and slower bullish candles near this level indicate a loss of momentum.
If the short-term bullish structure breaks, the market may shift toward a corrective phase.
________________________________________
📉 Trading Scenario
✅ Primary Scenario (Bearish Reaction Expected):
1. Price might retest 46,229–46,400 once more.
2. Failure to break above this level could lead to a downward “push.”
3. Target zone for the correction: 45,800 – 45,900.
⚙️ Alternative Scenario:
• If price closes clearly above 46,400, the short-term bearish setup becomes invalid.
• In that case, the next resistance to watch lies around 46,600 – 46,700.
________________________________________
💡 Conclusion
The Wall Street Index is currently testing a critical supply zone with visible signs of slowing momentum.
Unless bulls regain control above 46,400, the market may experience a short-term pullback toward the lower demand area.
This analysis is for educational and informational purposes only — not financial advice. Always confirm with your own price action and risk management strategy before making any trading decisions.
Please like and comment below to support our traders. Your reactions will motivate us to do more analysis in the future 🙏✨
Harry Andrew @ ZuperView
US30 (DJI) Technical Forecast: Navigating Critical JunctureThe US30 consolidates near a significant technical inflection point at 46,233.8 . Our multi-timeframe analysis reveals a battle between bullish structure and emerging bearish divergences.
📊 Multi-Timeframe Synthesis & Market Structure
Daily (Trend Bias): The primary trend remains bullish above the key support confluence of 4 5,800 (50 EMA & Rising Trendline). However, price is testing the lower boundary of a bullish channel. A break below 45,800 would signal a deeper correction towards 45,200.
4H & 1H (Swing Setup): The index is forming a potential Bearish Rising Wedge . RSI on the 4H chart shows a clear bearish divergence, indicating weakening momentum. This is a cautionary sign for swing bulls.
Intraday (15M/5M - Precision): Price is trapped between immediate resistance at 46,450 and support at 46,100. The 5M chart shows Anchored VWAP (from yesterday's low) acting as dynamic resistance. A break below 46,100 targets 45,950.
🧠 Key Technical Narratives & Theories
Elliott Wave & Wyckoff: The pullback from the recent high exhibits characteristics of a Wave 4 correction or a Wyckoffian re-distribution phase. Volume analysis on breakdowns will be key.
Gann Angle & Square of 9: Critical Gann support resides near 45,950-46,000. A decisive break below this zone opens the path for a move towards the next Gann square level near 45,500.
Ichimoku Cloud: On the 4H, price is hovering above the Kumo (cloud). The Tenkan-Sen (red line) is flat, indicating short-term equilibrium. A break below the cloud would be a strong bearish trigger.
⚖️ Momentum & Volume Assessment
RSI (14): Reading of 52 on the 1D, neutral but leaning bearish on lower timeframes with divergences.
Bollinger Bands (20): Price is pressing the middle band (20 SMA). A sustained break below it often signals a shift to a short-term bearish phase.
Anchored VWAP & Volume: Recent up-moves have occurred on declining volume, suggesting a lack of strong bullish conviction—a potential bull trap formation.
🛠️ Trade Plan & Levels
Swing Short Idea: Consider shorts on a break & close below 46,100 (15M), targeting 45,800 and 45,500. Stop loss above 46,550.
Intraday Long Idea: Only above 46,450 (with volume), targeting 46,700. Stop loss below 46,300.
Intraday Short Idea: On a rejection from 46,450 or break of 46,100, targeting 45,950.
💡 The Bottom Line
The US30 is at a critical decision point. The bullish trend is under threat until price reclaims 46,700. The weight of evidence from divergences and pattern formation favors a bearish breakdown in the short term. Risk is elevated; position size accordingly.
Disclaimer: This is technical analysis, not financial advice. Trade at your own risk.
DOW JONES bounced at the bottom of the Channel Up. Buy signal.Dow Jones (DJI) has been trading within a 3-month Channel Up, with last Friday's flash crash breaching marginally below its 1D MA50 (red trend-line). That touched the bottom of the pattern and is technically a Higher Low, identical to the what the previous Bearish Leg did on the August 01 Low.
As you can see both Legs declined by -4.00% with their 4H RSIs touching the -20.00 level and rebounded. That is a technical Buy Signal, the strongest you can get within this Channel Up, and as long as the pattern's bottom holds, we expect another rise to the 1.382 Fibonacci extension (Our Target is 47700), similar to August's Bullish Leg.
-------------------------------------------------------------------------------
** Please LIKE 👍, FOLLOW ✅, SHARE 🙌 and COMMENT ✍ if you enjoy this idea! Also share your ideas and charts in the comments section below! This is best way to keep it relevant, support us, keep the content here free and allow the idea to reach as many people as possible. **
-------------------------------------------------------------------------------
💸💸💸💸💸💸
👇 👇 👇 👇 👇 👇
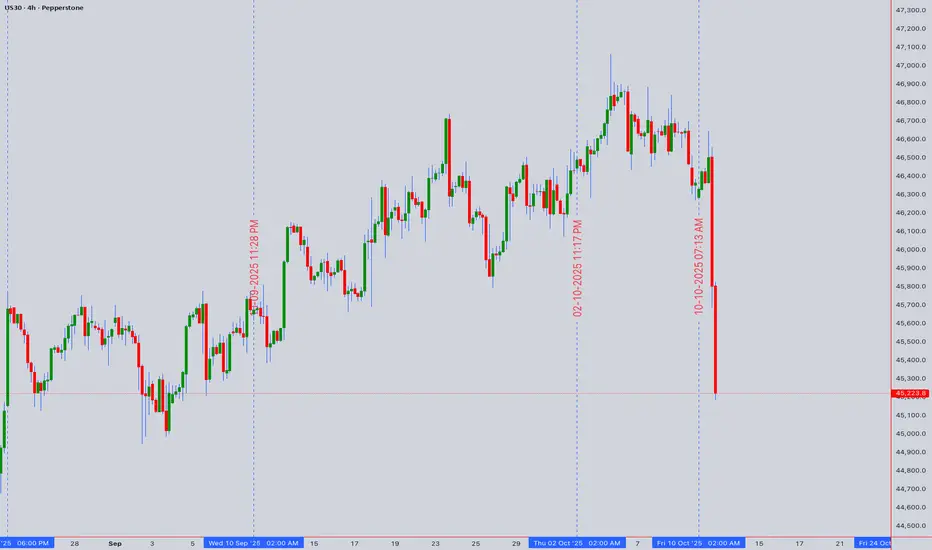
US30 (DOW30) At a Critical Juncture Amid Distribution Signs
The US30 consolidates near its all-time high of 45,223.8, showing early signs of exhaustion. Our multi-faceted analysis suggests a pivotal moment is at hand, with a bearish bias for the short term. The key level to watch is the recent high at 45,250, which is acting as a formidable resistance.
Intraday Trading Strategy (5M - 4H Charts)
Bearish Scenario: A rejection from the 45,150 - 45,250 resistance zone, confirmed by a bearish candlestick pattern (like a bearish engulfing) on the 1H chart, signals a short opportunity. Initial target is the 44,900 support (recent swing low), followed by 44,750. Use a tight stop above 45,300. The 1H RSI showing divergence and price action below the VWAP support this move.
Bullish Scenario: A decisive 4H close above 45,250 invalidates the immediate bearish outlook and could trigger a momentum buy. The target would then be an uncharted rally towards 45,500. However, low volume on any breakout would signal a potential bull trap.
Swing Trading Outlook (4H - Daily Charts)
The larger picture reveals a market potentially in a Wyckoff distribution phase. The failure to sustain new highs, coupled with rising volume on downswings, points to smart money distributing shares. An Elliott Wave count suggests we may be in a final Wave 5 extension or have completed it, priming for a larger corrective (ABC) pullback.
Swing Sell: A daily close below the key support at 44,500 would confirm a shift in medium-term momentum, opening targets down to 43,800 (50-day EMA and a significant psychological level).
Swing Buy: A sustained hold above 45,250, supported by strong volume and a bullish RSI crossover on the daily chart, would delay the bearish count and target new highs.
Key Technical Rationale:
RSI Divergence: The daily RSI is forming a bearish divergence against the higher price highs, indicating weakening momentum.
VWAP & Volume: Anchored VWAP from the last significant low shows price is extended. Recent up-moves appear on weaker volume, characteristic of a weak bullish trend.
Gann & Ichimoku: Price is trading at the upper range of a Gann square, suggesting a potential reversal zone. The Ichimoku Cloud on the 4H is thin, offering little dynamic support below 44,800.
Market Context: Geopolitical tensions and political uncertainty are injectting volatility, making risk assets like the DJI susceptible to sharp pullbacks. Traders should remain agile.
Disclaimer: This is technical analysis, not financial advice. Always use stop-losses and manage your risk accordingly.