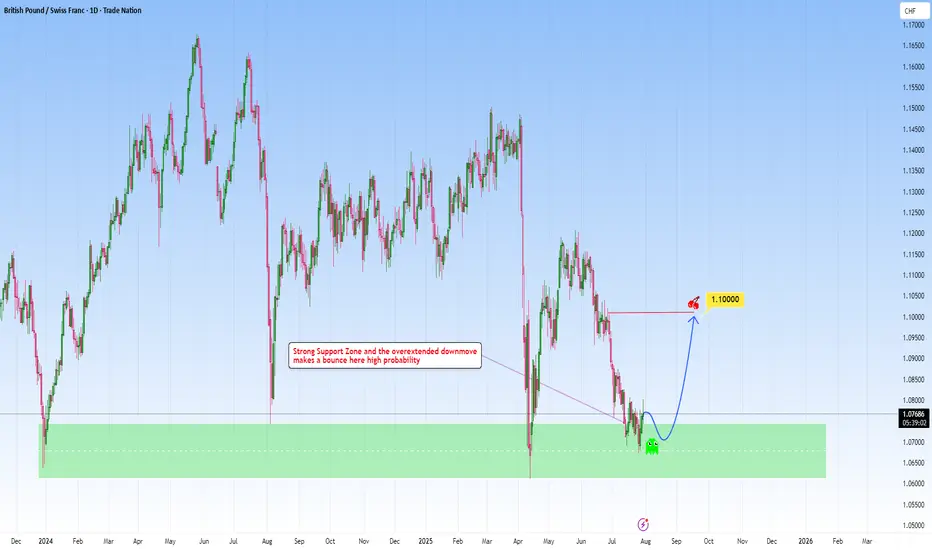
GBPCHF meets strong support: A reversal here is high probabilityLooking at GBPCHF and how it fits within my approach to structure-based trading, this one is really speaking my language.
Price has come down into a key higher-timeframe support zone: a zone that’s proven itself multiple times in the past. Now, price has shown some initial rejection there, making my long position towards 1.1000 a clear, rational target.
What makes this setup different could be the patience behind it. As we let the market complete its downward leg, waited for price to revisit a reliable zone, and now anticipating a bounce back. It’s a move that I’ve captured across my previous charts again and again.
Let me know in the comments what you think
Disclosure: I am part of Trade Nation's Influencer program and receive a monthly fee for using their TradingView charts in my analysis.
Daily Charts
119.15-119.70K to watch for Long tradeMorning folks,
So, Thu setup is done perfect. Jump precisely from K-support area of 118.30 that we discussed. But, BTC has reached just minor 1H target and now is moving down. Since overall upside impulse is not bad, we consider ~119.5K support area for bullish momentum trade for now...

118.5K and 120K For Long EntryMorning folks,
Not too much to say now. Most important thing - BTC was able to stay above vital 110-112K support. So the upside reversal that we traded last two weeks with minimal target around 116K was correct. Now BTC stands much higher, but in a moment when we started the trade - it was impossible to say.
Now we're watching two support areas of 120K and 118.5K for potential long entry. Nearest upside target is 127K
Take care.

BTC cares US liquidity risks in AugustMorning folks,
So, in general as you can see our upside AB=CD that we discussed last time is working. But...
as you know BTC is strongly related to liquidity dynamic on US domestic system. This month Mr. Bessent wants to re-finance 1Trln in debt, with net borrowing around 250 Bln. Hardly BTC will get a small chunk of this funds.
it means that the volatility could rise significantly in nearest 1-2 weeks with downside price gravitating. Overall action looks rather heavy. Maybe BTC somehow will complete AB=CD target around 116.20-116.25K, but now this action looks like retracement - no thrust, slow action a lot of overlapping candles. So lows might be re-tested or even broken.
In current situation we think it would be better to not take any new longs and watch for clarity. If you have position already - move stops to breakeven.

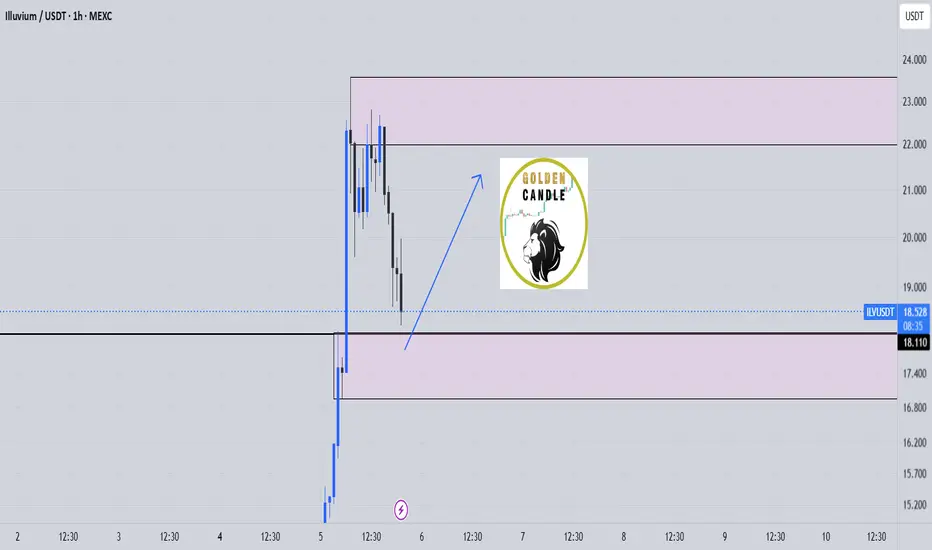
ilv buy midterm"🌟 Welcome to Golden Candle! 🌟
We're a team of 📈 passionate traders 📉 who love sharing our 🔍 technical analysis insights 🔎 with the TradingView community. 🌎
Our goal is to provide 💡 valuable perspectives 💡 on market trends and patterns, but 🚫 please note that our analyses are not intended as buy or sell recommendations. 🚫
Instead, they reflect our own 💭 personal attitudes and thoughts. 💭
Follow along and 📚 learn 📚 from our analyses! 📊💡"
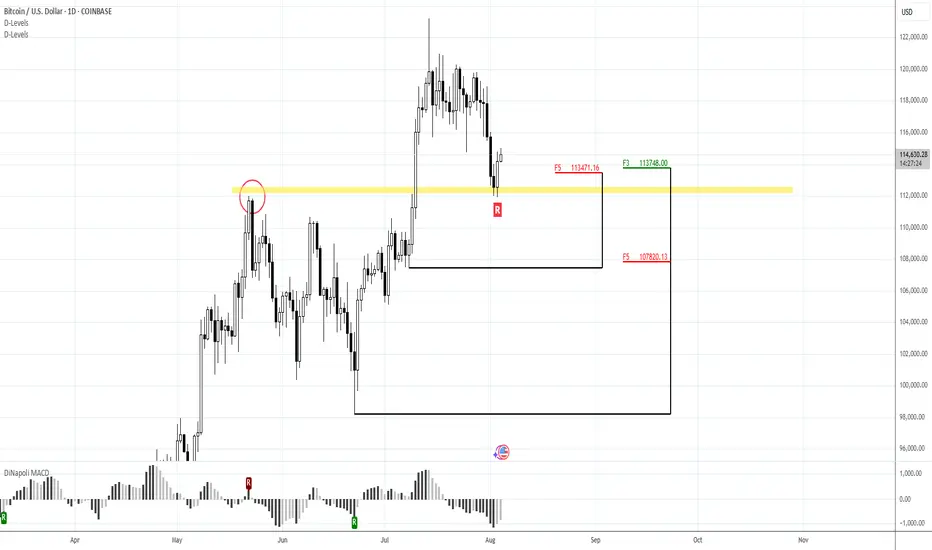
Watching for intraday BTC bounce firstMorning folks,
So, neither NFP data nor technical picture helped BTC to stay above 117. While US Treasury is started drain liquidity and borrow (they need 1 Trln this month), sending ~ 150 Bln to its TGA account with the Fed - BTC got hurt.
Now price stands at vital area - previous tops. If BTC will drop under 110K, collapse could start. Let's hope that this will not happen...
Meantime, we're at 112-113K support. We already talked about it before. Here we have reversal bar and bullish engulfing pattern, so maybe we could get a bit higher pullback on intraday chart. 113.8 and 113.1K support areas on 1H TF might be considered for long entry. Invalidation point for this plan is the low of engulfing pattern.
AUDUSD: Bearish Continuation from broken supportThe current setup is a clean example of a trend continuation play. Price recently broke decisively below a structure zone, this break and retest now flips the narrative, what once was a buy zone is now an opportunity for short entries.
Following the aggressive move down, price now began pulling back into that broken zone. The move appears corrective rather than impulsive, characterized by a slower, more rounded structure typical of pullback leg. This is classic behavior in continuation setups: fast drop, slow retrace, and then potential for the next leg lower.
The projected move targets a retest of the swing low at 0.63800. That level is significant, it's a level where prior demand reacted strongly and now it serves as the next probable magnet for price.
What makes this continuation trade high probability is the sharpness of the prior bearish impulse as it signals intent. The market seems to be in a controlled bearish sequence, where sellers dominate momentum and retracements offer fresh entries for trend followers.
The structure and zone alignment all point in the same direction continuation lower, not reversal.
Let me know in the comments what you think
Disclosure: I am part of Trade Nation's Influencer program and receive a monthly fee for using their TradingView charts in my analysis.

Head & Shoulders on EUR/USD daily!We're currently observing a significant Head & Shoulders pattern forming on the EUR/USD daily chart, with the price just breaking below the neckline on the right shoulder.
Applying standard Head & Shoulders trading principles, we measure the distance from the head's peak to the neckline and project that same range downward from the breakdown point. Based on this, the estimated target price (TP) for the trade lands around $1.135. The stop-loss will be positioned just above the right shoulder to manage risk effectively.
We'll be watching closely to see how this setup unfolds. 🍻

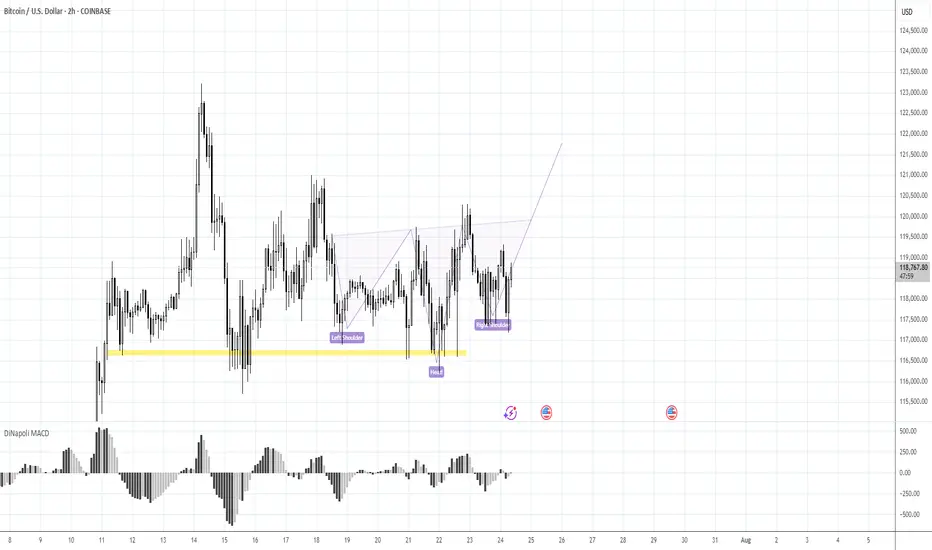
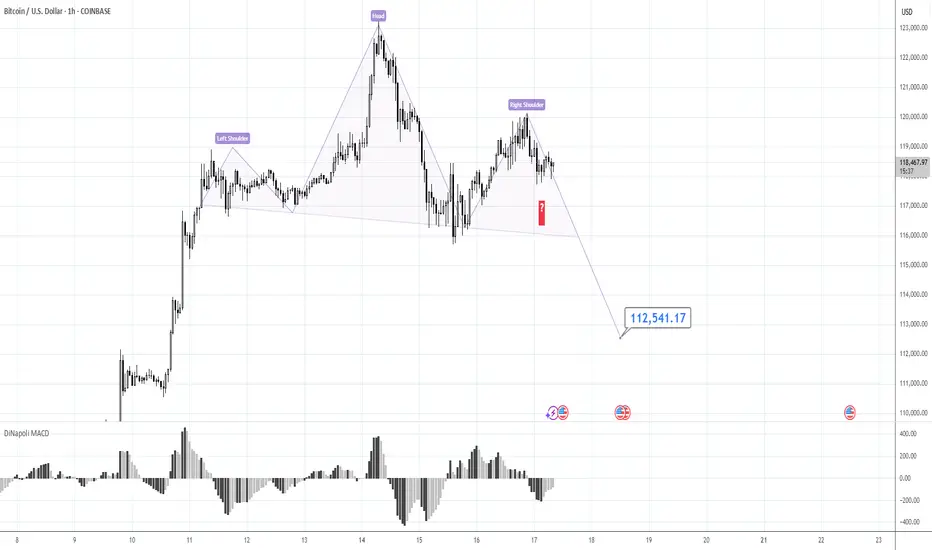
Keep following to the H&S PatternMorning folks,
To be honest, not too many things to talk about. We've prepared our scenario with H&S is still valid. Reaction to GDP numbers was quite welcome as it set the right arm's bottom. The only thing that we have to be busy with is to control its validity - reaching of the neckline and price standing above 116 lows and right arm.
At the first signs that market is start falling back - do not take any new longs. H&S failure is also the pattern and in this case we get deeper correction. But daily chart still makes me think that bullish context is here
Sell the Rip? AUDUSD Retest Zone AlertHello TradingView Family / Fellow Traders. This is Richard, also known as theSignalyst.
📈AUDUSD has been overall bearish , trading within the falling red channel and it is currently retesting the upper bound of the channel.
Moreover, it is rejecting a structure marked in blue.
📚 As per my trading style:
As #AUDUSD approaches the red circle zone, I will be looking for trend-following sell setups on lower timeframes. (like a double top pattern, trendline break , and so on...)
📚 Always follow your trading plan regarding entry, risk management, and trade management.
Good luck!
All Strategies Are Good; If Managed Properly!
~Rich
Disclosure: I am part of Trade Nation's Influencer program and receive a monthly fee for using their TradingView charts in my analysis.

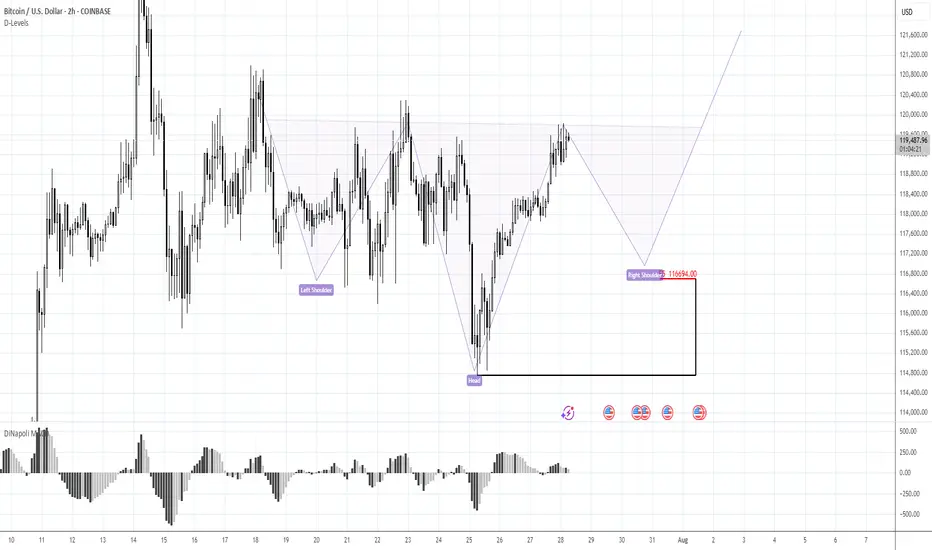
BTC 116.70K stands in focusMorning folks,
Once we've prepared the analysis, we've got upsetting squeeze down, thanks to Galaxy massive sell-off. I don't know what they were trying to do - either hunted for stops under 116K, or just sold in most unwelcome moment... but unfortunately such an issues are out of our control.
For now - BTC totally reversed this sell-off and once again shows positive sentiment. Now we consider same reverse H&S pattern, but this time of a bigger scale. 116.70K support area, where, the right arm should be formed now stands in our focus for long entry. We consider no shorts by far. Hopefully no more tricks will follow from old Donny or somebody else...
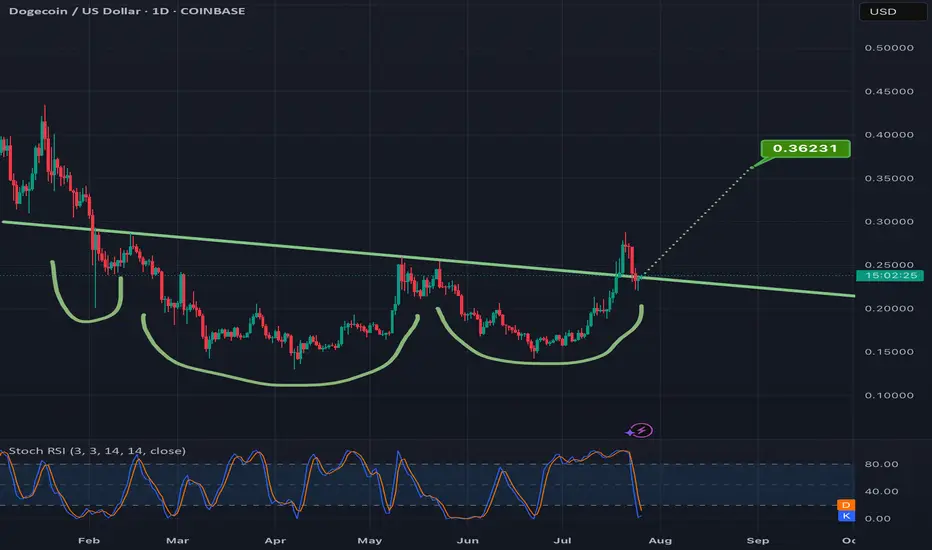
Confirming the breakout of this invh&s on doge can = 50% gainsAlready went above the neckline once and the current daily candle is currently back above the neckline for a second time. Hitting the full target would mean a good 50% gain from current price. *not financial advice*
CADJPY - The Bulls Are Stronger than Ever!Hello TradingView Family / Fellow Traders. This is Richard, also known as theSignalyst.
📈CADJPY has been overall bullish trading within the rising wedge pattern marked in red.
This week, CADJPY has been retesting the lower bound of the wedge.
Moreover, the green zone is a strong weekly support.
🏹 Thus, the highlighted blue circle is a strong area to look for buy setups as it is the intersection of the lower red trendline and green support.
📚 As per my trading style:
As #CADJPY approaches the blue circle zone, I will be looking for trend-following bullish reversal setups (like a double bottom pattern, trendline break , and so on...)
📚 Always follow your trading plan regarding entry, risk management, and trade management.
Good luck!
All Strategies Are Good; If Managed Properly!
~Rich
Disclosure: I am part of Trade Nation's Influencer program and receive a monthly fee for using their TradingView charts in my analysis.

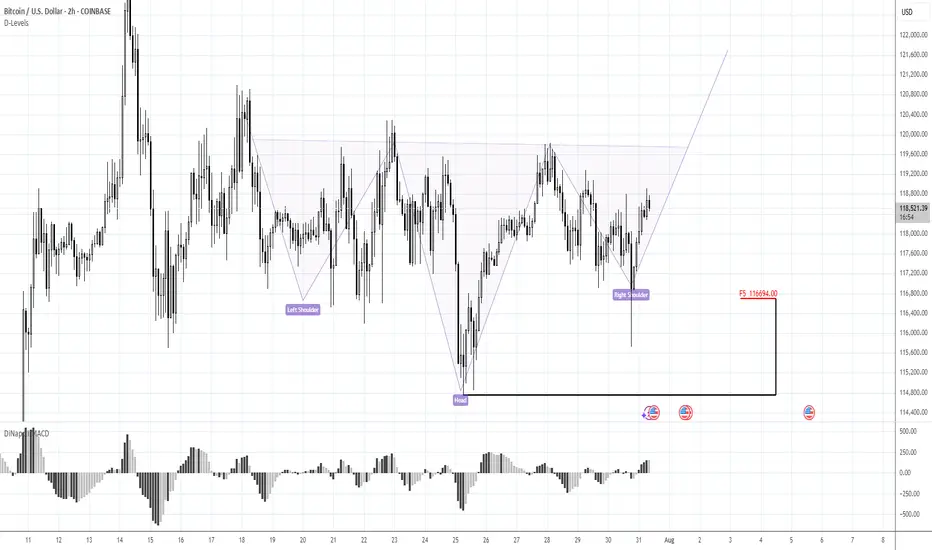
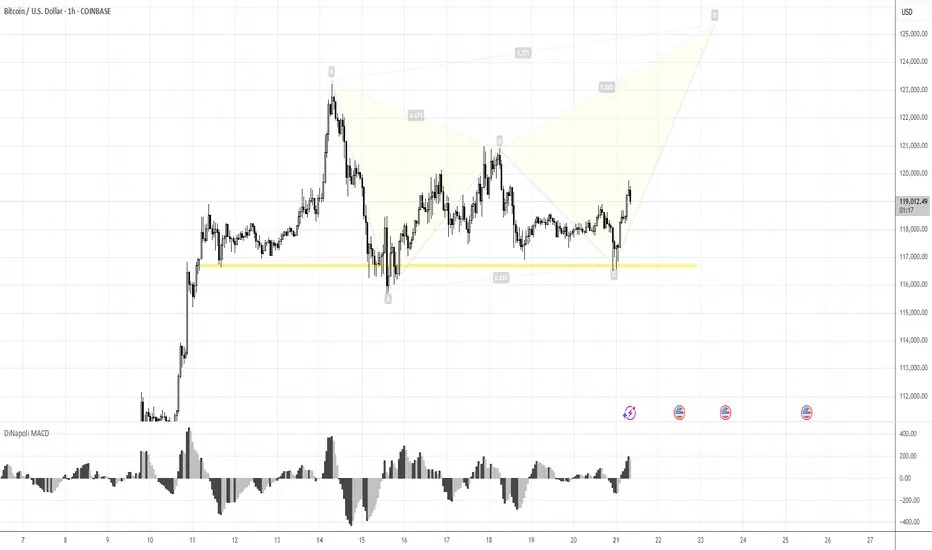
BTC Ready to Start to 125KMorning folks,
Better if you combine this update with previous idea. Now it seems that BTC stands in swamp action, flirting around 116K, which might be looking a bit bearish.
But by our view, this is not quite so. First is, triangle patterns as on daily chart as on 4H chart are look great and quite bullish. Pay attention that on 4H chart all sell-offs were bought out.
Our 1.16 lows that we set as vital ones for this scenario area still intact. So, it means that butterfly with 125K target that we discussed last time is also intact. I would say more. If you take a careful look at 1H chart - you could recognize reverse H&S pattern that could trigger all this stuff. It means that we're not in swamp, but at the point where the decision on long entry has to be made...
Take care
S.
GBPAUD - Trading The Range - AGAIN!Hello TradingView Family / Fellow Traders. This is Richard, also known as theSignalyst.
📈GBPAUD has been hovering within a big range.
Last week, as per our previous analysis, GBPAUD rejected the upper bound of the range and traded lower.
This week, GA is retesting the lower bound of the range acting as a support.
As long as the support holds, we will be looking for longs on lower timeframes, targeting the upper bound of the range.
📚 Always follow your trading plan regarding entry, risk management, and trade management.
Good luck!
All Strategies Are Good; If Managed Properly!
~Rich
Disclosure: I am part of Trade Nation's Influencer program and receive a monthly fee for using their TradingView charts in my analysis.

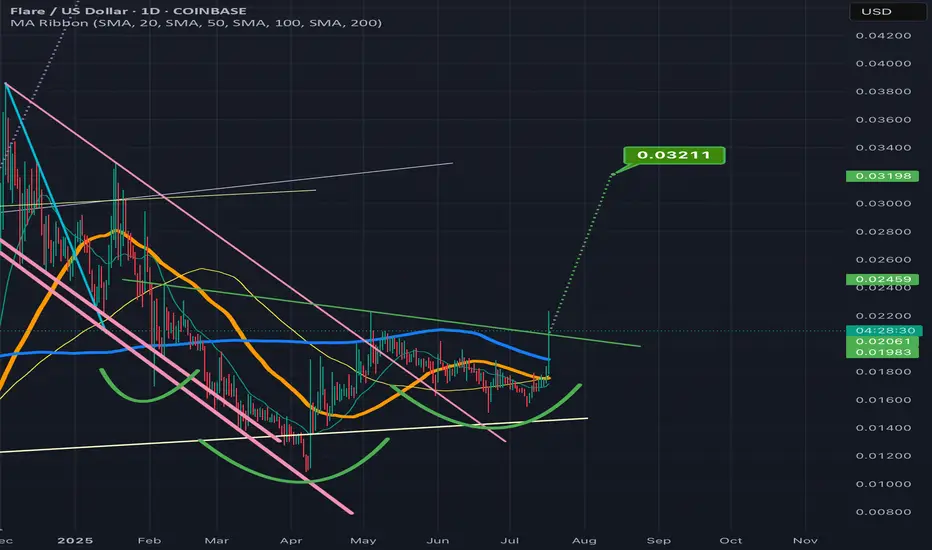
FLRUS breaking above the invh&s necklineNice it confirms the breakout the target is around 3 cents. Could always dip back below the neckline a time or two before that happens, but considering how it feels lke we are finally confirming an altseason here with bitcoin dominance taking a big dump probability highly favors an eventually validation of this breakout on flr. *not financial advice*
Risk 116. Target 123-125KMorning folks,
Prior 1H H&S was done, we were watching on 120K resistance area, as we said last time. Now, on 1H chart H&S is showing signs of failure - too extended right arm, no downside breakout. Price is taking the shape of triangle . All these signs are bullish. Because butterflies very often appear on a ruins of H&S, we suggest that this one could be formed here...
The risk level for this scenario is 116K lows - BTC has to stay above it to keep butterfly (and triangle) valid, otherwise, deeper retracement to 112K area could start.
Upside target starts from 123K top and up to 125K butterfly target.
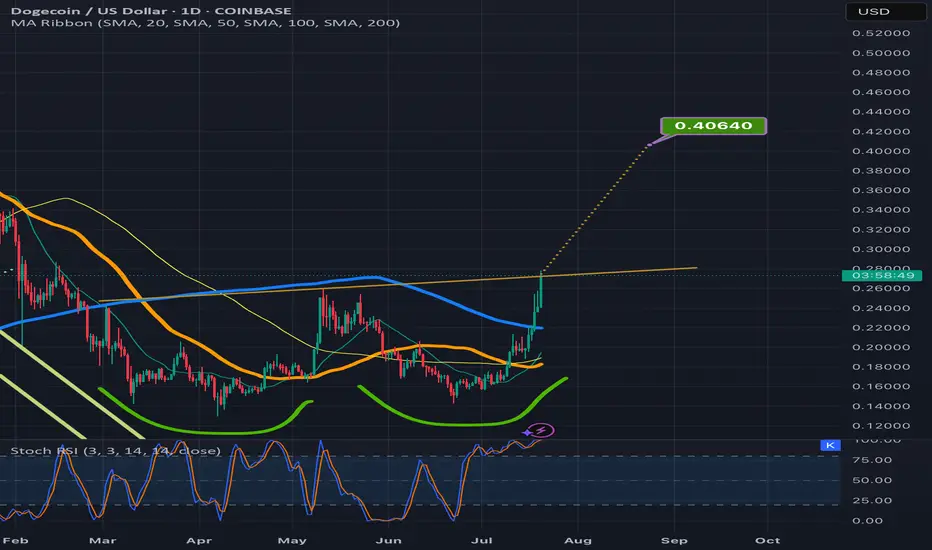
Doge inching above the double bottom necklineIt could easily dip back below the neckline a tie or two before it validates the breakout but definitely getting closer to doing so. Target is around 40-41cents. *not financial advice*
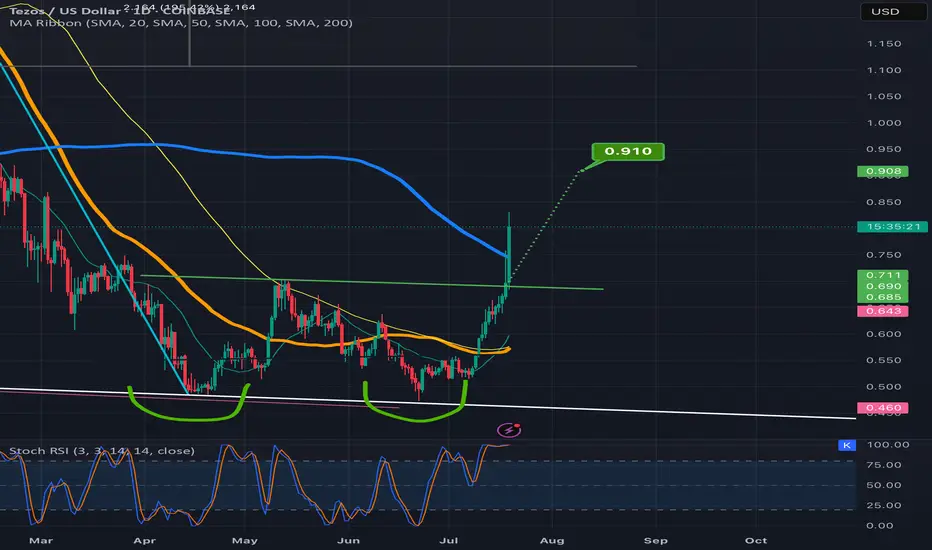
Tezos heading for a double bottom breakout targetPrice action is well above the neckline and already over halfway to the target. *not financial advice*
120K is the Key.Morning folks,
Our last plan worked perfect - market re-tested 117K support and jumped out. If you have longs - you could keep it.
We consider now two alternative scenarios, although we think that this one with triangle is more probable, we do not exclude the H&S shape on 1H chart that could lead BTC down to 112-113K support area.
So, if you do not know how to deal with this - keep an eye on the 120K area and top of the right arm. Upside breakout will confirm H&S failure and triangle scenario. Otherwise, until market stands under 120K - consider H&S as a basic scenario, just for safety.
Take care, S.
The daily chart for total2 to look at the impending golden crossWanted to also post a daily chart tie frame of my previous idea. I first posted it in weekly to fit the entire cup and handle breakout target in the frame, but wanted to also post the daily time frame to provide both a close up of the inverse head and shoulders pattern as well as the impending golden cross on the daily time frame. Loos very likely that alt season may finally be approaching here. Gonna pay close attention to both this chart and the bitcoin dominance chart btc.d to know for sure. *not financial advice*

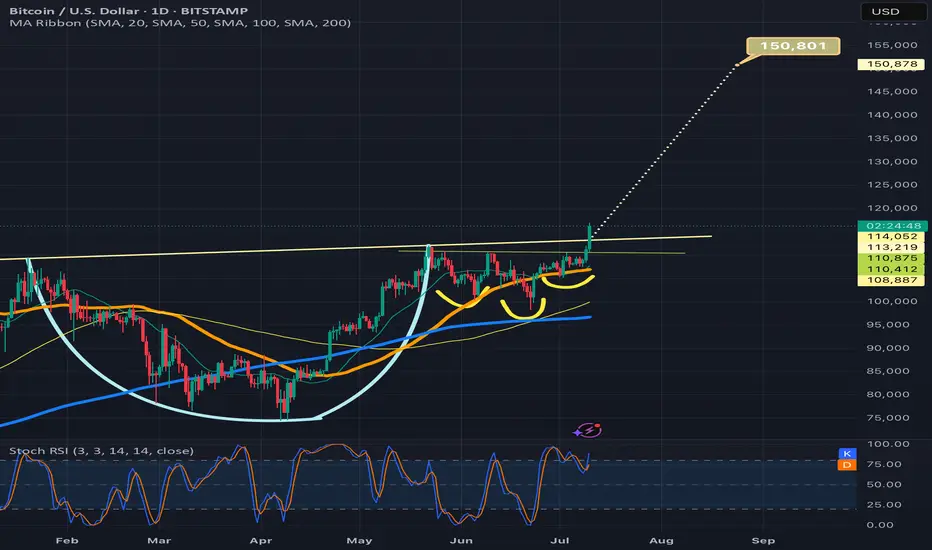
Btcusd breaking above cup and handle necklineIf it confirms the bullish breakout the target is 150k. Also by breaking above 116k and solidifying that level as strong support, we will trigger an even bigger inverse head and shoulders pattern (not shown here) with a breakout target around 208k! I will provide a link below to the chart I posted of that pattern. Thanks for reading, liking, and following. *not financial advice*
SUI on its way to the teal pennants breakout targetSui has joined the bullishness here as it has brown up from the pennant and well on its way to the target. *not financial advice*
