USDCAD: A Sell Opportunity You Can't MissLooking at the USDCAD chart, we can see that price is moving within a descending channel with lower highs. Currently, price is testing the upper boundary of this channel. In the past, sellers have successfully defended this level multiple times, and the current market structure suggests we may see another rejection here.
If that happens, setting up a short position would be straightforward. Our target would be around 1.38150, a reasonable objective based on this setup, where a price retracement or even a strong decline could occur. The current trend remains bearish, and in descending channels like this, going with the trend is generally a better strategy than fighting it.
Until buyers convincingly break this descending channel, sellers remain in control, and the opportunity to trade with the trend is still very clear.
Do you see it this way as well?
Dailyanalysis

Gold 1H – Inflation Fears & Risk Flows Drive MomentumGold on the 1H timeframe is trading around 3,753 after repeated BOS confirmations, showing strong bullish structure but facing premium resistance. Liquidity remains stacked above 3,787–3,785, while discount demand zones sit lower at 3,725–3,723 and deeper at 3,688–3,686.
Today’s headlines on sticky U.S. inflation expectations and renewed geopolitical tensions in Eastern Europe are fueling safe-haven demand, but intraday structure suggests engineered sweeps into resistance before retracement into demand zones.
________________________________________
📌 Key Structure & Liquidity Zones (1H):
• 🔴 SELL SCALP 3,787–3,785 (SL 3,794): Premium resistance where liquidity sweeps may trigger short-term rejections targeting 3,780 → 3,775 → 3,770.
• 🟢 BUY ZONE 3,725–3,723 (SL 3,718): Pullback entry aligned with BOS structure, offering upside targeting 3,740 → 3,755 → 3,770+.
• 🟢 BUY ZONE 3,688–3,686 (SL 3,680): Deeper discount demand, attractive for dip buys targeting 3,700 → 3,715 → 3,730+.
________________________________________
📊 Trading Ideas (Scenario-Based):
🔺 Buy Setup – Pullback Entry (3,725–3,723)
• Entry: 3,725–3,723
• Stop Loss: 3,718
• Take Profits:
TP1: 3,740
TP2: 3,755
TP3: 3,770+
🔺 Buy Setup – Discount Demand (3,688–3,686)
• Entry: 3,688–3,686
• Stop Loss: 3,680
• Take Profits:
TP1: 3,700
TP2: 3,715
TP3: 3,730+
🔻 Sell Setup – Liquidity Run (3,787–3,785)
• Entry: 3,787–3,785
• Stop Loss: 3,794
• Take Profits:
TP1: 3,780
TP2: 3,775
TP3: 3,770
________________________________________
🔑 Strategy Note
With inflation concerns heating up and geopolitical risks sustaining safe-haven flows, the broader trend remains bullish. Smart money may engineer stop-runs into premium resistance before retracements into discount zones. Focus on buy-the-dip opportunities at well-defined supports, while fading liquidity sweeps cautiously near 3,787–3,785. Expect intraday volatility as markets react to U.S. inflation chatter and risk-off headlines.

Gold 1H – Should We Hold or Fade Liquidity at 3800?Gold on the 1H timeframe is trading near 3,776 within a corrective channel, with premium liquidity stacked above 3,800–3,798 and discount demand waiting at 3,725–3,727. Recent BOS structures confirm bullish intent, but engineered sweeps into premium zones remain likely before retracements to discount levels.
Today’s headlines on the Federal Reserve’s cautious tone and Middle East geopolitical tensions are reinforcing safe-haven demand, though intraday moves may produce liquidity grabs before directional clarity emerges.
________________________________________
📌 Key Structure & Liquidity Zones (1H):
• 🔴 SELL GOLD LIQUIDITY 3,800–3,798 (SL 3,807): Premium resistance where sweeps may trigger rejection toward 3,770 → 3,760 → 3,755.
• 🟢 BUY ZONE 3,725–3,727 (SL 3,720): Discount demand aligned with BOS, offering upside targets at 3,740 → 3,760 → 3,775.
________________________________________
📊 Trading Ideas (Scenario-Based):
🔻 Sell Setup – Liquidity Run (3,800–3,798)
• Entry: 3,800–3,798
• Stop Loss: 3,807
• Take Profits:
TP1: 3,770
TP2: 3,760
TP3: 3,755
🔺 Buy Setup – Discount Demand (3,725–3,727)
• Entry: 3,725–3,727
• Stop Loss: 3,720
• Take Profits:
TP1: 3,740
TP2: 3,760
TP3: 3,775+
________________________________________
🔑 Strategy Note
With Fed caution and geopolitical risks keeping gold supported, the broader structure favors buy-the-dip setups while fading engineered sweeps into premium liquidity. Expect volatility around 3,800 liquidity runs before retracements to well-defined discount zones.

Gold Maintains Bullish Momentum with Upside PotentialGold is currently trading around \$3,783 after maintaining a strong bullish momentum. The chart shows a clear upward trend with price creating higher highs, and a fair value gap (FVG) zone marked as a potential retracement area for buyers to re-enter. As long as price holds above this support, the outlook remains bullish, with expectations of continuation toward higher levels.

Gold 1H – Fed Signals & Geopolitics Keep Bulls ActiveGold on the 1H timeframe is trading near 3,705–3,710 after a strong BOS, holding inside a rising channel. Liquidity is stacked above at the premium resistance zone around 3,716–3,718, while demand sits lower at 3,687–3,689 and deeper at the FVG zone 3,654–3,656. Recent Fed dovish signals following last week’s rate cut, along with escalating geopolitical tensions, continue to support safe-haven demand. However, upcoming U.S. inflation data and Fed speakers could spark engineered sweeps into premium supply before retracements into discount demand zones.
________________________________________
📌 Key Structure & Liquidity Zones (1H):
• 🔴 SELL ZONE 3,718–3,716 (SL 3,725): Premium resistance where liquidity sweeps may trigger short-term rejections targeting 3,710 → 3,700 → 3,690 .
• 🟢 BUY ZONE 3,687–3,689 (SL 3,680): Near-term demand zone aligned with channel structure, offering a pullback entry targeting 3,695 → 3,700 → 3,715+.
• 🟢 FVG BUY ZONE 3,654–3,656 (SL 3,647): Deeper discount support, attractive for longer setups targeting 3,670 → 3,685 → 3,700+.
________________________________________
📊 Trading Ideas (Scenario-Based):
🔺 Buy Setup – Pullback to Demand (3,687–3,689)
• Entry: 3,687–3,689
• Stop Loss: 3,680
• Take Profits:
TP1: 3,695
TP2: 3,700
TP3: 3,715+.
🔺 Buy Setup – FVG Sweep (3,654–3,656)
• Entry: 3,654–3,656
• Stop Loss: 3,647
• Take Profits:
TP1: 3,670
TP2: 3,685
TP3: 3,700+
🔻 Sell Setup – Premium Liquidity Run (3,716–3,718)
• Entry: 3,718–3,716
• Stop Loss: 3,725
• Take Profits:
TP1: 3,710
TP2: 3,700
TP3: 3,690.
________________________________________
🔑 Strategy Note
The Fed’s dovish tilt and safe-haven flows from geopolitical risks are sustaining bullish momentum, but intraday structure suggests smart money may first engineer stop-runs into premium resistance before retracing toward demand. Maintain buy-the-dip bias at defined support zones, while fading liquidity sweeps near 3,716–3,718 with caution. Volatility could increase as markets await fresh U.S. inflation data and Fed policy remarks.

Gold 1H – Premium Sweeps Risk Before ReversalGold on the 1H chart is consolidating after consecutive BOS and ChoCH signals, showing rejection from premium levels. Price is balancing between the fresh FVG sell zone near 3,673–3,671 and deep discount support at 3,634–3,636. Liquidity remains stacked above 3,705 and below 3,632, leaving room for engineered sweeps before direction is confirmed.
________________________________________
📌 Key Structure & Liquidity Zones (1H):
• 🔴 FVG SELL ZONE 3,673 – 3,671 (SL 3,680)
Premium intraday pocket for rejection targeting 3,660 → 3,650 → 3,640.
• 🔴 SELL GOLD LIQUIDITY 3,705 – 3,703 (SL 3,712)
Major premium liquidity trap before continuation lower toward 3,690 → 3,675 → 3,660.
• 🟢 BUY GOLD SUPPORT 3,634 – 3,636 (SL 3,627)
Discount demand zone, targeting recovery into 3,645 → 3,660 → 3,670 if defended.
________________________________________
📊 Trading Ideas (Scenario-Based):
🔻 Sell Setup – FVG Rejection (3,673–3,671)
• Entry: 3,673 – 3,671
• Stop Loss: 3,680
• Take Profits:
TP1: 3,660
TP2: 3,650
TP3: 3,640
👉 Expect engineered liquidity grab into FVG before downside extension.
🔻 Sell Setup – Premium Liquidity Sweep (3,705–3,703)
• Entry: 3,705 – 3,703
• Stop Loss: 3,712
• Take Profits:
TP1: 3,690
TP2: 3,675
TP3: 3,660
👉 Smart money may sweep highs near 3,705 before resuming bearish momentum.
🔺 Buy Setup – Discount Reversal (3,634–3,636)
• Entry: 3,634 – 3,636
• Stop Loss: 3,627
• Take Profits:
TP1: 3,645
TP2: 3,660
TP3: 3,670
👉 High R:R setup if gold defends discount demand; ideal for counter-trend scalps.
________________________________________
🔑 Strategy Note
Gold remains pressured below 3,673–3,705, favoring short setups into premium sweeps. However, watch closely for accumulation signs at 3,634–3,636 as buyers may reclaim structure. Best approach: scale in smaller positions until NY session confirms directional bias.

Gold 1H – Retail Sales Impact Before FedGold on the 1H timeframe is trading near 3,682 after a strong BOS. Liquidity is now stacked above the premium resistance at 3,700 and below the fresh FVG demand at 3,669–3667. With U.S. Retail Sales scheduled today at 19:30 VN time, volatility may spike intraday, but broader positioning remains cautious ahead of the Fed’s rate decision this week. Expect engineered sweeps into premium before retracements back into demand.
________________________________________
📌 Key Structure & Liquidity Zones (1H):
• 🔴 SELL ZONE 3,700 – 3,698 (SL 3,707): Premium resistance for engineered sweep/rejection targeting 3,690 → 3,680 → 3,670.
• 🟢 FVG BUY ZONE 3,669 – 3,667 (SL 3,660): Fair Value Gap demand aligned with retracement into structure, targeting 3,680 → 3,690 → 3,700+.
• 🟢 BUY SUPPORT 3,641 – 3,639 (SL 3,632): Deep discount support zone targeting 3,655 → 3,670 → 3,685+.
________________________________________
📊 Trading Ideas (Scenario-Based):
🔺 Buy Setup – FVG Reclaim (3,669–3,667)
• Entry: 3,669 – 3,667
• Stop Loss: 3,660
• Take Profits:
TP1: 3,680
TP2: 3,690
TP3: 3,700+
👉 Look for a liquidity sweep into the FVG zone before New York open.
🔺 Buy Setup – Discount Sweep (3,641–3,639)
• Entry: 3,641 – 3,639
• Stop Loss: 3,632
• Take Profits:
TP1: 3,655
TP2: 3,670
TP3: 3,685+
👉 Strong R:R if price hunts stops below structure before Retail Sales data.
🔻 Sell Setup – Premium Liquidity Run (3,700–3,698)
• Entry: 3,700 – 3,698
• Stop Loss: 3,707
• Take Profits:
TP1: 3,690
TP2: 3,680
TP3: 3,670
👉 Expect engineered stop-runs into premium supply before fading lower.
________________________________________
🔑 Strategy Note
Retail Sales may provide short-term volatility, but Fed expectations will dominate the week. Smart money is likely to run both sides of liquidity: fading premium near 3,700–3,698 while protecting buys at 3,669–3,667 and 3,641–3,639. Trade with reduced size and confirm structure on H1 closes.

TradersCity Pro | LINK Eyes Fresh Rally From Critical Support👋 Welcome to TradeCity Pro!
In this analysis, I’m going to review LINK, one of the RWA coins with a market cap of $16.41 billion, currently ranked 12th.
📅 Daily Timeframe
On the daily chart, after getting support around 11.55, LINK started an upward move and in its first wave rallied up to 26.73.
✔️ After reaching this zone, volume began to decline and a short correction formed down to the 0.236 Fibonacci level.
⭐ This area is also an important support zone that overlaps with a PRZ (Potential Reversal Zone) at the Fibonacci level, meaning the price could start its next bullish wave if it holds this floor.
🔍 If a deeper correction occurs, price could extend down to the 0.382 or 0.5 Fibonacci levels. Naturally, the deeper the correction, the weaker buyers’ strength becomes.
🎲 For long positions, if the price holds these key zones or breaks above 26.73, we can look for entries. The main confirmation of a bullish continuation will be a clean breakout of 26.73.
📝 Final Thoughts
Stay calm, trade wisely, and let's capture the market's best opportunities!
This analysis reflects our opinions and is not financial advice.
Share your thoughts in the comments, and don’t forget to share this analysis with your friends! ❤️

M30 Gold at Key Support: Break or BounceThis chart of Gold Spot (XAU/USD) on the 30-minute timeframe shows price reacting around a key support zone highlighted in purple. After a steady decline from the Fair Value Gap (FVG) area, price has tapped into the demand zone and is currently consolidating. From here, two potential scenarios stand out: if buyers defend this level, we could see a bullish reversal toward the 3,680–3,700 zone; however, if sellers break below the support, continuation to the downside toward 3,610–3,600 is likely. The current setup suggests watching closely for confirmation before entering either direction.

Bearish Outlook: AUDUSD on Track Toward 0.66210Good day everyone, Ken here!
I’ve been following AUDUSD rather closely, and it’s enjoyed a strong bullish move recently. Yet in my experience, such rallies rarely continue unchecked, and I sense this one may be nearing its peak.
There are subtle signs of sellers beginning to position themselves. My attention is firmly on the 0.66210 area – a level I consider crucial. Should price provide a clear confirmation here, not merely through candle formations but also through volume behaviour, I would view it as a potential entry point.
Naturally, the bullish scenario hasn’t vanished entirely. But for it to hold, buyers will need to demonstrate far greater conviction than they’ve shown so far.
That’s my perspective for now. How do you see it – do you share this view, or does the chart tell you a different story?

Gold 1H – Fed Decision Looms After $3,700 BreakGold on the 1H timeframe is consolidating around 3,675 after sweeping the historic $3,700 level. Price briefly tapped 3,702 before retreating into the 3,670s, showing engineered liquidity runs both sides. With the Fed policy decision due at 1 AM VN time, volatility is expected to spike. Market remains supported by easing USD, central bank flows, and geopolitical tension, but short-term positioning suggests possible liquidity grabs before a directional move.
________________________________________
📌 Key Structure & Liquidity Zones (1H):
• 🔴 SELL SCALP 3,696 – 3,694 (SL 3,703)
Premium supply pocket for engineered rejection targeting 3,690 → 3,685 → 3,680.
• 🟢 FVG BUY ZONE 3,674 – 3,665 (SL 3,660)
Fair Value Gap demand zone for retracement into structure, targeting 3,685 → 3,695 → 3,700+.
• 🟢 BUY SUPPORT 3,636 – 3,638 (SL 3,630)
Deep discount accumulation zone targeting 3,655 → 3,670 → 3,680+.
________________________________________
📊 Trading Ideas (Scenario-Based):
🔺 Buy Setup – FVG Reclaim (3,674–3,665)
• Entry: 3,674 – 3,665
• Stop Loss: 3,660
• Take Profits:
TP1: 3,685
TP2: 3,695
TP3: 3,700+
👉 Look for liquidity sweep into FVG before NY session/Fed.
🔺 Buy Setup – Deep Discount (3,636–3,638)
• Entry: 3,636 – 3,638
• Stop Loss: 3,630
• Take Profits:
TP1: 3,655
TP2: 3,670
TP3: 3,680+
👉 High R:R setup if stops hunted before Fed decision.
🔻 Sell Setup – Premium Trap (3,696–3,694)
• Entry: 3,696 – 3,694
• Stop Loss: 3,703
• Take Profits:
TP1: 3,690
TP2: 3,685
TP3: 3,680
👉 Expect engineered stop-runs into premium before fading lower.
________________________________________
🔑 Strategy Note
Gold’s break above $3,700 highlights strong bullish sentiment, but Fed decision risk means smart money may sweep liquidity both ways. Stay nimble: fade extremes at 3,696–3,694 for shorts, and defend demand at 3,674–3,665 and 3,636–3,638 for longs. Trade lighter size until post-Fed clarity.

FOMC XAUUSD: Time to hold super SELL before FOMC🟡 XAUUSD Daily Trading Plan – Ahead of FOMC
📊 Market Context
Gold (XAUUSD) has recently broken out of its accumulation/manipulation zone and is currently trading around 3,684–3,690.
Market is in bullish structure after a Change of Character (CHoCH) followed by a Break of Structure (BOS).
However, imbalances remain below current price, suggesting a potential retracement before continuation.
Liquidity pools are forming above 3,721–3,725, creating the risk of false breakouts (liquidity traps) near FOMC.
🔎 Technical Analysis (SMC Perspective)
Structure: Bullish bias on H1/H4, confirmed by higher highs and BOS.
Imbalance Zone: 3,674 → 3,664 (likely to be revisited).
Liquidity Pools:
Buy-side liquidity at 3,721–3,725 (Sell Zone).
Sell-side liquidity around 3,626–3,624 (Equal Low Zone).
🔑 Key Levels
Resistance / Sell Zone:
3,686.88 (immediate resistance)
3,721–3,725 (Liquidity Sell Zone)
Support / Buy Zones:
3,668 (Front End Buy – imbalance retest)
3,656–3,654 (Back End CP Buy Zone)
3,626–3,624 (Equal Low Liquidity Zone)
✅ Priority Scenario – BUY
Entry 1
BUY Limit: 3,668 (Front End Zone – imbalance retest)
SL: 3,661
TP: 3,690 → 3,700 → 3,721
Entry 2
BUY Limit: 3,656 – 3,654 (Back End CP Buy Zone)
SL: 3,648
TP: 3,690 → 3,700 → 3,721
Entry 3
BUY Limit: 3,626 – 3,624 (Equal Low Liquidity)
SL: 3,618
TP: 3,690 → 3,700 → 3,721
🔻 Alternative Scenario – SELL (Counter-trade)
If price reaches 3,721–3,725 (Liquidity Zone) before retesting lower buy zones → watch for rejection patterns.
SELL if bearish confirmation appears.
SL: 3,730
TP: 3,698 → 3,690 → 3,676
⚠️ Risk Management & Notes
Expect high volatility during FOMC – traps around liquidity zones are likely.
Reduce lot size before news release to mitigate risk.
Stick to confirmation entries (avoid blind buys/sells).
Main directional bias: Bullish as long as 3,648 holds.

COFFEE At Crossroads: Up or down?COFFEE has seen a strong impulse to the upside. But guess what? Now price is being coiling into a tight triangle. In this case, there are two scenarios possible, and taking into account that the market conditions are bullish, I am more inclined to say that the price will break to the upside of the triangle formation.
Do you agree? Drop a comment below. Engaging with the TradingView community is always helpful to improve and grow as traders.
Not financial advice, just sharing my thoughts on the charts. Trade safely 😊

Gold 4H Outlook – Buy the Dip or Fade the Drop?Gold on the 4H timeframe is consolidating below 3,600 after a strong bullish run. Current structure shows price resting near premium levels, with liquidity building both above 3,600 and below 3,530. This suggests engineered sweeps before the next expansion.
________________________________________
📌 Key Structure & Liquidity Zones (4H):
• 🔼 Buy Zone 3,572 – 3,574 (SL 3,565): Fresh demand zone sitting at intraday discount; potential continuation area.
• 🔽 Sell Scalp Zone 3,530 – 3,526 (SL 3,537): Short-term supply/pivot area; scalp opportunity if price rejects.
• 📍 Liquidity Magnet 3,603 – 3,605: Upside imbalance zone likely to be rebalanced.
________________________________________
📊 Trading Ideas (Scenario-Based):
🔺 Buy Setup – Demand Zone Reaction
• Entry: 3,572 – 3,574
• Stop Loss: 3,565
• Take Profits:
o TP1: 3,585
o TP2: 3,595
o TP3: 3,605
👉 Demand block aligned with bullish order flow. Look for liquidity sweep and rejection to resume trend.
________________________________________
🔻 Sell Scalp Setup – Short-Term Reaction
• Entry: 3,530 – 3,528
• Stop Loss: 3,537
• Take Profits:
o TP1: 3,520
o TP2: 3,510
o TP3: 3,500
👉 Intraday supply zone and pivot. Best used for quick scalps against trend, targeting downside liquidity.
________________________________________
🔑 Strategy Note
Bias remains bullish overall, but intraday shorts are valid for scalps. The cleaner setup is buying into 3,572–3,574 for continuation toward 3,600+. Smart money may sweep liquidity at 3,530 before reversing higher.

Gold 1H – Breakout Liquidity Trap Ahead of ExpansionGold on the 1H timeframe is consolidating near 3,652 after sweeping discount liquidity and reclaiming structure. Price has tapped into the breakout zone and is now positioned between premium scalp supply and higher liquidity pools. The structure suggests engineered plays into 3,656–3,658 or deeper liquidity toward 3,672–3,674 before expansion. Discount demand remains protected at 3,614–3,612.
________________________________________
📌 Key Structure & Liquidity Zones (1H):
• 🔴 SELL ZONE 3,672 – 3,674 (SL 3,679): Premium supply pocket for engineered rejection targeting 3,660 → 3,650 → 3,640.
• 🔴 SELL SCALP 3,656 – 3,658 (SL 3,663): Short-term premium sweep zone for intraday liquidity grabs targeting 3,645 → 3,640.
• 🟢 BUY ZONE 3,614 – 3,612 (SL 3,607): Discount demand block aligned with bullish order flow targeting 3,630 → 3,640 → 3,655.
________________________________________
📊 Trading Ideas (Scenario-Based):
🔻 Sell Setup – Premium Scalp Rejection
• Entry: 3,656 – 3,658
• Stop Loss: 3,663
• Take Profits:
TP1: 3,645
TP2: 3,640
👉 Intraday scalp opportunity if price sweeps into shallow premium liquidity.
🔻 Sell Setup – Deeper Premium Sweep
• Entry: 3,672 – 3,674
• Stop Loss: 3,679
• Take Profits:
TP1: 3,660
TP2: 3,650
TP3: 3,640
👉 Expect engineered sweep into higher premium before reversal.
🔺 Buy Setup – Discount Demand Reaction
• Entry: 3,614 – 3,612
• Stop Loss: 3,607
• Take Profits:
TP1: 3,630
TP2: 3,640
TP3: 3,655
👉 High R:R play if price retraces to protected demand before expansion.
________________________________________
🔑 Strategy Note
Smart money is likely to manipulate both premium and discount zones around the breakout point. Bias favors:
• Scalp sells at 3,656–3,658
• Swing sells at 3,672–3,674
• Discount buys at 3,614–3,612
Risk management is critical — expect liquidity sweeps both sides before real expansion.

COFFEE Price Rising – Is a Correction Ahead?Hello everyone, what do you think about PEPPERSTONE:COFFEE ?
The price of COFFEE is quite interesting at the moment. It has been steadily rising and seems to be forming a familiar triangle pattern. If this pattern continues to develop, there’s a strong chance the price will continue to move upwards. However, I will wait for a strong candle to confirm the signal before making a decision.
My target is 427 , but if the price drops below the triangle, we might see a short-term correction, and we’ll need to reassess.
👉 Do you think the price will continue to rise or is a correction ahead? Share your thoughts in the comments!
Note: This is not financial advice, just a personal view on the chart. Wishing everyone safe and successful trading! 😊

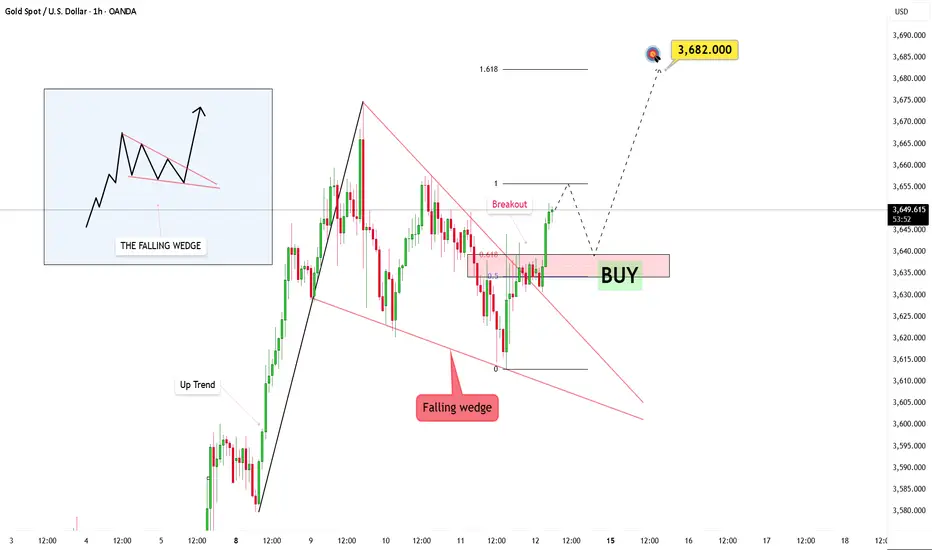
Gold Analysis: Falling Wedge Breakout and Bullish ForecastOANDA:XAUUSD The market is clearly forming a falling wedge, and recent price action suggests a potential shift is on the horizon. Price has begun breaking through this downward structure, which could be the early signs of a strong bullish move.
I’m waiting for the price to retrace back to the broken trendline. This will act as a confirmation, filtering out any false moves, while a retest of the structure will solidify the validity of the breakout. From here, my target is 3682.
The key now is to watch the pullback. If the market returns to the trendline with rising volume, it will add weight to the bullish case.
This trendline breakout is more than just a signal – it’s a story in the making. It represents a shift, and with the right volume, structure, and timing, this could be the start of a larger bullish phase.
TradeCityPro | Bitcoin Daily Analysis #177👋 Welcome to TradeCity Pro!
Let's dive into Bitcoin analysis, today’s analysis will be on the 1-hour timeframe since Bitcoin is in a corrective phase, and we’ll look at what triggers we can have for trading today.
⏳ 1-Hour Timeframe
After reaching the 116,619 level, the market entered a ranging phase and spent Saturday and Sunday consolidating below this level.
📊 Earlier today, before the London session, Bitcoin was rejected from 116,619, starting a bearish move with strong momentum and high volume, pushing price down to the 0.382 Fibonacci level for a correction.
⭐ If price finds support here, we can say the uptrend is still strong since it bounced from the first available support zone and started moving upward. In this case, a breakout above 116,619 would be a good long position entry.
🔍 But if the correction continues, the next support levels to watch are 0.5, 0.618, and 0.786 Fibonacci retracement levels.
✔️ The area between the 0.5 and 0.618 Fibonacci retracements forms a critical PRZ, and if price moves lower, this is one of the areas with a high probability of seeing a reaction.
❌ Disclaimer ❌
Trading futures is highly risky and dangerous. If you're not an expert, these triggers may not be suitable for you. You should first learn risk and capital management. You can also use the educational content from this channel.
Finally, these triggers reflect my personal opinions on price action, and the market may move completely against this analysis. So, do your own research before opening any position.

Gold 1H – Fed Week: Liquidity Sweeps Before FOMCGold on the 1H timeframe is ranging around 3,643 after a series of ChoCH/BOS prints. Liquidity is stacked above the intraday buy zone at 3,658–3,656 and higher at 3,676–3,678, while discount liquidity sits near 3,615–3,613. With markets pricing a potential Fed cut this week and dot-plot guidance in focus, expect engineered spikes into premium followed by mean reversion before any sustained move.
________________________________________
📌 Key Structure & Liquidity Zones (1H):
• 🔴 SELL ZONE 3,676 – 3,678 (SL 3,683): Premium resistance for engineered sweep/rejection targeting 3,665 → 3,655 → 3,645.
• 🟢 BUY ZONE 3,658 – 3,656 (SL 3,651): Intraday demand inside prior consolidation targeting 3,665 → 3,670 → 3,675+.
• 🟢 BUY SUPPORT 3,615 – 3,613 (SL 3,610): Discount demand at the base of structure targeting 3,630 → 3,645 → 3,655+.
________________________________________
📊 Trading Ideas (Scenario-Based):
🔺 Buy Setup – Intraday Reclaim (3,658–3,656)
• Entry: 3,658 – 3,656
• Stop Loss: 3,651
• Take Profits:
TP1: 3,665
TP2: 3,670
TP3: 3,675+
👉 Look for a sweep into the zone and an H1 close back above 3,656 to confirm order-flow continuation.
🔺 Buy Setup – Deep Discount Sweep (3,615–3,613)
• Entry: 3,615 – 3,613
• Stop Loss: 3,610
• Take Profits:
TP1: 3,630
TP2: 3,645
TP3: 3,655+
👉 High R:R if liquidity runs into protected demand before New York session.
🔻 Sell Setup – Premium Sweep to Resistance (3,676–3,678)
• Entry: 3,676 – 3,678
• Stop Loss: 3,683
• Take Profits:
TP1: 3,665
TP2: 3,655
TP3: 3,645
👉 Expect stop-run above recent highs into premium; invalidate on strong H1 close above 3,683.
________________________________________
🔑 Strategy Note
Into Fed week, smart money often runs both sides of the book. Bias today favors: discount buys at 3,658–3,656 and 3,615–3,613, and a premium fade at 3,676–3,678. Use reduced size, wait for structure confirmation, and avoid holding through any unexpected Fed headlines or USD spikes.

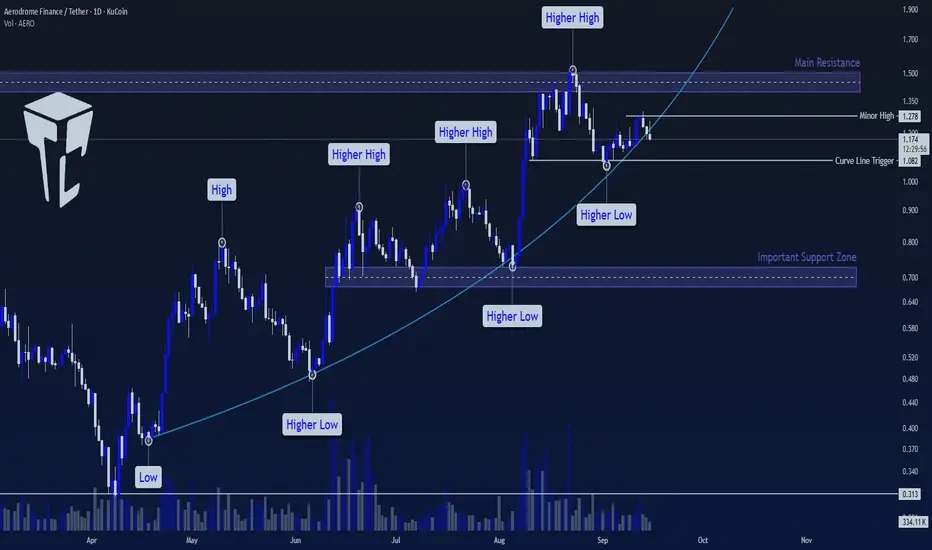
TradeCity Pro | AERO Testing Key Support on Curved Uptrend👋 Welcome to TradeCity Pro!
In this analysis, I want to review the AERO coin for you. It is one of the largest crypto DEX platforms that mainly operates in China Base and currently ranks 77th on CoinMarketCap with a market cap of $1.05 billion.
📅 Daily Timeframe
In the daily timeframe, we see an uptrend that has been moving sharply upward along a curved trendline.
⚡️ The main resistance for AERO is the 1.5 zone, which I have marked on the chart.
✔️ Price has touched this area once and has now returned to its trendline, forming a minor top at 1.278. If it gets rejected from this level and triggers 1.082, this level will turn into a major top.
🔍 Currently, the 1.082 level is a very good trigger for a short position. Breaking this level confirms the trendline break and could start a large corrective wave toward the next support zone.
✨ However, if the price forms a range box between 1.082 and 1.278, we can open an early long position after the breakout of 1.278. The main trigger for a long position or even a spot buy will be the breakout of the 1.5 zone.
📊 A positive sign for the uptrend is that volume has increased well during bullish waves and decreased during corrections. This indicates strong buyer momentum and is a bullish signal for the trend.
📝 Final Thoughts
Stay calm, trade wisely, and let's capture the market's best opportunities!
This analysis reflects our opinions and is not financial advice.
Share your thoughts in the comments, and don’t forget to share this analysis with your friends! ❤️
TradeCityPro | Bitcoin Daily Analysis #176👋 Welcome to TradeCity Pro!
Let’s go for a different kind of Bitcoin analysis today. I’ve used a new color theme on the chart—let me know in the comments whether you like this theme or prefer the previous one.
⌛️ 4-Hour Timeframe
In the 4-hour timeframe, Bitcoin had formed a descending channel, moving lower with a bearish structure of lower highs and lower lows toward the 107,000 support zone.
✔️ After reacting to this support, price climbed toward the channel’s top. Following one false breakout, it managed to break the channel on the next attempt and moved toward the channel trigger at 113,222.
💥 This move came with rising volume, which boosted bullish momentum and increased the likelihood of breaking 113,222.
✨ With the breakout of 113,222, Bitcoin’s main upward wave began, and price is now heading toward the next resistance at 116,960, which it is already approaching.
🧩 Over the last few candles, volume has dropped significantly, mainly because it’s the weekend. If volume starts to pick up with the new week, the probability of breaking 116,960 will increase.
🔑 A breakout above 116,960 could serve as the next long trigger, while Bitcoin’s key major resistance remains at 121,188.
❌ Disclaimer ❌
Trading futures is highly risky and dangerous. If you're not an expert, these triggers may not be suitable for you. You should first learn risk and capital management. You can also use the educational content from this channel.
Finally, these triggers reflect my personal opinions on price action, and the market may move completely against this analysis. So, do your own research before opening any position.

TradeCityPro | Bitcoin Daily Analysis #175👋 Welcome to TradeCity Pro!
Let’s move on to Bitcoin analysis. I haven’t posted an update for the past two days, but starting today, let’s get back to the market and see what’s ahead.
⌛️ 4-Hour Timeframe
The U.S. CPI and PPI data, two key inflation indicators, were released and came in favorably for the market. As a result, Bitcoin has moved toward 117,048.
💥 At the moment, most of the positions we’ve opened are in profit. Because of this, taking some profit could be a smart option, since Bitcoin might enter a corrective phase once it reaches the 117,048 level.
📈 For new entries, a clean breakout above 117,048 would be a valid trigger. However, the chance of breaking this zone on the first attempt is low, and there’s a strong possibility that price will wait for Powell’s upcoming speech before making its next decisive move.
📊 We can also use RSI’s move into the overbought zone as a momentum confirmation. If that happens, it could set off a powerful bullish leg to the upside.
❌ Disclaimer ❌
Trading futures is highly risky and dangerous. If you're not an expert, these triggers may not be suitable for you. You should first learn risk and capital management. You can also use the educational content from this channel.
Finally, these triggers reflect my personal opinions on price action, and the market may move completely against this analysis. So, do your own research before opening any position.

Gold 1H – Demand Sweep Before Premium ExpansionGold on the 1H timeframe is consolidating near 3,644 after multiple ChoCHs, showing engineered liquidity grabs. Price has defined clear demand footprints at 3,620 and deeper at 3,593, while premium supply is stacked near 3,673–3,680. This structure suggests a possible retracement into discount zones before expansion toward premium liquidity.
________________________________________
📌 Key Structure & Liquidity Zones (1H):
• 🔼 Buy Zone 3,620 – 3,618 (SL 3,613): Fresh demand block aligned with bullish order flow.
• 🔼 Buy Zone 3,593 – 3,591 (SL 3,596): Deeper liquidity sweep, high R:R demand area.
• 🔽 Sell Zone 3,673 – 3,671 (SL 3,680): Premium supply pocket for short-term liquidity grabs.
________________________________________
📊 Trading Ideas (Scenario-Based):
🔺 Buy Setup – Shallow Demand Reaction
• Entry: 3,620 – 3,618
• Stop Loss: 3,613
• Take Profits:
TP1: 3,635
TP2: 3,650
TP3: 3,665+
👉 Expect a bounce from shallow demand before retesting premium zones.
🔺 Buy Setup – Deeper Liquidity Sweep
• Entry: 3,593 – 3,591
• Stop Loss: 3,596
• Take Profits:
TP1: 3,610
TP2: 3,625
TP3: 3,645+
👉 Ideal entry for swing traders seeking higher R:R after liquidity engineering.
🔻 Sell Setup – Premium Rejection
• Entry: 3,673 – 3,671
• Stop Loss: 3,680
• Take Profits:
TP1: 3,660
TP2: 3,650
TP3: 3,635
👉 Scalp opportunity at premium supply; bias remains bullish so manage risk tightly.
________________________________________
🔑 Strategy Note
Bias remains bullish, but smart money may engineer a dip into 3,620 or deeper 3,593 demand before expansion. Cleaner setups favor buying dips; shorts from 3,673 are counter-trend scalp plays only.
