Gold Faces Resistance, Potential Pullback AheadGold (XAUUSD) is currently trading around \$3,716 after a strong bullish rally but is now approaching a key resistance zone. The chart suggests a potential rejection from this supply area, with a short entry setup targeting the \$3,695 level. If selling pressure holds, price could extend further downward after retesting the entry zone.
Dailychart

Gold Faces Rejection at Supply Zone, Bearish Retracement Gold (XAUUSD) is currently trading around 3,711 after a strong bullish rally but has reached a key supply zone, where rejection is likely. The chart indicates a potential bearish move, with price expected to retrace downward toward the 3,646–3,650 target zone. This move aligns with the marked order blocks and fair value gap, suggesting sellers could step in at current levels.

A descending channel/bullflag reveals itself on btcusdThe pole looks more obvious on longer timeframe charts but the flag/ channel itself is best illustrated on the 1day time frame. In fact there is a much longer pole than the one shown here on the monthly chart, but I didn’t go with that one because the flag on the monthly is more of a horizontal channel than the descending channel shown here on the 1day chart. *not financial advice*

Gold Under Pressure - Is the Downtrend Just Beginning?Hi everyone, it’s Ken!
On the 2H chart, after careful observation, we can see a RISING WEDGE pattern forming. After XAUUSD broke the previous uptrend and completed its correction phase, there's a high likelihood that a new bearish trend will emerge, continuing the short-term downtrend we've seen recently.
Ken's target is to push the price below 3,630, aiming for a further low at 3,608 – this level perfectly aligns with Fibonacci 1.618.
What about you? Do you think XAUUSD will continue to drop, or is there a chance for a reversal to the upside? Share your thoughts and targets in the comments!

Gold 1H – Premium Sweeps Risk Before ReversalGold on the 1H chart is consolidating after consecutive BOS and ChoCH signals, showing rejection from premium levels. Price is balancing between the fresh FVG sell zone near 3,673–3,671 and deep discount support at 3,634–3,636. Liquidity remains stacked above 3,705 and below 3,632, leaving room for engineered sweeps before direction is confirmed.
________________________________________
📌 Key Structure & Liquidity Zones (1H):
• 🔴 FVG SELL ZONE 3,673 – 3,671 (SL 3,680)
Premium intraday pocket for rejection targeting 3,660 → 3,650 → 3,640.
• 🔴 SELL GOLD LIQUIDITY 3,705 – 3,703 (SL 3,712)
Major premium liquidity trap before continuation lower toward 3,690 → 3,675 → 3,660.
• 🟢 BUY GOLD SUPPORT 3,634 – 3,636 (SL 3,627)
Discount demand zone, targeting recovery into 3,645 → 3,660 → 3,670 if defended.
________________________________________
📊 Trading Ideas (Scenario-Based):
🔻 Sell Setup – FVG Rejection (3,673–3,671)
• Entry: 3,673 – 3,671
• Stop Loss: 3,680
• Take Profits:
TP1: 3,660
TP2: 3,650
TP3: 3,640
👉 Expect engineered liquidity grab into FVG before downside extension.
🔻 Sell Setup – Premium Liquidity Sweep (3,705–3,703)
• Entry: 3,705 – 3,703
• Stop Loss: 3,712
• Take Profits:
TP1: 3,690
TP2: 3,675
TP3: 3,660
👉 Smart money may sweep highs near 3,705 before resuming bearish momentum.
🔺 Buy Setup – Discount Reversal (3,634–3,636)
• Entry: 3,634 – 3,636
• Stop Loss: 3,627
• Take Profits:
TP1: 3,645
TP2: 3,660
TP3: 3,670
👉 High R:R setup if gold defends discount demand; ideal for counter-trend scalps.
________________________________________
🔑 Strategy Note
Gold remains pressured below 3,673–3,705, favoring short setups into premium sweeps. However, watch closely for accumulation signs at 3,634–3,636 as buyers may reclaim structure. Best approach: scale in smaller positions until NY session confirms directional bias.

Bitcoin Has Potential to Continue – Don’t Miss Out!Hello everyone, Ken here!
Let’s dive deeper into the current price action of Bitcoin.
As you can see, price is moving within a clear upward channel, signaling strong bullish momentum. After a sharp rise, the price has slightly pulled back to retest the broken resistance. This is a classic break and retest setup within a larger channel, a popular trading pattern I often use.
The key point here is that if this level holds as support, buyer confidence will be further solidified. And we’re already seeing that happen!
With this momentum, I believe 118,850 USDT is the next target, where the price could reverse depending on market reactions at that point.
Wishing you successful trades and a disciplined strategy!

HBARUSDT: Ready for the Next Bull Run to 0.27430!The HBARUSDT market is looking incredibly bullish! We've just seen a strong shift from a downtrend to an uptrend, creating a perfect opportunity to go long.
The price has broken through a key resistance level, then pulled back to retest it – a textbook breakout & retest setup. This highlights the strength of the bullish momentum.
Now, with the price rejecting that level and turning it into new support, this is a strong long signal with the next target in sight!
My target is 0.27430. Let’s get ready for the next move!

GBP/USD: Double Top Pattern Detected – Bearish Reversal Ahead!Hello everyone, Ken here!
Recently, GBP/USD had a strong upward movement, but right now, we are witnessing the formation of a Double Top pattern – a very powerful bearish reversal signal.
So, What’s Happening?
When the price forms two consecutive peaks at nearly the same high level, this signals that buying pressure is starting to weaken, and the potential for a bearish reversal is becoming clearer. The neckline is especially critical here, as it serves as the support level, and if broken, it will confirm the end of the previous uptrend and open the door for a strong downward move.
Why Are We Waiting for the Neckline Retest?
As we can see, the price is starting to slide below the neckline, but to confirm the Double Top pattern confidently, the safer approach is to wait for the price to revisit and retest the neckline. If the old support now turns into resistance, it is a strong indication that the reversal is real, and this is the ideal moment to enter a short trade.
Downside Target and Risk Management
Once the Double Top is confirmed, the downside target is calculated by measuring the height of the double bottom and adding it to the neckline level. In this case, the ideal target price would be 1.35817, offering a significant bearish opportunity.
For risk management, place your stop loss just above the neckline after the retest to protect your capital if the market reverses unexpectedly.
Pattern Reliability
The Double Top pattern on the 2-hour chart can be very powerful, but like all patterns, its reliability depends on market volatility and unexpected events. However, if the neckline holds firm after the retest and we see strong rejection, the probability of a further decline is high.
Conclusion
The Double Top pattern on GBP/USD is definitely worth paying attention to. If we see strong confirmation from the market, the potential for a significant drop could be very rewarding. Be patient and wait for a clear signal from the market before jumping in!
Wishing you successful trades and big profits!

Near moving above invh&s w/ a double bottom neckline just aboveThe inverse head and shoulders breakout not yet fully confirmed, but price is currently comfortably above its neckline. In hitting the inverse head and shoulders full target, it should also validate the double bottom breakout as well. *not financial advice*

Gold 1H – Retail Sales Impact Before FedGold on the 1H timeframe is trading near 3,682 after a strong BOS. Liquidity is now stacked above the premium resistance at 3,700 and below the fresh FVG demand at 3,669–3667. With U.S. Retail Sales scheduled today at 19:30 VN time, volatility may spike intraday, but broader positioning remains cautious ahead of the Fed’s rate decision this week. Expect engineered sweeps into premium before retracements back into demand.
________________________________________
📌 Key Structure & Liquidity Zones (1H):
• 🔴 SELL ZONE 3,700 – 3,698 (SL 3,707): Premium resistance for engineered sweep/rejection targeting 3,690 → 3,680 → 3,670.
• 🟢 FVG BUY ZONE 3,669 – 3,667 (SL 3,660): Fair Value Gap demand aligned with retracement into structure, targeting 3,680 → 3,690 → 3,700+.
• 🟢 BUY SUPPORT 3,641 – 3,639 (SL 3,632): Deep discount support zone targeting 3,655 → 3,670 → 3,685+.
________________________________________
📊 Trading Ideas (Scenario-Based):
🔺 Buy Setup – FVG Reclaim (3,669–3,667)
• Entry: 3,669 – 3,667
• Stop Loss: 3,660
• Take Profits:
TP1: 3,680
TP2: 3,690
TP3: 3,700+
👉 Look for a liquidity sweep into the FVG zone before New York open.
🔺 Buy Setup – Discount Sweep (3,641–3,639)
• Entry: 3,641 – 3,639
• Stop Loss: 3,632
• Take Profits:
TP1: 3,655
TP2: 3,670
TP3: 3,685+
👉 Strong R:R if price hunts stops below structure before Retail Sales data.
🔻 Sell Setup – Premium Liquidity Run (3,700–3,698)
• Entry: 3,700 – 3,698
• Stop Loss: 3,707
• Take Profits:
TP1: 3,690
TP2: 3,680
TP3: 3,670
👉 Expect engineered stop-runs into premium supply before fading lower.
________________________________________
🔑 Strategy Note
Retail Sales may provide short-term volatility, but Fed expectations will dominate the week. Smart money is likely to run both sides of liquidity: fading premium near 3,700–3,698 while protecting buys at 3,669–3,667 and 3,641–3,639. Trade with reduced size and confirm structure on H1 closes.

XRPUSDT: A Long Opportunity You Can’t MissXRPUSDT is looking pretty interesting right now. The price has broken through the nearest resistance level and has come back to retest it. Classic breakout and retest setup.
The price got rejected from that level, turning it into a new support zone. This is a solid long signal. My target is 3.3828.
What do you think?

Gold Analysis: Strong Upside Potential from Key Support ZoneHey everyone, Ken here!
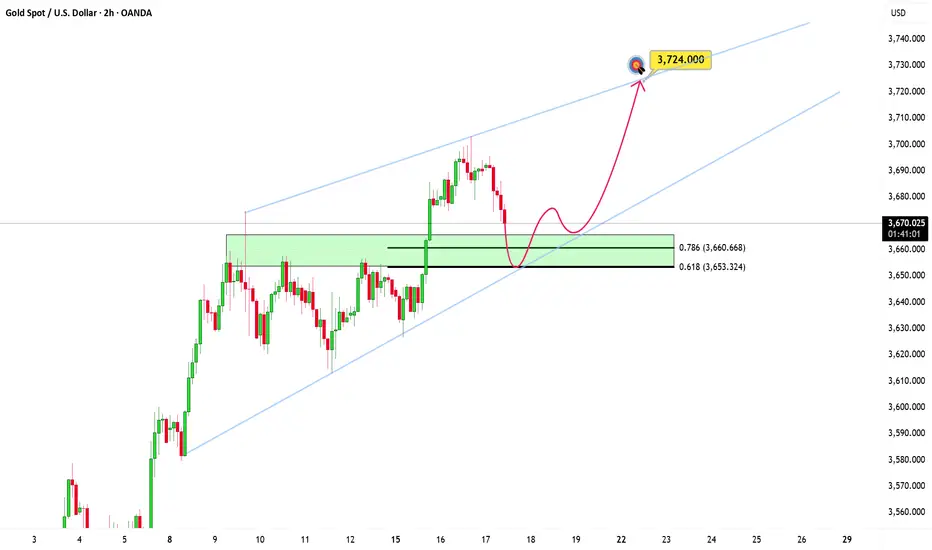
I'm keeping a close eye on XAUUSD, and right now, gold is approaching a very important support zone that I’ve shared before. This level is not only reinforced by strong buying pressure but also aligns with the trendline, making the potential for a bounce here very high.
If price confirms support here through strong price action, such as long lower wicks or a bullish engulfing candle, I believe gold will reverse and target 3,724, a reasonable goal given the current market structure.
However, if price breaks and holds below this support zone, the bullish trend will be invalidated, and we could see a sharp decline.
This is my personal opinion, not financial advice. Always assess your setups and ensure proper risk management when trading!
Good luck with your trades!
EURAUD Triple Bottom SpottedPrice on EURAUD has been in a strong downtrend, pressing lower with sellers in control.
But notice what happens at this level.
Price tests it once… bounces.
Comes back again…
And then a third time, buyers defend the level once more.
That’s a clear Triple Bottom, a strong sign that sellers are losing strength, while buyers are building momentum.
Now look at this: the real confirmation came when price broke above the neckline, the resistance that connects the swing highs between the three bottoms.
That breakout tells us the shift is real! Strong and clean.
And now he market drives higher.
This is the Triple Bottom: a classic reversal pattern that often signals the end of a bearish trend.

Gold 1H – Dollar Strength Weighs Ahead of US DataGold on the 1H chart is testing deeper demand zones near 3,612–3,614 after repeated liquidity sweeps into 3,678 and 3,702. Sellers continue to defend premium supply, with engineered stop-runs fading quickly. Today’s US data releases and renewed dollar strength keep gold vulnerable to further downside unless discount demand zones show strong defense.
________________________________________
📌 Key Structure & Liquidity Zones (1H):
• 🔴 SELL SCALP 3,678 – 3,680 (SL 3,685)
Premium intraday pocket for rejection targeting 3,675 → 3,670 → 3,665.
• 🔴 SELL ZONE 3,704 – 3,702 (SL 3,711)
Major premium supply trap for engineered sweep before continuation lower toward 3,670 → 3,655 → 3,640.
• 🟢 BUY GOLD SUPPORT 3,616 – 3,618 (SL 3,610)
Fresh deep discount demand zone, targeting recovery into 3,630 → 3,645 → 3,655+ if defended.
________________________________________
📊 Trading Ideas (Scenario-Based):
🔻 Sell Setup – Intraday Premium Rejection (3,678–3,680)
• Entry: 3,678 – 3,680
• Stop Loss: 3,685
• Take Profits:
TP1: 3,675
TP2: 3,670
TP3: 3,665
👉 Expect engineered liquidity grab into premium before NY session.
🔻 Sell Setup – Higher Premium Trap (3,704–3,702)
• Entry: 3,704 – 3,702
• Stop Loss: 3,711
• Take Profits:
TP1: 3,670
TP2: 3,655
TP3: 3,640
👉 Smart money may sweep highs near 3,704 before extending bearish leg.
🔺 Buy Setup – Discount Reversal (3,612–3,614)
• Entry: 3,616 – 3,618
• Stop Loss: 3,610
• Take Profits:
TP1: 3,630
TP2: 3,645
TP3: 3,655+
👉 Strong bounce potential if dollar retraces post-data; favorable risk/reward from deep demand.
________________________________________
🔑 Strategy Note
With US data and dollar strength in focus, gold remains heavy below 3,678–3,704. Favor short setups into premium sweeps, but monitor 3,612–3,614 closely for signs of accumulation. Trade smaller size until direction clarifies post-news.

Bearish Outlook: AUDUSD on Track Toward 0.66210Good day everyone, Ken here!
I’ve been following AUDUSD rather closely, and it’s enjoyed a strong bullish move recently. Yet in my experience, such rallies rarely continue unchecked, and I sense this one may be nearing its peak.
There are subtle signs of sellers beginning to position themselves. My attention is firmly on the 0.66210 area – a level I consider crucial. Should price provide a clear confirmation here, not merely through candle formations but also through volume behaviour, I would view it as a potential entry point.
Naturally, the bullish scenario hasn’t vanished entirely. But for it to hold, buyers will need to demonstrate far greater conviction than they’ve shown so far.
That’s my perspective for now. How do you see it – do you share this view, or does the chart tell you a different story?

Gold 1H – Fed Decision Looms After $3,700 BreakGold on the 1H timeframe is consolidating around 3,675 after sweeping the historic $3,700 level. Price briefly tapped 3,702 before retreating into the 3,670s, showing engineered liquidity runs both sides. With the Fed policy decision due at 1 AM VN time, volatility is expected to spike. Market remains supported by easing USD, central bank flows, and geopolitical tension, but short-term positioning suggests possible liquidity grabs before a directional move.
________________________________________
📌 Key Structure & Liquidity Zones (1H):
• 🔴 SELL SCALP 3,696 – 3,694 (SL 3,703)
Premium supply pocket for engineered rejection targeting 3,690 → 3,685 → 3,680.
• 🟢 FVG BUY ZONE 3,674 – 3,665 (SL 3,660)
Fair Value Gap demand zone for retracement into structure, targeting 3,685 → 3,695 → 3,700+.
• 🟢 BUY SUPPORT 3,636 – 3,638 (SL 3,630)
Deep discount accumulation zone targeting 3,655 → 3,670 → 3,680+.
________________________________________
📊 Trading Ideas (Scenario-Based):
🔺 Buy Setup – FVG Reclaim (3,674–3,665)
• Entry: 3,674 – 3,665
• Stop Loss: 3,660
• Take Profits:
TP1: 3,685
TP2: 3,695
TP3: 3,700+
👉 Look for liquidity sweep into FVG before NY session/Fed.
🔺 Buy Setup – Deep Discount (3,636–3,638)
• Entry: 3,636 – 3,638
• Stop Loss: 3,630
• Take Profits:
TP1: 3,655
TP2: 3,670
TP3: 3,680+
👉 High R:R setup if stops hunted before Fed decision.
🔻 Sell Setup – Premium Trap (3,696–3,694)
• Entry: 3,696 – 3,694
• Stop Loss: 3,703
• Take Profits:
TP1: 3,690
TP2: 3,685
TP3: 3,680
👉 Expect engineered stop-runs into premium before fading lower.
________________________________________
🔑 Strategy Note
Gold’s break above $3,700 highlights strong bullish sentiment, but Fed decision risk means smart money may sweep liquidity both ways. Stay nimble: fade extremes at 3,696–3,694 for shorts, and defend demand at 3,674–3,665 and 3,636–3,638 for longs. Trade lighter size until post-Fed clarity.

FOMC XAUUSD: Time to hold super SELL before FOMC🟡 XAUUSD Daily Trading Plan – Ahead of FOMC
📊 Market Context
Gold (XAUUSD) has recently broken out of its accumulation/manipulation zone and is currently trading around 3,684–3,690.
Market is in bullish structure after a Change of Character (CHoCH) followed by a Break of Structure (BOS).
However, imbalances remain below current price, suggesting a potential retracement before continuation.
Liquidity pools are forming above 3,721–3,725, creating the risk of false breakouts (liquidity traps) near FOMC.
🔎 Technical Analysis (SMC Perspective)
Structure: Bullish bias on H1/H4, confirmed by higher highs and BOS.
Imbalance Zone: 3,674 → 3,664 (likely to be revisited).
Liquidity Pools:
Buy-side liquidity at 3,721–3,725 (Sell Zone).
Sell-side liquidity around 3,626–3,624 (Equal Low Zone).
🔑 Key Levels
Resistance / Sell Zone:
3,686.88 (immediate resistance)
3,721–3,725 (Liquidity Sell Zone)
Support / Buy Zones:
3,668 (Front End Buy – imbalance retest)
3,656–3,654 (Back End CP Buy Zone)
3,626–3,624 (Equal Low Liquidity Zone)
✅ Priority Scenario – BUY
Entry 1
BUY Limit: 3,668 (Front End Zone – imbalance retest)
SL: 3,661
TP: 3,690 → 3,700 → 3,721
Entry 2
BUY Limit: 3,656 – 3,654 (Back End CP Buy Zone)
SL: 3,648
TP: 3,690 → 3,700 → 3,721
Entry 3
BUY Limit: 3,626 – 3,624 (Equal Low Liquidity)
SL: 3,618
TP: 3,690 → 3,700 → 3,721
🔻 Alternative Scenario – SELL (Counter-trade)
If price reaches 3,721–3,725 (Liquidity Zone) before retesting lower buy zones → watch for rejection patterns.
SELL if bearish confirmation appears.
SL: 3,730
TP: 3,698 → 3,690 → 3,676
⚠️ Risk Management & Notes
Expect high volatility during FOMC – traps around liquidity zones are likely.
Reduce lot size before news release to mitigate risk.
Stick to confirmation entries (avoid blind buys/sells).
Main directional bias: Bullish as long as 3,648 holds.

COFFEE At Crossroads: Up or down?COFFEE has seen a strong impulse to the upside. But guess what? Now price is being coiling into a tight triangle. In this case, there are two scenarios possible, and taking into account that the market conditions are bullish, I am more inclined to say that the price will break to the upside of the triangle formation.
Do you agree? Drop a comment below. Engaging with the TradingView community is always helpful to improve and grow as traders.
Not financial advice, just sharing my thoughts on the charts. Trade safely 😊

EURUSD – Two Bullish Paths on Daily TimeframeOn the daily timeframe, I maintain a bullish perspective for EURUSD. The draw on liquidity, in my view, is to the upside, with buy-side liquidity acting as the main target.
The overall chart structure shows bullish order flow, with price respecting bullish PD Arrays and rejecting from the recent low. Currently, price has reached a bullish Fair Value Gap (FVG) and is trading near a daily order block. From here, we can anticipate a bullish reaction.
I am considering two potential scenarios:
1️⃣ Scenario One – Price reacts directly from the bullish FVG or the nearby order block, continuing the upward move toward buy-side liquidity.
2️⃣ Scenario Two – Price sweeps the recent low first, collecting liquidity, and then begins the main upward move.
In both cases, my bias remains bullish, with the expectation that price will ultimately target higher levels. Personally, I believe the bullish move can already start from the current area.
💌It is my honor to share your comments with me💌
🔎 DYOR
💡Wait for the update!

Gold 4H Outlook – Buy the Dip or Fade the Drop?Gold on the 4H timeframe is consolidating below 3,600 after a strong bullish run. Current structure shows price resting near premium levels, with liquidity building both above 3,600 and below 3,530. This suggests engineered sweeps before the next expansion.
________________________________________
📌 Key Structure & Liquidity Zones (4H):
• 🔼 Buy Zone 3,572 – 3,574 (SL 3,565): Fresh demand zone sitting at intraday discount; potential continuation area.
• 🔽 Sell Scalp Zone 3,530 – 3,526 (SL 3,537): Short-term supply/pivot area; scalp opportunity if price rejects.
• 📍 Liquidity Magnet 3,603 – 3,605: Upside imbalance zone likely to be rebalanced.
________________________________________
📊 Trading Ideas (Scenario-Based):
🔺 Buy Setup – Demand Zone Reaction
• Entry: 3,572 – 3,574
• Stop Loss: 3,565
• Take Profits:
o TP1: 3,585
o TP2: 3,595
o TP3: 3,605
👉 Demand block aligned with bullish order flow. Look for liquidity sweep and rejection to resume trend.
________________________________________
🔻 Sell Scalp Setup – Short-Term Reaction
• Entry: 3,530 – 3,528
• Stop Loss: 3,537
• Take Profits:
o TP1: 3,520
o TP2: 3,510
o TP3: 3,500
👉 Intraday supply zone and pivot. Best used for quick scalps against trend, targeting downside liquidity.
________________________________________
🔑 Strategy Note
Bias remains bullish overall, but intraday shorts are valid for scalps. The cleaner setup is buying into 3,572–3,574 for continuation toward 3,600+. Smart money may sweep liquidity at 3,530 before reversing higher.

GBPUSD – Buyers Are Gaining Momentum!OANDA:GBPUSD Looking at today’s chart, it’s hard to ignore the strength of GBPUSD. Price continues to climb steadily within a rising channel – a clear sign that momentum remains with the buyers.
The recent break & retest was the highlight: price broke above resistance, pulled back to test it, and then bounced higher. A textbook setup that reinforces confidence the uptrend is far from over.
The next destination? The upper boundary of the channel around 1.3700. If buying pressure holds, GBPUSD could very well extend into another strong bullish leg.

Gold 1H – Breakout Liquidity Trap Ahead of ExpansionGold on the 1H timeframe is consolidating near 3,652 after sweeping discount liquidity and reclaiming structure. Price has tapped into the breakout zone and is now positioned between premium scalp supply and higher liquidity pools. The structure suggests engineered plays into 3,656–3,658 or deeper liquidity toward 3,672–3,674 before expansion. Discount demand remains protected at 3,614–3,612.
________________________________________
📌 Key Structure & Liquidity Zones (1H):
• 🔴 SELL ZONE 3,672 – 3,674 (SL 3,679): Premium supply pocket for engineered rejection targeting 3,660 → 3,650 → 3,640.
• 🔴 SELL SCALP 3,656 – 3,658 (SL 3,663): Short-term premium sweep zone for intraday liquidity grabs targeting 3,645 → 3,640.
• 🟢 BUY ZONE 3,614 – 3,612 (SL 3,607): Discount demand block aligned with bullish order flow targeting 3,630 → 3,640 → 3,655.
________________________________________
📊 Trading Ideas (Scenario-Based):
🔻 Sell Setup – Premium Scalp Rejection
• Entry: 3,656 – 3,658
• Stop Loss: 3,663
• Take Profits:
TP1: 3,645
TP2: 3,640
👉 Intraday scalp opportunity if price sweeps into shallow premium liquidity.
🔻 Sell Setup – Deeper Premium Sweep
• Entry: 3,672 – 3,674
• Stop Loss: 3,679
• Take Profits:
TP1: 3,660
TP2: 3,650
TP3: 3,640
👉 Expect engineered sweep into higher premium before reversal.
🔺 Buy Setup – Discount Demand Reaction
• Entry: 3,614 – 3,612
• Stop Loss: 3,607
• Take Profits:
TP1: 3,630
TP2: 3,640
TP3: 3,655
👉 High R:R play if price retraces to protected demand before expansion.
________________________________________
🔑 Strategy Note
Smart money is likely to manipulate both premium and discount zones around the breakout point. Bias favors:
• Scalp sells at 3,656–3,658
• Swing sells at 3,672–3,674
• Discount buys at 3,614–3,612
Risk management is critical — expect liquidity sweeps both sides before real expansion.

COFFEE Price Rising – Is a Correction Ahead?Hello everyone, what do you think about PEPPERSTONE:COFFEE ?
The price of COFFEE is quite interesting at the moment. It has been steadily rising and seems to be forming a familiar triangle pattern. If this pattern continues to develop, there’s a strong chance the price will continue to move upwards. However, I will wait for a strong candle to confirm the signal before making a decision.
My target is 427 , but if the price drops below the triangle, we might see a short-term correction, and we’ll need to reassess.
👉 Do you think the price will continue to rise or is a correction ahead? Share your thoughts in the comments!
Note: This is not financial advice, just a personal view on the chart. Wishing everyone safe and successful trading! 😊
