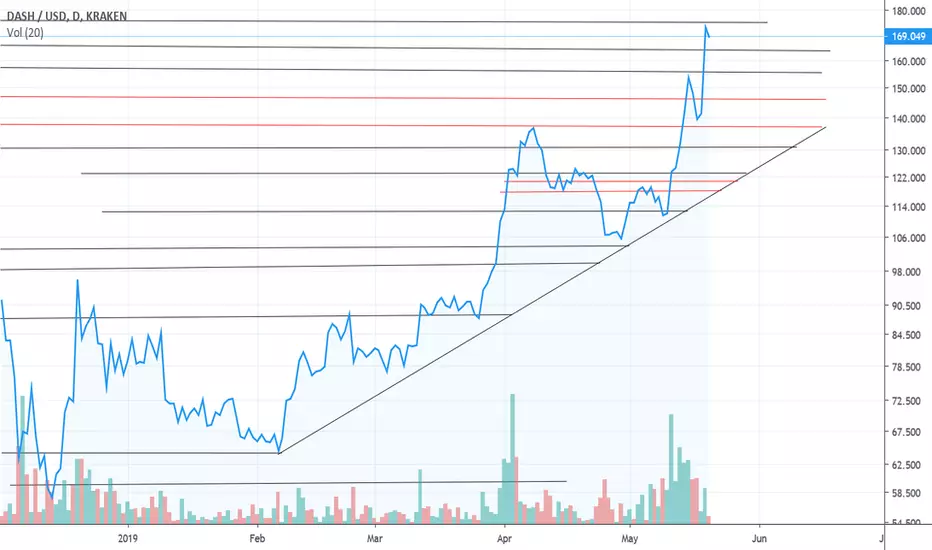
Is Dash going to make 2019 ATH's soon?It appears as though #Dash is trading in an Ascending Triangle.
If #BTC dumps or pumps, it's possible Dash peroforms well in both scenarios.
Keep eyes on Neptune Dash, so far the correlation between Dash & the stock is gaining traction.
Time will tell per usual
Dashusd


An open gap on the DASH/USD 4H chartPrice action hates gap and this one will be filled. This means that DASH/USD price will reach $187.

Bull FlaG?It appears as though Dash is trading in a Bullish Flag on a larger time frame & a descending triangle on a smaller time frame.
I notice money flowing from BTC into Dash. I like to see this at these hours.
Pick your poison.
Time will tell per usual.

Dash is looking to Moon in the near term.I mentioned the other day in my previous post on Dash that between BTC & ETH, Dash was the only one to create a new higher high, very interesting.
Dash is now trying to break back above the Nov 6th 2018 "High" before the sell off into the crypto abyss, and stay above it to continue the bullish uptrend.
On this chart you can see that Dash is trading in what looks like a descending triangle, but we're going to break that soon enough, IMO.
Time will tell per usual.

What a fu*k!ng power move by Dash.I'm not sure if everyone noticed this or not, but Dash is the only one between BTC & ETH who actually created a new higher high during this recent pump today.
Let's hold "aggressive" support at 163ish USD, but at the moment Dash seems to be holding up fairly well.
Dash is also creating support above the BIG dump off in Nov 2018.
Time will tell per usual.
Dash has retraced & found support at previous high.Dash has found support right at the previous high of the last parabolic move, very bullish IMO.
It would be nice to see a test of $146ish USD & consolidate or continue to move higher.
$123ish USD is where "strong" support will be found.
Time will tell per usual.
DASH at key resistance NOW?!Price now trying to break resistance of 135$.
DASHUSDT showing us clear bullish setup with moving averages and price action. Targeting marked levels on the chart.

Dash is trading at 2019 ATH. March 30th I made I price target of $167.00 USD by the end of summer, but with the recent activity in the cryptocurrency space I'm thinking by the end of the week we may reach this level.
The next resistance on my chart is $147ish USD. And then $156ish USD.
Neptune Dash seen some heavily volume today with 11M shares traded on all the exchanges.

DASHUSD Buy SignalPattern: 1W Channel Up.
Signal: Bullish as every pull back is supported on both inner and outer Higher Lows.
Target: 198.000 (structured Higher High growth rate).


Dash, Next stop, $131.00 USD & $137.00 USD.In my previous post I talked about #Dash getting ready to make a move, we got that move.
Interesting times.

Is Dash ready to make move?On my previous chart Dash appears to have broken the trend, but when you ZOOM in & readjust the trend line that's not the case.
$109.00 USD is where the support on my chart is, I expect to see a strong bounce off this support if tested.
Time will tell per usual.
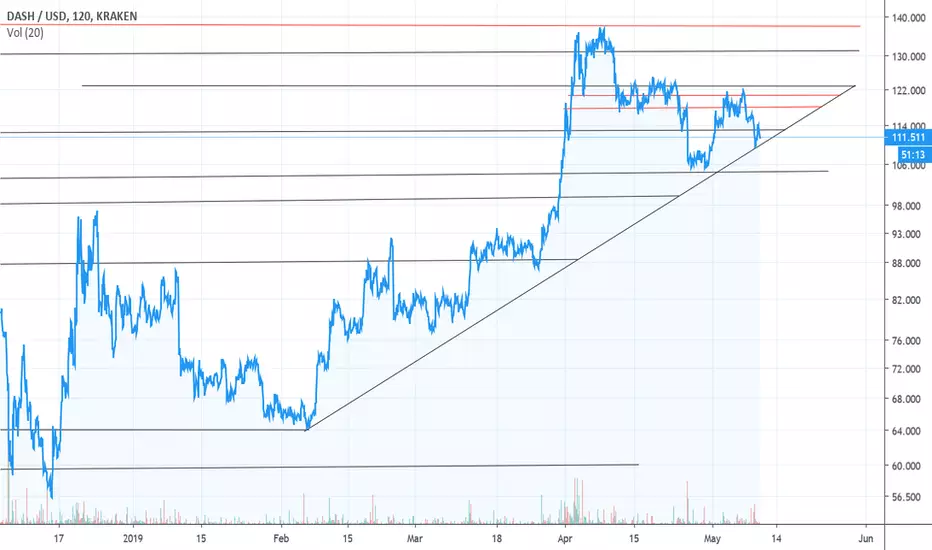

Dash is trading on the upward sloping trendline!Every time #DashForCash has traded on or below this trendline since February we've seen support come into the market.
Will the trend continue?
It's clearly visible that Dash is trading in an Ascending Triangle, and with the bullish sentiment coming into the market via Fidelity for example, I'm expecting Dash to outperform the majority of cryptocurrencies in 2019 & beyond.
Alt Thirty Six is just one example of how the Dash community is ahead of curve. Not to mention Venezuela & Colombia, give credit where it's due.
Time will tell per usual.

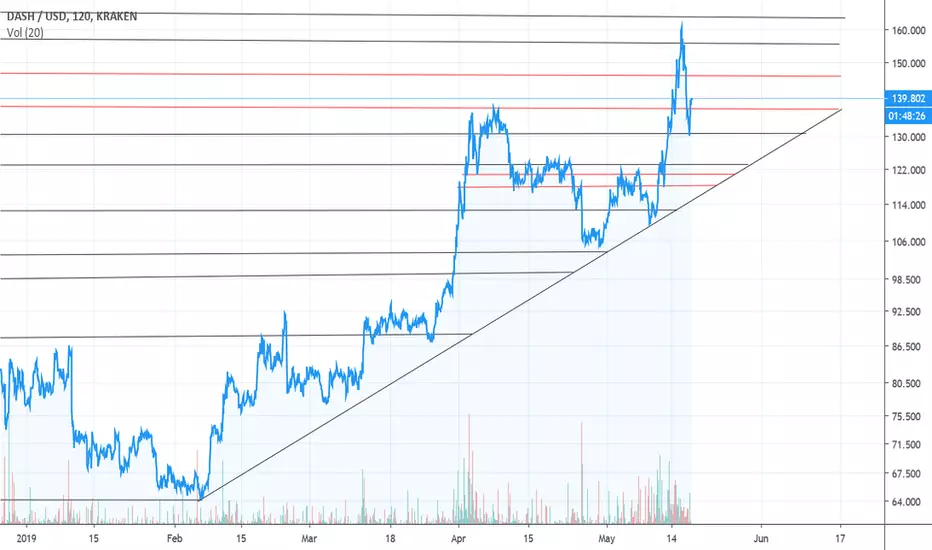
Dash has made a strong bounce off support.In my previous post i talked about Dash potentially make a large bounce off support, that has happened for the 4th / 5th time since Febuary this year.
It would be nice if Dash made a push to $122.00 USD & consolidated.
Then break flush out of the ascending triangle & retest the resistance at $138.00ish USD.
Keep your eyes on Neptune Dash if you're trading Dash, we may see some correlation start to take place once volume continues to pick up.
Time will tell per usual.
#DashForCash

DashDash looks the best out of the usd pairs, the chart is obviously similar to bitcoins, but it had its first pump a day before bitcoin did (might be something in that) and it bounced off the 200 Daily MA. So if bitcoin was to do nothing it might be able to pump out of the ascending triangle on its own. tight stop arounnd $129

Dash has found support, still trading in Ascending Triangle.I have posted several charts on Dash, and someone asked if Dash has broken out of the pattern.
If I ZOOM in on the same chart, you can see that Dash broke the pattern twice, or several time but bounced back into the ascending triangle each time. Very bullish, "IMO."
Time will tell per usual how this plays out, but I think by tmrw or the end of this week Dash will break through 113.00 USD & consolidate.
Maybe we get another Moon Shot & retest 122.00 USD, or 117ish.
It's always possible we trade sideways or take a little dive as well.
Keep eyes on Neptune Dash.

Ascending Triangle support line reaction bounce?This week should be interesting trading for Neptune Dash.
Every time Dash has traded below the trend line or on it since February Dash has went on a major run. Linked to this post is my recent chart on Dash about to make a bounce off support.

Dash - New Trading OpportunitiesLet's talk about Dash.
The market dropped from 140.00 resistance level and now the price bounces from SMA50. RSI and MACD histogram confirm the price reversal. DMI is bullish with the falling ADX line. The combination of these signals tells us that the correction movement probably is finished. The market can continue the upward trend. This reversal signal could be used for buying for the short term trading based on the lower timeframes.
But the market still has some potential and space for the downward movement. That's the main reasons why it's better to get an additional signal confirming the upward movement.
If the price bounces from SMA50 and breaks the downtrend line, we will be able to get such an additional signal. This breakout can be used for buying for the medium and the long run. Stop orders must be placed below 100.00 support level and profit targets at 140.00 and higher resistance levels based on the round numbers and the previous swing highs.

A trading opportunity to buy in DASHUSDTechnical analysis:
. Dash/Dollar is in a range bound and the beginning of uptrend is expected.
. The price is below the 21-Day WEMA which acts as a dynamic resistance.
. The RSI is at 39.
. While the RSI downtrend and the price downtrend in the daily chart are not broken, bearish wave in price would continue.
Trading suggestion:
. There is a possibility of temporary retracement to suggested support zone (104.000 to 84.000). if so, traders can set orders based on Price Action and expect to reach short-term targets.
Beginning of entry zone (104.000)
Ending of entry zone (84.000)
Entry signal:
Signal to enter the market occurs when the price comes to " Buy zone " then forms one of the reversal patterns, whether " Bullish Engulfing ", " Hammer " or " Valley " in other words,
NO entry signal when the price comes to the zone BUT after any of the reversal patterns is formed in the zone.
To learn more about " Entry signal " and the special version of our " Price Action " strategy FOLLOW our lessons:
Take Profits:
TP1= @ 139.000
TP2= @ 175.000
TP3= @ 210.000
TP4= @ 280.000
TP5= @ 410.000
TP6= @ 530.000
TP7= @ 640.000
TP8= @ 806.000
TP9= @ 982.000
TP10= Free

Dash is about to make a Major Bounce off support!I've been posting my charts on dash for a few weeks publicly now because I feel like it's ready to rip off some faces, so far so good.
Every time Dash has traded below this trend line or on it since February Dash has went on a major run.
Keep your eyes on Neptune Dash. Ticker symbol DASH on the TSX.V.
Time will tell per usual.
