DASH Breakout: Reversal or Trap?
Yello Paradisers, is this the beginning of a massive DASH reversal or just another fakeout that will punish impatient bulls?
💎#DASHUSDT has just broken out of a well-defined Falling Wedge formation, a classic bottoming pattern that often signals the end of a correction and the start of a new bullish phase. The move comes after a strong bounce from the major demand zone around $45–46, a level that has consistently attracted buyers and proven itself as a high-liquidity reaction area.
💎The breakout above the descending trendline shows that sellers are losing control, but the structure still demands confirmation. What matters now is whether the market delivers a clean retest. Ideally, a pullback toward the broken trendline or a dip back into the upper portion of the $45–46 demand zone would serve as a strong confirmation and potential entry trigger for the next impulsive move.
💎If buyers step in with strength on the retest, #DASH could start grinding higher toward the first resistance around $49–50, and if momentum sustains, the price may even push toward the more significant resistance region near $55.
💎That said, this structure is still fragile. A failure to hold the demand zone, particularly if price breaks below $44, would invalidate the bullish scenario and put DASH back at risk of deeper downside.
It’s not about being early, it’s about being right. Stay sharp and don’t let emotions dictate your trades. That’s the only way you make it far in this game.
MyCryptoParadise
iFeel the success🌴
Dashusdanalysis

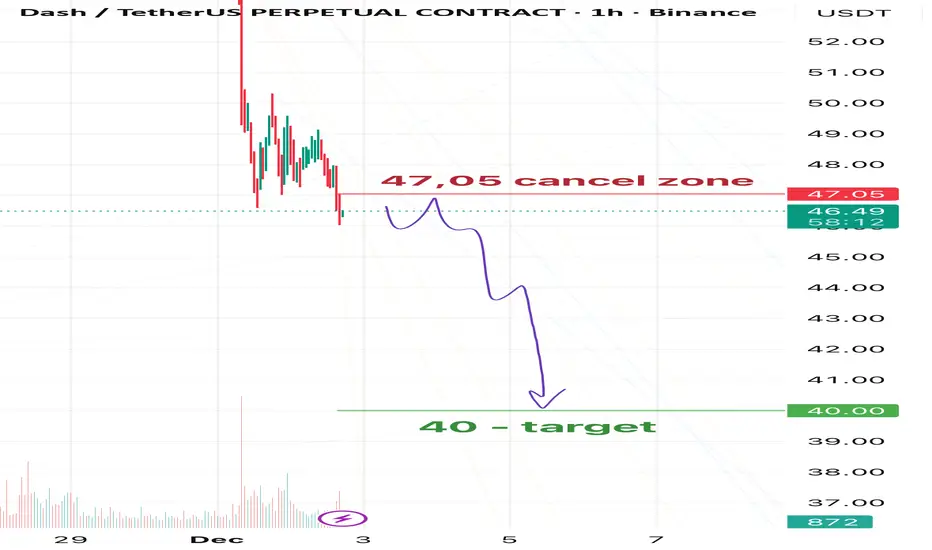
DASH - Bearish continuation expectDespite the already suspicious and sharp collapse we’ve seen in DASH, there is still absolutely zero evidence of any meaningful bullish reversal or even a proper bounce. The structure remains heavily bearish: lower highs, lower lows, weak volume on any attempts to recover, and price continues rejecting every key resistance level.
🎯My primary downside target: 40.00
❌Invalidation level (plan cancelled if we clearly break and close above): 47.05
As long as price stays below 47.05, the path of least resistance remains down. The recent dumps look far from exhausted, and the overall crypto market isn’t giving any relief to privacy-coin laggards like Dash.
Short-term bearish bias stays intact.
Trade safe!
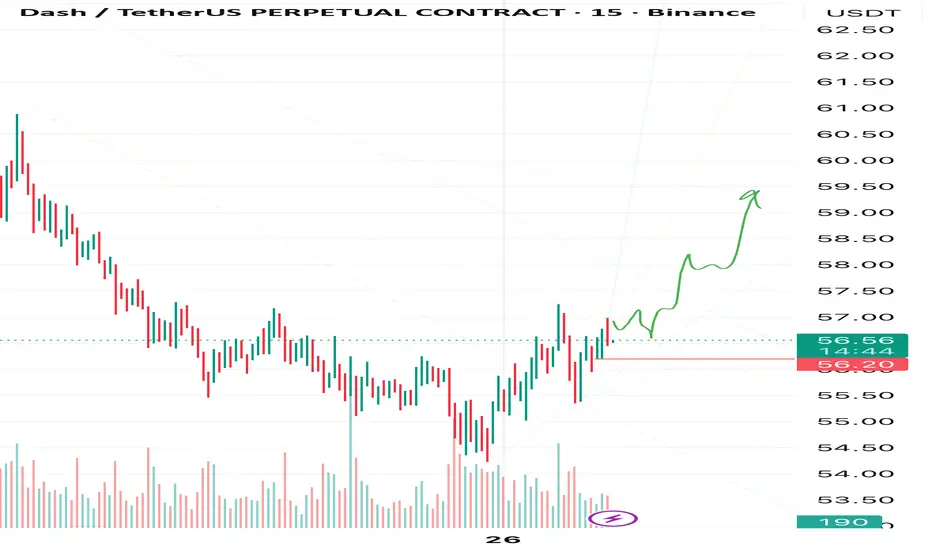
DASH: Ready to Remind Everyone Why It Used to MoonIt looks like DASH has fully digested that brutal correction, soaked up liquidity below the range, and is now coiling for another legendary leg up. The old king of privacy coins still knows how to shoot when least expected.
Target: 59.4
Invalidation: 56.2
⚠️ Disclaimer: This is not financial advice. Cryptocurrency trading involves significant risk and can result in the loss of your entire capital. Always do your own research and only trade with money you can afford to lose.
If you’re riding this move with me — smash that Like button, drop a 🚀 in the comments, follow for more alts that are waking up, and turn on notifications so you never miss the next one!
Let’s see if DASH still has that 2017 magic left in it. Who’s in? 👇
DASHUSDT - Another Leg up ahead!DASH has gained over 300% in the past few weeks and is now in a healthy correction. It formed a consolidation and a falling wedge pattern, which it broke and successfully retested.
It’s starting to climb again.
A golden cross has formed, which should give it the momentum to break the 0.618 Fibonacci resistance, potentially pushing it past the $180 level
Best Regards:
Ceciliones🎯

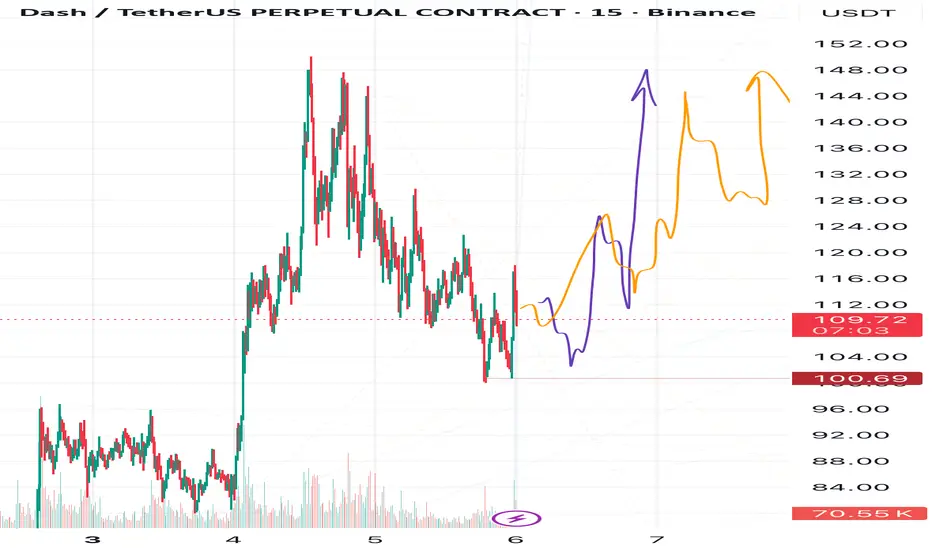
Dash in a Slow and Steady ClashIn my view, DASH is slowly gaining strength before reaching for new highs.
And it will definitely need that strength — the $150 level won’t be easy to break.
For now, I’m not setting that as a target, since the coin might move sideways between $110–146 before it’s ready to cross $150.
I currently see two possible scenarios, shown by the orange and purple arrows on the chart.
🎯 Target 1: $128
🎯 Target 2: $146
❌ Invalidation: $100.69
After some accumulation near $150, DASH might fly to $180, and later to $210 — but since I’m a bit pessimistic about Bitcoin right now, I prefer to stay cautious and not set those ambitious targets yet.
⚠️ Disclaimer:
This is not financial advice — just my personal market view for educational purposes only.
💬 Follow me so you don’t miss the next updates on DASH and other coins!
Dash is Back — Ready to Attack!Hey friends! 👋 How are you feeling after today’s drop?
Let’s talk about Dash.
In my opinion, Dash is finally ready to move toward my long-awaited targets at 100 and then 120.
My previous forecast didn’t play out as expected, since Dash entered the invalidation zone I mentioned earlier.
This time, the invalidation zone is at 83.70.
I currently have two possible scenarios for Dash — all shown on the chart with arrows of different colors. Each color represents a slightly different path the price could take before the next major move.
Let’s see which scenario the market chooses this time! 🚀
Disclaimer:
This is not a trading signal or financial advice.
Always make your own decisions based on your risk management, and never trade without stop-losses.

DASHUSDTI think if the uptrend continues and BINANCE:DASHUSDT can break out above $50, it could gain bullish momentum toward $65.
⚠️Please control your risk.

Dash on the Move — Bulls ApproveI expect DASH to rise toward 52, then 56, and later 68.
Two possible paths:
either it reaches 52, makes a pullback to current levels, and then moves up to 56,
or it goes straight to 56 without a pause.
In both cases, this move is part of a corrective triangle ABCDE,
with an upside breakout expected afterward —
which could take DASH even beyond 68 in the foreseeable future.
🎯 Targets:
• Target 1: 52
• Target 2: 56
• Global target: 68
Green — nearest growth potential.
Red — invalidation zone.
Let’s see which path DASH chooses 👀
Stay tuned for updates 🔔

#DASH/USDT#DASH
The price is moving in a bearish channel on the 12-hour frame and is largely sticking to it
We have a green support area at 26.00 that is expected to be bounced from due to its strength
We have a trend to hold above the Moving Average 100, which is strong support for the rise
We have very strong oversold resistance on the RSI indicator to support the rise with a strong uptrend
Entry price is 29.00
The first goal is 31.83
Second goal 34.24
The third goal is 37.00

Dash usdt accumulation Dash is in a weekly accumulation zone and has entered a corrective bearish pattern. The likely end result will be a price breakout pattern. The breakout will begin after the price breaks above $77, but it's a good idea to buy at these prices. The targets are clearly shown in black on the chart, but not all price targets will necessarily be reached.

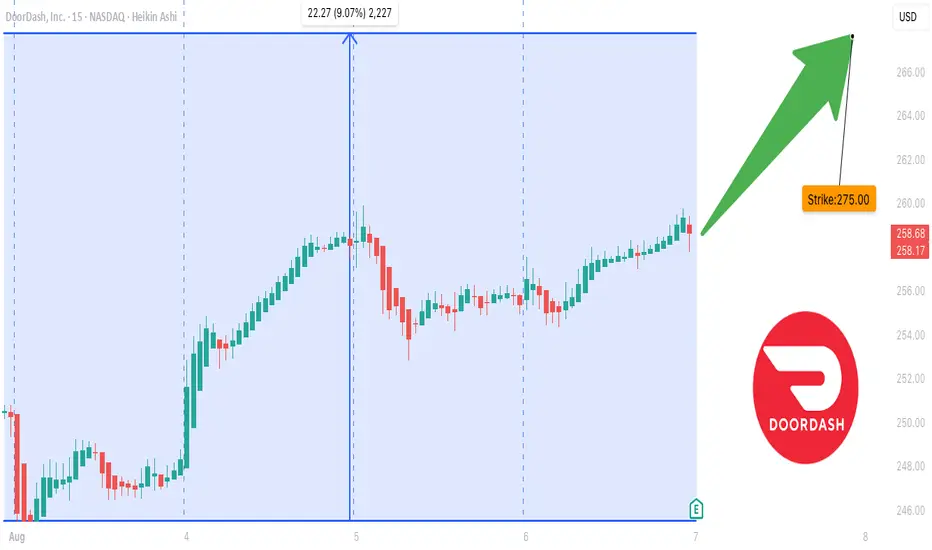
DASH Earnings Print Incoming ## 🚨 DASH Earnings Play (Aug 6) – Bullish Call Setup 🚨
**DoorDash (DASH) Gearing Up for a Big Move Post-Earnings?**
### 🧠 Key Thesis:
Analysts are turning **bullish** ahead of earnings, and the **options market is lighting up with call activity**—particularly at the **\$275–\$280 strikes**. With **IV climbing** and **O.I. stacking**, this setup is looking ripe for a post-earnings pop.
---
### 🔍 Snapshot Summary:
| Category | Score (/10) | Insights |
| --------------- | ----------- | ------------------------------------------------------------- |
| 📊 Fundamentals | 6 | Analyst upgrades suggest optimism despite margin concerns. |
| 💥 Options Flow | 7 | Bullish skew, strong OTM call buying, especially \$275/\$280. |
| 📈 Technicals | 4 | Limited history, but \$265 resistance in play. |
| 🌐 Macro | 5 | Inflation risk vs. discretionary rebound potential. |
🧮 **Overall Conviction**: **Moderate Bullish (70%)**
---
### 🔧 Trade Setup:
**💡 Strategy**: Buy Call Option
**📍 Strike**: **\$275**
**🕰 Expiry**: **Aug 08, 2025**
**💰 Entry**: \~\$4.90
**🎯 Target**: \$14.70
**🛑 Stop**: \$2.45
**📏 Size**: 1 contract (\~2% portfolio)
🔢 **Risk/Reward**: 3:1
📈 **Expected Move**: ±\$8.50
📊 **IV Rank**: 0.65
📆 **Earnings**: Aug 6 (After Market Close)
---
### 🧠 Why It Matters:
> **Smart money is leaning CALL-heavy with clear strike clustering.** Add to that the analyst optimism and macro tailwind potential—this could be the setup that prints 🚀
---
### 🔁 Exit Plan:
* ⏱ **Time-based**: Exit within 2 hours post-earnings if target not hit.
* 💎 **Profit**: Limit at \$14.70
* 🛡 **Risk Control**: Stop at \$2.45
DASHUSDT 2D AnalysisDASH ~ 2D Analysis
#DASH Buy back gradually from this support block with short term target of at least 15%+ , Long term target $65

DASHUSDT 2D AnalysisDASH ~ 2D Analysis
#DASH If you still have a Conviction on this Coin, Maybe this support block you can consider to start buying back from here with a short -term target of at least 15%+.

DASHUSDT 1WDASH ~ 1W Analysis
#DASH Support that you might be able to consider to start buying back from here with a minimum target of 20%+.
Reason, This is the lowest support for now.

DASHUSDT 1WDASH ~ 1W
#DASH If you still have Conviction on this coin,. buy gradually on this support block with a target of at least 20%+

Bought from the Green BoxThe green box on the chart represents a significant buyer zone, and I executed a long position after observing price action within this area. This analysis will break down why the green box was identified as a demand zone and my expectations for DASHUSDT's movement.
1. The Significance of the Green Box
The green box marks a strong demand area where buyers have previously stepped in, making it a high-probability zone for a bounce.
Key Support Zone: This area aligns with historical support levels and technical confluences, reinforcing its strength.
Market Structure: Price has maintained higher lows above this zone, signaling a bullish continuation pattern.
Volume Confirmation: Increased buying volume near the green box suggests active demand.
2. Why I Bought Here
The decision to buy was based on the following confirmations:
Price Action Signals: A bullish reversal pattern formed within the green box, confirming buyer interest.
Fibonacci Retracement: This zone aligns with the 0.618–0.786 retracement of the previous upward swing, a classic area for reversals.
Oversold Conditions: Momentum indicators like RSI showed oversold conditions, adding confidence to the buy decision.
3. Current Expectations
Based on the price action and market structure, I anticipate the following scenarios:
Primary Target: The first target is set at the nearest resistance level, which aligns with previous highs around $XX.XX.
Secondary Target: If momentum continues, the second target is the $XX.XX level, corresponding to a Fibonacci extension level.
Stop-Loss Placement: My stop-loss is set just below the green box to minimize risk in case of invalidation.
4. Strategy and Risk Management
Risk management is a crucial part of any trade, and here’s how I’m handling it:
Risk-to-Reward Ratio: The trade offers a 1:3 risk-to-reward ratio, balancing potential gains against downside risk.
Monitoring Key Levels: I’ll be closely watching for volume spikes and resistance breakouts to validate the bullish momentum.
Adjusting Stops: As the price moves toward the target, I plan to trail the stop-loss to secure profits.
5. Final Notes
The green box represents a well-defined buyer zone backed by multiple technical factors. I’ll remain patient and let the trade develop while managing risk effectively.
I keep my charts clean and simple because I believe clarity leads to better decisions.
My approach is built on years of experience and a solid track record. I don’t claim to know it all, but I’m confident in my ability to spot high-probability setups.
My Previous Analysis
🐶 DOGEUSDT.P: Next Move
🎨 RENDERUSDT.P: Opportunity of the Month
💎 ETHUSDT.P: Where to Retrace
🟢 BNBUSDT.P: Potential Surge
📊 BTC Dominance: Reaction Zone
🌊 WAVESUSDT.P: Demand Zone Potential
🟣 UNIUSDT.P: Long-Term Trade
🔵 XRPUSDT.P: Entry Zones
🔗 LINKUSDT.P: Follow The River
📈 BTCUSDT.P: Two Key Demand Zones
🟩 POLUSDT: Bullish Momentum
🌟 PENDLEUSDT: Where Opportunity Meets Precision
🔥 BTCUSDT.P: Liquidation of Highly Leveraged Longs
🌊 SOLUSDT.P: SOL's Dip - Your Opportunity
🐸 1000PEPEUSDT.P: Prime Bounce Zone Unlocked
🚀 ETHUSDT.P: Set to Explode - Don't Miss This Game Changer
🤖 IQUSDT: Smart Plan
⚡️ PONDUSDT: A Trade Not Taken Is Better Than a Losing One
💼 STMXUSDT: 2 Buying Areas

DASHUSDT Breaks Channel: Bullish Surge Ahead!BINANCE:DASHUSDT Technical analysis update
DASHUSDT has formed a descending channel pattern on the daily chart, breaking above the channel's resistance line. The price is currently trading above the 100 and 200 EMAs. A strong bullish move can be expected once the breakout is confirmed on the daily chart.

DASH Price ActionDASH is currently in a bearish trend and has been moving under a trend line for approximately 157 days. The chart clearly shows the price making lower highs and lower lows, respecting the boundaries of this channel.
Currently, the price is consolidating on the support zone Green. For a bullish move, the price of DASH must break above the trend line. This resistance has acted as a barrier to the price, preventing any significant upward movement.
On the other hand, if the price fails to hold the support zone Green and breaks below this zone it is likely to test the lower support.

DASHUSD 1WDASH ~ 1W
#DASH This is the Bottom Support Block for $DASH.
We will consider making a small purchase here with a minimum target of 20%+.

DASH LONG BULLISH IDEASDash last bottom zone is $ 25 for me and I think I will buy from there if it falls. I think these two scenarios will develop, stay tuned. fibonacci levels are very important.

DASH Hello Traders,
As posted last week regarding Dash I was expecting a sharp drop as the leveraged longs were really very high.
Obviously, the whole market in general fell not only Dash, including Bitcoin,Stocks and indices resulting in a strengthening of the dollar and gold driven by the news of the Iran-Israel war but you have to see the whole thing also as a catalyst moment for this kind of technical movements.
At the moment we can accumulate spot to sell at higher levels above 100 usd.
Have a good weekend.


Dash We can see that dash touched the trendline and we are in great support
We can enter betwean 28 $ 28.5$
And targets are
31$
38$
54$
140$
🚀🚀🚀🚀🚀🚀⌛️⌛️⌛️⌛️⌛️
