DASH/USDT Is Testing the Downtrend Wall — Major Move Incoming?DASH/USDT is approaching a critical decision point that could define its next major trend.
Price has been suppressed under a dominant descending trendline since early November, and now the market is once again testing this structure — a technical barrier that has repeatedly rejected buyers.
But there’s a key development:
Bearish momentum is weakening.
The recent series of small higher-lows and tightening volatility indicates compression — a classic precursor to a large expansion move.
The horizontal levels shown (55 – 62 – 70 – 83 – 98 – 135) aren’t just resistance lines;
they are liquidity pockets where strong reactions historically occur.
---
📈 Bullish Scenario (Potential Large Reversal)
A confirmed breakout above the descending trendline and a 4H close above $55 would signal a major shift in structure.
If the breakout is validated:
Target 1 → $62
Target 2 → $70 (key psychological zone)
Target 3 → $83
Target 4 → $98
Target 5 → $135 (full recovery zone)
A clean breakout could mark the beginning of a mid-term trend reversal after weeks of downward pressure.
---
📉 Bearish Scenario (Rejection & Continuation)
If price gets rejected again at the trendline, sellers remain firmly in control.
A strong rejection would open the door to:
Support 1 → $44
Support 2 → $41 (major local low)
Break below $41 → new lower-lows likely, extending the broader downtrend
A sharp bearish candle at the trendline typically signals aggressive selling from larger participants.
---
📌 Key Pattern
Dominant Descending Trendline → guides the entire bearish structure
Compression Price Action → volatility tightening near a major decision point
Potential Trend Reversal Pattern if price breaks above trendline
Liquidity Layering → horizontal levels mark key liquidity pools
The market is now sitting in a “Decision Zone” — a spot where the next major move is usually born.
---
🎯 Summary
DASH is at a rare technical moment:
A retest of the primary trendline that separates reversal from continuation.
Breakout → Trend shift
Rejection → Bearish continuation
This is a moment for confirmation, not prediction.
#DASH #DASHUSDT #CryptoAnalysis #TechnicalAnalysis #BreakoutSetup #TrendReversal #MarketStructure #PriceAction #LiquidityZones
Dashusdtanalysis

DASH/USDT - Ready for a New Rally? Strong Trendline Break?DASH is entering a highly critical phase. After a deep corrective move, the price has finally broken above the main downtrend line, which has been suppressing every bullish attempt for several sessions. This breakout is not just a casual push — it occurred exactly after the market retested the strong demand zone at $83–$75, an area that has repeatedly acted as an accumulation block for larger players.
The market structure paints a clear story:
Impulsive rally toward $150 → distribution → controlled retracement.
A series of lower highs → well-defined downtrend → bearish pressure gradually fading.
Strong 4H breakout above the trendline → early trend reversal signal.
DASH now stands at an inflection point. Buyers successfully defended the demand zone, and the next move will determine whether this breakout evolves into a full bullish reversal or simply a temporary relief rally.
---
Bullish Scenario (Rising Momentum + Structural Shift)
If the buyers maintain this momentum, the bullish setup becomes very compelling:
1. Successful retest/hold above the broken trendline → validation of the reversal.
2. Clean 4H breakout above $96.9 → opens the next range.
3. Upside targets become:
Target 1: $105
Target 2: $134 (major supply zone)
Primary Target: $149–150 (previous swing high)
A confirmed breakout above $134 would signal the start of a larger markup phase.
---
Bearish Scenario (If the Breakout Turns Into a Fakeout)
The bearish scenario activates only if price breaks back below the $83–$75 demand zone.
A 4H close beneath this region would:
Invalidate the bullish breakout
Shift structure back into bearish continuation
Confirm downside targets toward:
$68
$60
And in an extended selloff, a revisit to the $40 region.
This $83–$75 zone remains the final defensive line for buyers. As long as it holds, bullish bias stays intact.
---
Key Pattern Breakdown
Downtrend Breakout → transition from distribution to accumulation.
Demand Zone Rejection ($83–$75) → shows strong buy-side interest and potential structural reversal.
Potential Higher Low Formation → early stages of bullish trend development.
Continuation Potential if $96.9 is broken with strength.
These elements suggest that DASH may be preparing for the early phase of an uptrend — pending confirmation.
---
Technical Insight
Bulls have successfully defended structural support above the demand zone.
Momentum shift appears after the trendline break.
A confirmed 4H close above $96.9 will likely activate the next leg upward.
Any pullback into the $83–$75 zone remains a high-value accumulation area (as long as the zone holds).
#DASH #DASHUSDT #CryptoAnalysis #Breakout #Reversal #DemandZone #PriceAction #CryptoMarkets #TechnicalAnalysis

Dash Setup — One More Push, Then UpIn my view, the correction in Dash is coming to an end. I expect one little final move down before we see a potential shift to the upside.
As usual, I see two possible scenarios — along the purple or the orange path. In both cases, I’m expecting a slight drop first before the trend turns upward.
💹 Target: 88
❌Invalidation zone: 72.78
⚠️ Disclaimer: This is not a trading signal, just my personal market outlook. Always trade with stop-losses and manage your risk!
💬 Feel free to react, comment, and follow if you’d like to see regular updates!

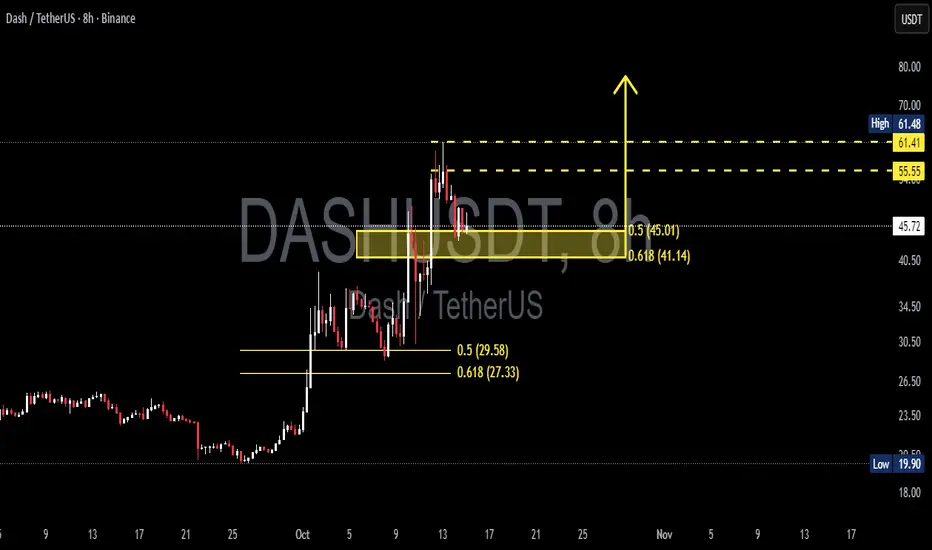
DASHUSDT — Decision Point at Golden Zone: Can Bulls Defend TrendThe price of DASH/USDT is now standing at a critical decision zone. After breaking out from a long consolidation phase, DASH experienced a strong rally toward 61.4 USDT, followed by a healthy correction into the golden pocket (0.5–0.618 Fibonacci retracement) area between 45.0–41.1 USDT.
This region now acts as the battleground between buyers and sellers, which will determine whether the bullish trend continues or fades.
---
🔶 Technical Overview & Key Levels
Timeframe: 8 Hours
Current Price: ~46.4 USDT
Key Zones:
Main Support / Retest Area: 45.01 – 41.14 USDT
Primary Resistance: 55.55 USDT
Major Resistance: 61.41 – 61.48 USDT
Next Supports (if breakdown occurs): 29.6 – 27.3 USDT
Major Low / Last Defense: 19.9 USDT
This corrective move toward the golden pocket shows a healthy retracement structure within an impulsive trend — suggesting that the market might be cooling off before attempting another leg higher.
---
🟩 Bullish Scenario — Golden Pocket as the Launchpad
If price can hold above 41.1 USDT and show strong bullish reaction (e.g., bullish engulfing candle, pinbar, or increasing volume), the golden pocket could become the launchpad for the next upward wave.
Bullish Confirmation:
8H close above 46.5 USDT
Increasing buy volume
Clear rejection wicks from 45–41 zone
Upside Targets:
TP1: 55.55 USDT (minor supply zone)
TP2: 61.4 USDT (previous high)
Stretch Target: 70.0 USDT if bullish momentum strengthens
Possible Strategy:
Conservative entry: After 8H close above 46.5
Aggressive entry: Within 43–45 zone with a tight stop below 41.0
---
🟥 Bearish Scenario — Failure to Defend the Golden Zone
If sellers manage to push the price below 41.1 USDT, with strong volume and a solid 8H close, the bullish structure weakens. This would signal potential for a deeper correction.
Bearish Confirmation:
8H candle closes below 41.1 USDT
Increased sell volume
Weak or no bullish reaction in the golden pocket
Downside Targets:
TP1: 29.6 USDT
TP2: 27.3 USDT
TP3 (final support): 19.9 USDT
Possible Strategy:
Enter short after 8H close below 41.1
Stop-loss above 45.0
---
📊 Pattern Structure
From a technical perspective, the current setup resembles a bullish flag / breakout retest pattern — where price pulls back gradually after a strong impulse.
The yellow box area highlights a potential accumulation or re-entry zone where buyers could step back in.
If DASH shows strong rejection candles or a surge in buy volume from this zone, it would validate the idea of the market recharging for the next upward leg.
---
⚖️ Conclusion
DASH is currently testing the golden Fibonacci zone (45–41 USDT) — a make-or-break area that will define the next medium-term move.
As long as price stays above this zone, the probability of a rebound toward 55–61 USDT remains strong.
However, a confirmed breakdown below 41.1 could trigger a deeper correction toward 30–20 USDT levels.
With volatility rising and structure tightening, DASH is entering a decision point — a zone where bulls must defend to maintain control, or risk a reversal led by sellers.
---
#DASH #CryptoAnalysis #TechnicalAnalysis #Fibonacci #CryptoTrading #Altcoins #PriceAction #MarketStructure #SwingTrade
DASHUSDT 2D AnalysisDASH ~ 2D Analysis
#DASH Buy back gradually from this support block with short term target of at least 15%+ , Long term target $65

DASHUSDT 2D AnalysisDASH ~ 2D Analysis
#DASH If you still have a Conviction on this Coin, Maybe this support block you can consider to start buying back from here with a short -term target of at least 15%+.

DASHUSDT 1WDASH ~ 1W Analysis
#DASH Support that you might be able to consider to start buying back from here with a minimum target of 20%+.
Reason, This is the lowest support for now.

DASHUSDT 1WDASH ~ 1W
#DASH If you still have Conviction on this coin,. buy gradually on this support block with a target of at least 20%+

DASHUSDT 1WDASH ~ 1W
#DASH If you still have Conviction on the coin,. Buy gradually within this support block,. with a minimum target of 20%++

DASHUSDT Elliott Waves AnalysisHello friends.
Please support my work by clicking the LIKE button👍(If you liked). Also i will appreciate for ur activity. Thank you!
Everything on the chart.
Midterm Trade.
Dead coin but should to show something coz from bottom we got upward impulse.
Entry: market and lower
Targets: 62 - 72 - (~80)
after first target reached move ur stop to breakeven
Stop: (depending of ur risk). ALWAYS follow ur RM .
risk is justified
Good luck everyone!
Follow me on TRADINGView, if you don't want to miss my next analysis or signals.
It's not financial advice.
Dont Forget, always make your own research before to trade my ideas!
Open to any questions and suggestions.

DASHUSDT AnalysisHello friends.
Please support my work by clicking the LIKE button👍(If you liked). Also i will appreciate for ur activity. Thank you!
Everything on the chart.
Entry: market and lower
Target: 100 - 125 - 145
after first target reached move ur stop to breakeven
Stop: (depending of ur risk). ALWAYS follow ur RM .
risk is justified
Good luck everyone!
Follow me on TRADINGView, if you don't want to miss my next analysis or signals.
It's not financial advice.
Dont Forget, always make your own research before to trade my ideas!
Open to any questions and suggestions.

DASHUSDT Analysis (LOCAL VISION)Hello friends.
Please support my work by clicking the LIKE button(If you liked).Thank you!
Everything on the chart.
Entry: market and lower
TP: 168 - 188 - 210
after first target reached move ur stop to breakeven
Stop: ~122 (depending of ur risk). ALWAYS follow ur RM .
Risk/Reward 1 to 5
risk is justified
Good luck everyone!
Follow me on TRADINGView, if you don't want to miss my next analysis or signals.
It's not financial advice.
Dont Forget, always make your own research before to trade my ideas!
Open to any questions and suggestions.

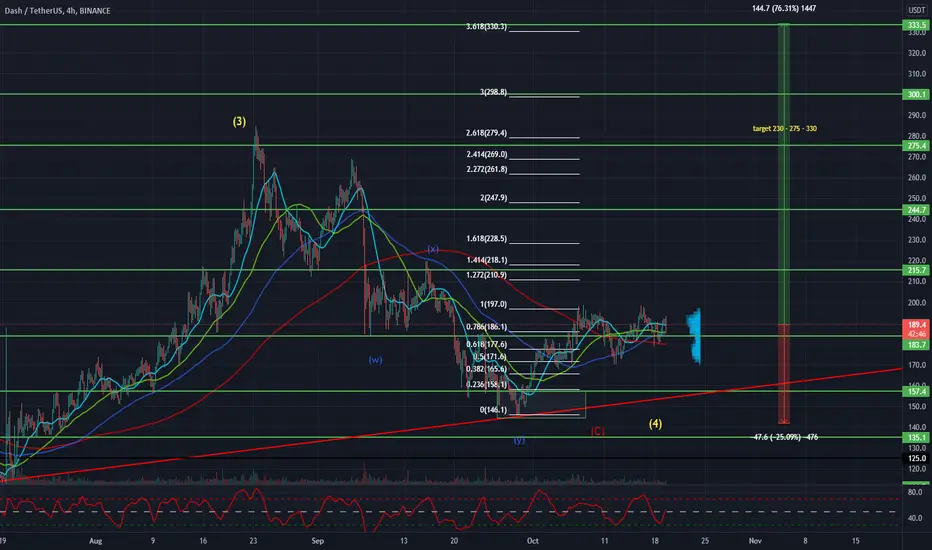
DASHUSDT AnalysisHello friends.
Please support my work by clicking the LIKE button(If you liked).Thank you!
Everything on the chart.
open pos: market and lower
target: 230 - 275 - 320
after first target reached move ur stop to breakeven
stop: ~under 142 (depending of ur risk). ALWAYS follow ur RM .
risk/reward 1 to 3
risk is justified
Good luck everyone!
Follow me on TRADINGView, if you don't want to miss my next analysis or signals.
It's not financial advice.
Dont Forget, always make your own research before to trade my ideas!
Open to your questions or suggestions.

DASHUSDT , Its ready to reach targetHello everybody
Its one the amazing privacy coin but its tired the holders and its do nothing but we think the compression of the price and the ... it happend and now its ready to go up and go to the moon step buy step
According to the chart you can see , the price in some months ago break the downward trend and now we are in upward trend , according to the chart , we were in correction of micro wave and now we supported the price from the support zone and the key level point and the first target is the end of the breakwave and ...
Guys entrance in position in lower time frame and check the chart in multi time , in 1h or 4h or 15 mins time frame then with nice R/r entrance in position and ENJOY YOUR PROFIT .
Good Luck
Abtin

DASHUSDT AnalysisHello friends.
Please support my work by clicking the LIKE button(If you liked).Thank you!
Everything on the chart.
open pos: market
target: 230 - 275 - 330
after first target reached move ur stop to breakeven
stop: ~140(depending of ur risk). ALWAYS follow ur RM .
risk/reward 1 to 3
Good luck everyone!
Follow me on TRADINGView, if you don't want to miss my next analysis or signals.
It's not financial advice.
Dont Forget, always make your own research before to trade my ideas!
Will be very APPRECIATE FOR UR DONAT/coins :)
Open to your questions or suggestions(Looking for investors!).