Last week Expected Ranges levels in actionQuick Recap: Last week Expected Ranges levels in action
What is Expected Range Volatility (ER)?
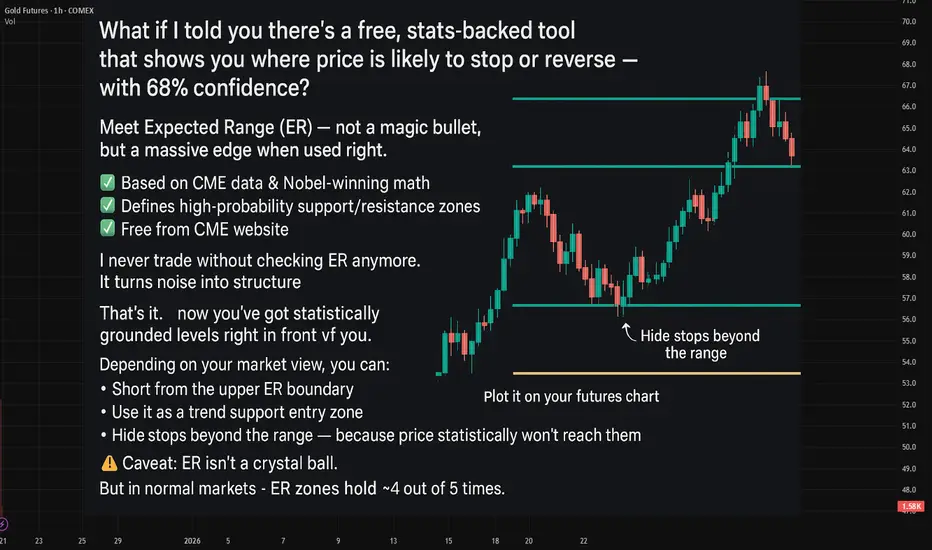
The Expected Range (ER) is a framework that helps traders understand how much an asset is likely to move within a specific timeframe. Based on CME market data and Nobel Prize-winning calculations, price movements within the expected volatility corridor have a 68%-95% probability of staying within those boundaries.
Crude Oil - 6 reactions to levels🔥
EUR - 4 reactions to levels
BTC - 3 reactions
GOLD - 1 reaction to levels
It's really an amazing tool to enhance your market entry💲
!!! - It doesn't guarantee trades every day.
!! it's better to combine it when working with the trend and when there's a clear sideways movement.
Datadriventrading
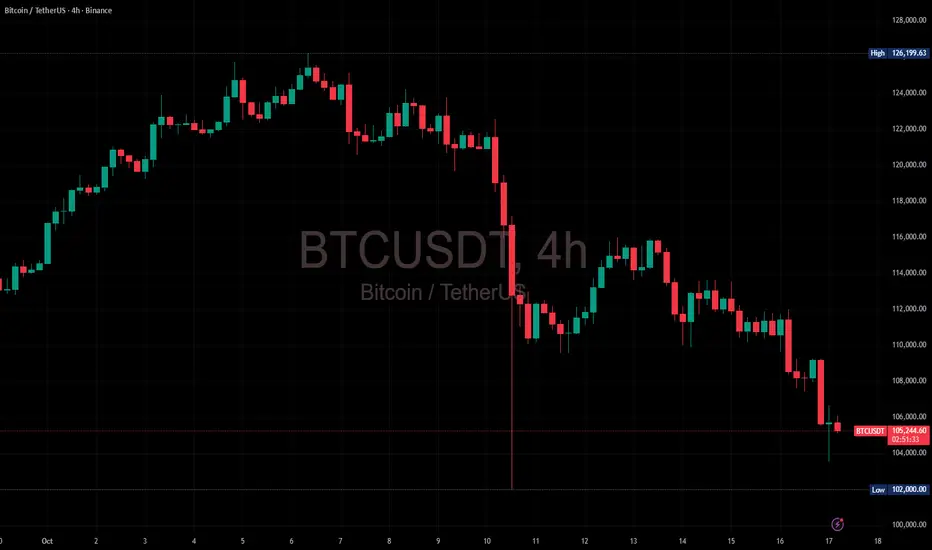
Bitcoin: From Green to Red — A Full Sentiment Shift in MotionAs illustrated in the chart, BINANCE:BTCUSDT has now transitioned cleanly from an uptrend (green candles) to a warning phase (yellow) — a signal that flashed just before Friday’s crash (excellent timing) then red candles.
The latest 4H chart confirms a clear downtrend, with price collapsing from the midline to the lower boundary of a machine-learning–derived trading channel. Selling pressure is mounting, and bears are firmly in control.
This transition is clearly visible in price, but the story doesn’t stop there.
Another ML-based tool, my composite sentiment indicator, turned negative back on Tuesday, October 7th (also great timming) and has since dropped deep into bearish territory. It reflects the emotional cycle turning from optimism to despair, perfectly aligned with the technical deterioration shown in the chart.
Statistically, my propietary trend strength index now reads 0.39 — well below the neutral 0.50 threshold. This means short-term selling pressure is dominating both medium and long-term momentum. The index combines multiple quantitative measures (Hurst Exponent, Sharpe Ratio, variance, and CAGR) to assess how “healthy” a trend really is. At present, it’s anything but healthy.
🧭 Conclusion
BTC’s current structure has progressed in perfect order: bullish → warning → bearish. All three pillars — technical, sentiment, and statistical — are aligned to the downside.
In short, this is not a buy-the-dip environment. Short-term rallies are better viewed as opportunities to enter short positions, not long ones.
A shift to a bullish bias would require all three signals to reverse:
1. Yellow then Green candles reappearing on the price chart (after a yellow phase).
2. A visible improvement in sentiment. (composite indicator returning to positive readings).
3. Statistical momentum index recovering to at least 0.50.
Until then, caution remains the strategy.
If you’d like to discuss building highly effective trading indicators, feel free to drop a comment below.
And if you’re curious about how my main crypto bot is approaching the market right now, check the first comment.
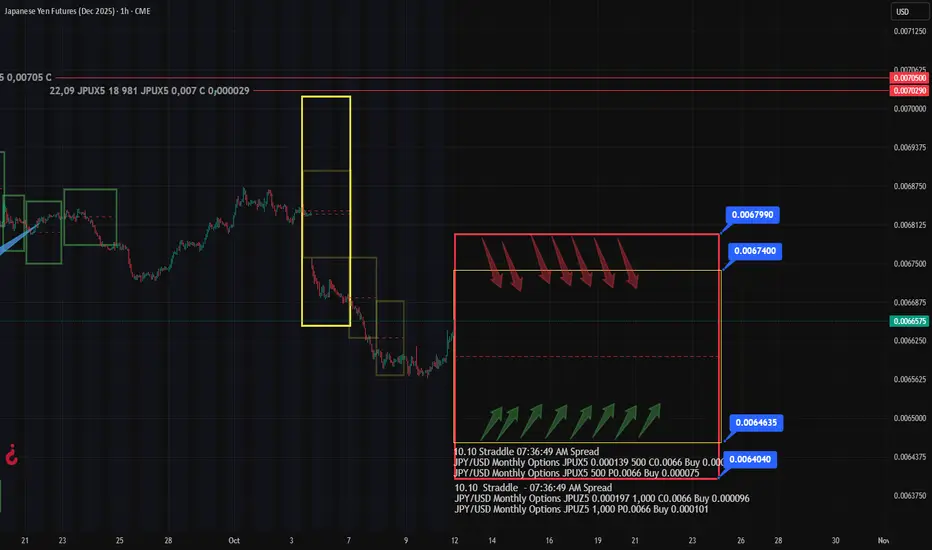
JPY Analysis & Outlook: Friday’s Options Flow Tells the StoryFriday’s trading on the options market revealed two key developments in JPY:
🔸 Two Straddles appeared in the current front-month expiry series
Plus a mid-sized Call Spread near 0.00675
Upper boundaries: 0.00674 and 0.006799 (marked on chart)
🔍 Key Takeaways:
Option traders are positioning likely for a correction in JPY futures after last week’s sharp drop.
But, Straddle isn’t a directional bet — it’s a volatility play with structure.
Call Spread is a a directional bet
As usual, when price approaches either Straddle boundary, option players will likely convert positions into synthetic calls or puts, reinforcing these levels as BE zones.
🎯 Strategic Levels:
0.00674 – 0.006799 → Potential resistance zone in the medium term
But here’s what’s interesting:
If you apply a Fibonacci retracement tool, the 61.8% level aligns almost perfectly with one of the already marked Straddle levels.
That kind of confluence?
It could attract additional downside liquidity from traders using Fib grids — especially those selling into "expected" reversal zones.
Is it a coincidence?
Sure, probably 😉
Bitcoin Chart Marks Its 2 Big Next Stops: $105K → $98KBitcoin has spent three months consolidating near record highs.
That kind of sideways grind usually ends with a liquidity hunt.
If the dollar finishes its current swing higher, Bitcoin likely tags the mid-range support zone next.
Two major downside targets remain on the map for the coming months.
Probability of a flush lower sits around ~80%
It’s a normal structural move: after heavy consolidation, price seeks liquidity before the next sustained leg.
Dollar drifts lower as U.S. growth stays hot—Q2 GDP +3.8% and a government-shutdown risk on deck.
Bitcoin presses $111K–112K resistance while whales quietly accumulate after recent liquidation spikes.
Price is at the hinge: soft USD supports risk, but volatility is loaded.
Trade the structure, not the noise.

: DXY & BTC – Macro Calendar Meets Key LevelsThe macro tape stays busy this week:
• Powell’s latest comments cooled equity risk.
• The Bank of England announced changes to its foreign-currency reserve management.
• OECD interim report flagged resilient but uneven global growth.
• Gulf central banks cut rates while the Fed stays cautious.
My Technical View
Price action shows weekly buyers losing momentum while the dollar still presses higher.
We’re trading around the volume-range midpoint, so expect chop, but momentum favors the dollar for now.
Key DXY Levels
Support: 110.600 – a decisive close below opens the path toward the 107-ish range.
Deep liquidity zone: 102-area remains a magnet for market-maker discounting if selling accelerates.
Higher-timeframe bias: still bullish range, so any short plays are tactical, not “hold forever.”
Bitcoin
BTC tracks macro flows closely; watch how it reacts if DXY tests those supports. A sustained dollar breakout could pressure BTC’s recent strength, while a DXY fade would give crypto another tailwind.
Plan
Stay patient around the mid-range chop. Let the daily closes decide if the 110.600 break is real before scaling positions.
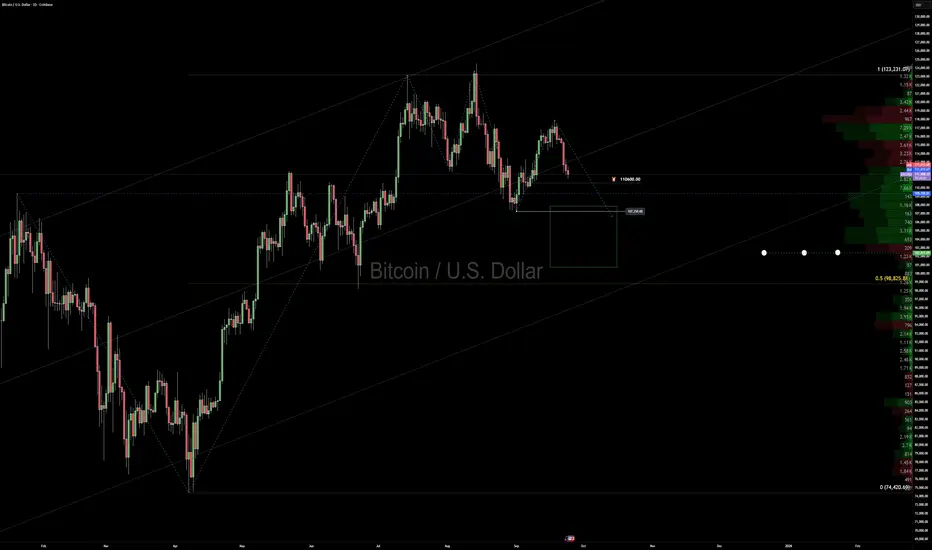
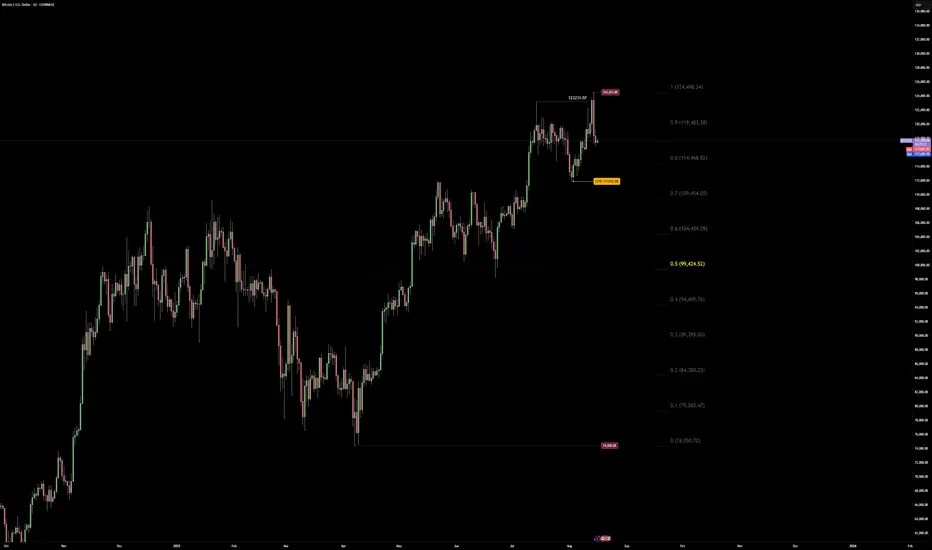
Bitcoin Traders — Time to Zoom OutBitcoin just got slapped down hard from the 124,533.00 zone — no surprise after 5 months of dollar weakness and BTC strength.
But:
Blindly chasing overstretched markets with hope and greed isn’t strategy — it’s gambling.
Now’s a good moment to pause. Ask yourself:
"Am I getting paid for this risk... or just getting emotional?"
If we break below the range low at 111,903.68, we could be headed straight toward the midpoint of this year’s range — and fast.
So stay sharp. Watch the macro fundamentals.
Don’t get caught in liquidity traps.
Stay patient, stay paid.
Game-changing analysis technique that will elevate your strategyAs many of my loyal followers know, my analysis toolkit goes beyond just the standard fare of CME options data and COT reports. I dive deeper, utilizing additional filters like the average long and short positions of retail traders. These insights are publicly available, and while I won’t name specific sources to avoid any hint of hidden promotion, I’ll give you a clue: look for a website with the word "book" in its title. 📚
For years, I’ve relied on this data, and it has proven to be both reliable and insightful. The average positions of market participants serve as both filters and indicators. But what do I mean by indicators?
Let’s break it down. When the price interacts with these levels, it reveals the market sentiment. For instance, if the price is below the average long position and breaks through easily, it’s a bullish sentiment. Conversely, if it hovers below the level and struggles to break through, that’s still bullish, as it indicates buyers are being drawn into profitable territory.
Now, let’s flip the script for the bears: if the price breaks down from above or struggles below the average short position, that’s a bearish sentiment. The price isn’t responding to sellers, dragging them into a profit land.
There’s more. Often, you’ll notice different behaviors near these key levels, allowing you to enter positions with an incredible risk/reward ratio of 3:1, 5:1, or even better! This clarity gives you insight into the current market mood—who’s being punished and who’s favored at that moment.
Now, let’s take a look at the screenshot of the British Pound futures chart. Here’s what you’ll see:
- A green line representing the average long position of retail traders.
- A red line for the average short position.
- The breakeven point of a put option contract for the June futures expiring on May 22, with 1,320 contracts at a strike of 1.295.
Take a moment to study the chart. What do you observe? 🤓
Ok, breathe in, breathe out. Tomorrow, we’ll dive deeper into this analysis. Don’t forget to subscribe so you won’t miss the continuation of this story! The insights I’ll share are definitely worth your time, as I aim to shift your perspective on the market by demonstrating a clear methodology without relying on indicators or technical patterns.
Stay tuned; it’s going to be incredibly valuable! 🚀✨

Why Should You Care About ER?🚀 Hey Traders! Have You Ever Felt Lost in the Chaos of Market Fluctuations?
What if I told you there’s a powerful tool that can help you cut through the noise and give you a statistical edge to predict SUPPORT and RESISTANCE movements with confidence?
Let me take 5 minutes of your time to introduce you to something that could transform your trading game: Expected Range Volatility (ER) .
What is Expected Range Volatility (ER)?
The Expected Range (ER) is a framework that helps traders understand how much an asset is likely to move within a specific timeframe. Based on CME market data and Nobel Prize-winning calculations, price movements within the expected volatility corridor have a 68% probability of staying within those boundaries.
💡 Key Insight: When the price approaching certain levels, there’s a 68% chance the price won’t break through those boundaries. This means you can use ER as a powerful filter to identify more precise entry and exit points for your trades.
Why Should You Care About ER?
When I first discovered the ER tool, it felt like stumbling upon a gold mine in the trading world. Here’s why:
It’s free and available on the CME exchange’s website.
It’s underutilized —95% of traders don’t even know it exists.
It provides statistical clarity in a world full of uncertainty.
I remember the first time I used ER in my analysis—it completely changed the way I approached intraday trading. Now, I never make a trade without checking the ER data. It’s become an essential part of my strategy.
How to Use ER in Your Trading
1️⃣ Input the Data: Head over to the CME website, plug in the necessary parameters, and get your ER values.
2️⃣ Set Boundaries: Use the ER range as a guide to set potential support and resistance levels.
3️⃣ Filter Trades: Only take trades that align with the ER framework to improve your precision.
A recent example is the Japanese yen futures market.
Don't be confused by the fact that we take futures levels, it can easily be plotted on a spot chart for forex market (the dollar/yen).
Limitations to Keep in Mind
While ER is a powerful tool, it’s not a crystal ball. Here are some limitations:
Market Dynamics: Short-term price movements can be unpredictable due to sentiment, news, or economic events. ER provides a statistical estimate, but it doesn’t guarantee outcomes.
Assumptions: The formula assumes price movements follow a log-normal distribution , which may not hold true in all market conditions.
Your Turn: Are You Using ER in Your Strategy?
💭 Here’s the million-dollar question: Are you leveraging the power of Expected Range Volatility in your trading? If not, why not start today?
💬 Share your thoughts in the comments below:
Do you currently use ER or similar statistical tools?
Want to Dive Deeper?
If you’re ready to take your trading to the next level, don’t miss out on our all-in-one resource designed to help you master tools like ER and other valuable sources to gain market edge!
🔥 Remember:
No Valuable Data = No Edge!

The Consistent Edge: A Strategy That Has Outperformed In a market that can be really hard to predict, being consistent is super important. My strategy has worked well over time and keeps doing better, no matter what the market looks like. I get real results because I use careful analysis and a clear plan that focuses on high-probability opportunities while also managing risks.
I believe in being honest and giving real value to everyone who follows me. I share not just my ideas but also explain how I make my decisions, so you can learn and improve your own trading skills.
Whether you're an experienced trader or just starting out, my advantage is staying ahead of trends without getting caught up in the hype. I focus on the right data and make smart decisions. The results speak for themselves—it's time to ignore the noise and find a strategy that really works.
Join me, and let’s improve your trading together with a proven strategy that you can trust.
#TradingStrategy #MarketEdge #ConsistentProfits #TechnicalAnalysis #ProvenResults #MarketInsights #TradingSignals #DataDrivenTrading #RiskManagement #FinancialFreedom
