Germany 40 :: Trend-Aligned Bullish Trade Setup📈 GERMANY 40 (DAX 40) INDEX - BULLISH PULLBACK CONTINUATION 🚀
Day/Swing Trade Strategic Entry Guide | CFD Market Opportunity
🎯 TRADING SETUP OVERVIEW
Asset: DAX 40 Index (German Blue-Chip Equities) 🇩🇪
Current Market Level: ≈ 24,896 - 24,950 EUR (As of Jan 27, 2026)
52-Week Range: 18,489.91 - 25,507.79 EUR
YTD Performance: +16.13% | Month Trend: +2.48% | Weekly: -1.72%
Market Trend: Bullish with Pullback Consolidation Phase ✅
📊 TECHNICAL ANALYSIS - PRICE ACTION SETUP
Bullish Thesis: SMA Pullback + Reversal Confirmation
✨ Strategy Structure:
Primary Trend: Uptrend Intact (ATH: 25,507.79 on Jan 13, 2026) 📈
Current Correction: Healthy consolidation zone between 24,400 - 24,950
Technical Signal: Simple Moving Average (SMA) pullback with support validation
Market Cycle: Transitioning from retracement phase → acceleration phase
🎪 ENTRY STRATEGY - TIERED LIMIT LAYER APPROACH
"Smart money enters at strength, not at desperation!" 💡
TIER 1 - AGGRESSIVE ENTRY (First Confirmation Signal)
Price Level: 24,700 EUR ✅
Rationale: Tests 61.8% Fibonacci retracement + Daily support zone
Risk Profile: Medium - Immediate technical resistance above
TIER 2 - OPTIMAL ENTRY (Recommended Sweet Spot)
Price Level: 24,800 EUR 🎯
Rationale: Key consolidation support + Previous PoC (Point of Control)
Risk Profile: Best Risk/Reward Ratio
Volume Profile Strength: High liquidity, support bounce evidence
TIER 3 - CONSERVATIVE ENTRY (Maximum Confirmation)
Price Level: 24,900 EUR 📍
Rationale: Final retest of recent swing high + SMA convergence zone
Risk Profile: Lower volatility entry, higher probability confirmation
Entry Execution: Use LIMIT ORDERS ONLY for superior execution
Avoid MARKET ORDERS (slippage risk in index trading)
Set entries 5-10 minutes before Frankfurt Open (8:00-9:00 CET)
Stack 3 positions across all tiers to maximize edge
🎲 TARGET LEVELS - PROFIT TAKING STRATEGY
PRIMARY TARGET: 25,500 EUR 🚀
Distance from Entry: +600 to +800 points
Technical Reason:
📌 Fibonacci Resistance Cluster (78.6% projection)
📌 Previous ATH breakout zone (25,507.79)
📌 Overbought RSI signals exit at this junction
📌 Institutional resistance + Order clustering
Risk Factor: Strong resistance confluences - expect rejection/consolidation
SECONDARY TARGET: 25,200 EUR ⭐
Conservative Exit: Take partial profits here (50% position)
Reason: Second resistance tier, risk management checkpoint
TRAILING PROFIT STRATEGY:
Lock gains at +400 points minimum
Trail stop-loss above recent swing lows
DISCLAIMER: Risk management is YOUR responsibility ⚠️
🛑 STOP LOSS MANAGEMENT - CAPITAL PRESERVATION
Recommended SL Placement: 24,600 EUR 💪
Distance from Optimal Entry (24,800): -200 points loss maximum
Technical Justification:
📍 Sits below key daily support pivot (24,412.21)
📍 Below 61.8% Fibonacci support zone
📍 If this breaks = trend reversal confirmed
Risk per Trade: 2-3% portfolio allocation recommended
AGGRESSIVE SL (For Strong Risk Appetite): 24,650 EUR
Tighter, reduces loss magnitude
Increases stop hunts/whipsaws probability
CONSERVATIVE SL (For Capital Preservation): 24,400 EUR
Allows more room for consolidation noise
Slightly wider but higher survival rate
⚠️ CRITICAL DISCLAIMER: Your stop-loss placement is YOUR decision based on risk tolerance. Don't copy blindly. Adjust to YOUR account size and risk parameters!
🔗 CORRELATED PAIRS TO WATCH - CONFLUENCE TRADING
POSITIVE CORRELATIONS (Move Together ↔️)
1. EUR/USD 💱 - EUROPEAN CURRENCY STRENGTH
Ticker: EURUSD / FX:EURUSD
Why It Matters: DAX composed of Eurozone exporters; EUR strength = DAX benefits
Current Level: ~1.1700 (Monitor resistance/support)
Watch Signal: Break above 1.1700 = additional bullish catalyst for DAX
Impact: 0.70+ correlation coefficient
2. EUROSTOXX 50 📊 - BROADER EUROPEAN EQUITIES
Ticker: ^STOXX50 / TVC:ESTX50
Why It Matters: DAX is largest component; often leads EStoxx movement
Setup Advantage: Confirm DAX strength via European sector index
Divergence Risk: If DAX rallies but EuroStoxx lags = weakness warning
3. S&P 500 / SPX 🇺🇸 - GLOBAL RISK SENTIMENT BAROMETER
Ticker: ^GSPC / TVC:SPX500
Why It Matters: Risk-on/risk-off appetite flows across Atlantic
Current Level: ~6,915 (Monitor Fed decision impact)
Correlation Context: 0.65+ during bull markets; weakens in crisis
Trade Signal: SPX strength > DAX often precedes 24-48hr DAX surge
4. FTSE 100 📍 - UK EQUITY BENCHMARK
Ticker: ^FTSE / TVC:UK100
Why It Matters: Close correlation to DAX; financials + commodities exposure
Monitor: If FTSE breaks key support = risk-off signal for DAX
INVERSE CORRELATIONS (Opposite Moves) ⚡
1. USD/INDEX 💪 - US DOLLAR STRENGTH
Ticker: DXY / USDINDEX
Why It Matters: Strong USD = headwind for DAX exporters
Watch: If DXY rallies above 109 = potential DAX pressure
Setup: Weakness in USD = tailwind for continental Europe stocks
2. VIX / VOLATILITY INDEX 😰
Ticker: ^VIX / CVIX
Why It Matters: Rising fear = risk-off = DAX weakness
Safe Zone: VIX below 18 = bullish backdrop for DAX
Warning Signal: VIX spike above 25 = trend reversal risk
📰 FUNDAMENTAL & ECONOMIC FACTORS - MACRO DRIVERS FOR 2026
🇩🇪 GERMAN ECONOMIC STRENGTH NARRATIVE ✅
1. FISCAL STIMULUS BOOST 💰 (Major Positive)
€127 Billion Defense + Infrastructure Spending (2026):
Government approved new €500B special fund for infrastructure
Defense spending exempted from debt brake (1%+ of GDP)
Multiplier effect expected Q2-Q4 2026
Impact on DAX: Infrastructure/defense contractors (Rheinmetall, Airbus) → Upside
Status: Already approved, beginning implementation phase
2. ECONOMIC RECOVERY TRAJECTORY 📈
Bundesbank Forecast: GDP stagnation 2025 → +1.2% growth 2026-2027
Growth Driver: Export resurgence starting Q2 2026
Manufacturing Momentum: German Composite PMI = 52.5 (3-month high, Jan 2026)
Implication: Peak pessimism already priced in; upside surprise likely
3. INFLATION NORMALIZATION ✨ (Supportive for Equities)
German HICP Inflation: 2.0% (Dec 2025) - At ECB 2% target!
Forecast Path: 2.1% (2026) → 1.9% (2027) → 2.0% (2028)
Real Wage Growth: +8.5% minimum wage increases announced
Equity Impact: Lower inflation removes rate hike fears; supports valuations
4. ECB POLICY STANCE 🏦 (Supportive Hold)
ECB Rate Decision: HOLD at 2.0% deposit rate through 2026
Rationale: Inflation at target (2%), growth resilient at 1.4%
Next Hike Expected: Mid-2027 only (if inflation accelerates)
Market Impact: Monetary accommodation extended; liquidity supportive
⚠️ HEADWIND FACTORS TO MONITOR 🚨
1. US TARIFF UNCERTAINTY 🎯
Trump Administration Risk: 200% threats on French goods, potential EU tariffs
DAX Impact: Export-dependent companies (SAP, Siemens, Allianz) face pressure
Mitigation: German fiscal spending partially offsets export weakness
2. GEOPOLITICAL TENSIONS 🌍
Recent De-escalation: Greenland concern subsided (net positive for risk sentiment)
Ongoing Risks: Russia/Ukraine, Middle East remain volatile
Market Effect: Drives intermittent VIX spikes; creates trading noise
3. CHINA COMPETITIVE PRESSURE 🐉
EV Transition Challenge: German auto industry facing Chinese EV competition
DAX Exposures: BMW, Mercedes, Volkswagen at risk long-term
Silver Lining: German tech (SAP, Infineon) + defense spending counters
📅 UPCOMING ECONOMIC CALENDAR - KEY DATES TO WATCH
Jan 28-29, 2026 🇺🇸 US Fed Decision (HIGH IMPACT) - Watch for rate hold + forward guidance signals that could shift risk sentiment
Jan 30, 2026 🏦 ECB Policy Decision (MEDIUM IMPACT) - Expected rate hold at 2.0%; confirmation keeps monetary accommodation supportive
Late Jan 2026 💻 SAP Q4 Earnings (HIGH IMPACT) - Tech sector bellwether; strong results = DAX upside catalyst
Feb 2026 🏭 German Factory Orders (MEDIUM IMPACT) - Measures economic momentum; growth above forecast = bullish for exporters
Q1 2026 📊 German GDP Data (HIGH IMPACT) - Recovery confirmation; expected +1.2% growth validates our bullish thesis
Feb/Mar 2026 📈 ECB Inflation Data (MEDIUM IMPACT) - Maintains 2% target check; any spike above = potential rate hike concerns
💡 TRADER'S EDGE - THIEF TRADER PHILOSOPHY
"The market rewards patience, position sizing, and profit-taking discipline more than perfect timing."
TRADING COMMANDMENTS 📜
✅ DO THIS:
Plan your trade → Trade your plan (No emotion)
Use limit entries at calculated levels (Avoid chase buying)
Take profits incrementally (50% at target 2, trail the rest)
Respect stops (Losses are learning fees)
Scale position size to risk tolerance (2-3% loss = survival mode)
❌ AVOID THIS:
FOMO entries at market price (Slippage killer)
Holding through TP target (Greed loses gains)
Moving stops against you (Stop-hunt protection lost)
Averaging down in downtrends (Pyramid to danger)
Ignoring correlation signals (Confluence > single indicator)
🎯 RISK DISCLOSURE & IMPORTANT WARNINGS ⚠️
THIS IS NOT FINANCIAL ADVICE!
💼 Trader's Acknowledgment:
Index CFD trading carries EXTREME RISK - 80%+ of retail traders lose capital
You can lose MORE than your initial deposit (leverage = double-edged sword)
Past performance (DAX +16.13% YTD) ≠ Future results
Geopolitical/economic shocks can gap markets against your stops
ONLY risk capital you can afford to lose completely
🔐 Your Responsibility:
This analysis is educational framework, not a trading signal
Entry price selection (24,700 / 24,800 / 24,900) is YOUR choice
Stop-loss placement must match YOUR risk tolerance
Take-profit levels are suggestions—adjust to YOUR psychology
Consult a licensed financial advisor before trading
Use demo account first to validate edge
🚀 FINAL WISDOM - TRADER'S MANTRA
"In trading, capital preservation beats capital accumulation. A small, consistent edge + compound returns = wealth."
The Setup is Clear. Entry signals are prepared. Confluence is established. Now it's YOUR move.
Will you wait for confirmation? Will you scale entries? Will you honor your stops?
The market doesn't care about your opinion. It only respects price action and risk management.
Trade with purpose. Trade with discipline. Trade to survive another day.
🎲 May your entries be precise, your exits be profitable, and your psychology be unshakeable. 💪
Dax30

DAX30/GER30 - REMIND OURSELVESTeam, last two weeks ago, i keep mentioned that DAX would likely to hit 24800-24600 during FEBRUARY correction. Look like Trump twitter about GREENLAND tariff has hit the market last few days.
Today we are going LONG small entry at 24824-24805 ranges
STOP LOSS at 24730
Target 1 at 24865-24872
Target 2 at 24896-25015
LETS GO.

Dax Bullish Continuation Expected After PullbacksH1 - Strong bullish move
No opposite signs
Until the two support zones hold I expect bullish continuation
👉 If you enjoy this analysis, please Like, Follow, and Support the profile! Your engagement motivates us to share more quality setups.

Dax - Short Term Buy IdeaH1 - Strong bullish momentum.
No opposite signs.
Until the two Fibonacci support zones hold I expect the price to move higher further.
If you enjoy this idea, don’t forget to LIKE 👍, FOLLOW ✅, SHARE 🙌, and COMMENT ✍! Drop your thoughts and charts below to keep the discussion going. Your support helps keep this content free and reach more people! 🚀
--------------------------------------------------------------------------------------------------------

DAX30/GER30 - THE TIME HAS COMETeam, sound a little funny, but DAX took some viagra today so I wait for the pump to be exhausted.
We are shorting at 24786, with stop loss at 24880 just to be safe
I expect next 6-12 hours, market will dump toward our target
Target 1 at 24732-24715 PLEASE TAKE PARTIAL AND BRING STOP LOSS TO BREAK EVEN
Target 2 at 24696-24675
TODAY WE HAVE UK100.FTSE100 SHORT AGAIN and target hit
NOW LETS GO.

DAX30/GER30 - Short Setup — Structured Trade PlanTeam, it has been a while since we trade DAX, since holiday season, i just take it easy and do more scalping trade.
Earlier Execution
Short entry: 23,459
Partial TP: 23,426
Nice scalp — clean reaction, good risk control.
Current Bias
Market still in holiday‑flow mode
Liquidity pockets are thin
DAX pushing into premium levels
You’re anticipating a liquidity grab → rejection → short continuation
Entry Zone (Short)
24,465–24,472
This aligns with:
Liquidity above intraday highs
A likely sweep zone before reversal
A premium pricing pocket for shorts
Target 1: 24,426–24,415
Take partial
Move stop to break‑even
Lock in a risk‑free runner
Target 2: 24,389–24,372
Full target zone
LETS GO

DAX30/GER30 - SETTING UP A TRADETeam, we been very successful trading DAX in the past and many successful trade
the current price at 24130, we are not going to suicide at this entry level
We wait for a set up entry at 24000-23960 rangs,
STOP LOSS at 23860
Target 1 at 24085-96
Target 2 at 24115-24150
Target 3 at 24180-24280
Lets be patience to see if our entry price hit, do NOT rush into a trade.
keep an eye on it today once the DAX market open, half an hour after real market open!
LETS GO

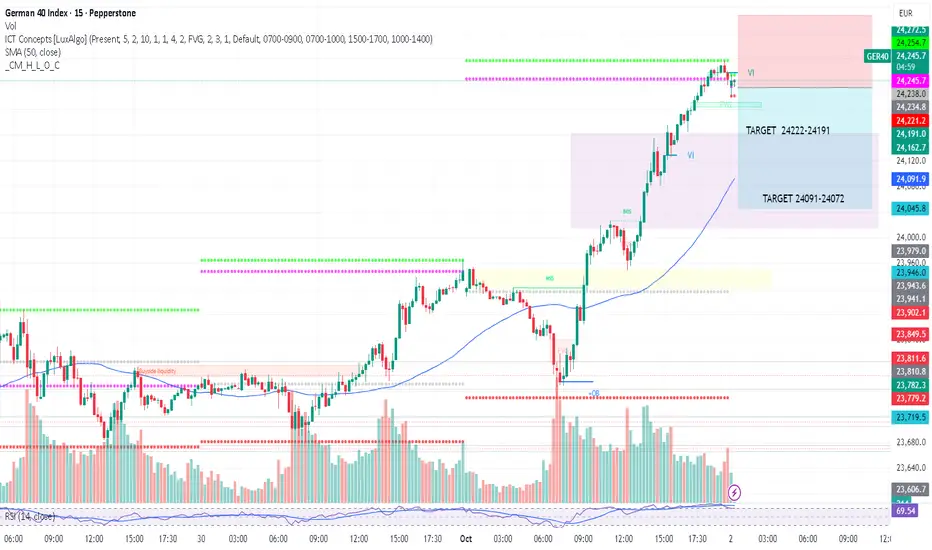
GER40 Pullback Is Not a Reversal (Here’s Why)GER40 did not react at the 0.7–0.8 retracement of the previous bearish leg, indicating underlying strength. Price has since formed equal highs (EQH), which now serve as a logical liquidity target for the next upside move.
I expect a brief manipulation or pullback early in the week, followed by bullish expansion toward the 24,500 area.
I’ll share updates as the setup develops — follow for further analysis.

Bearish Momentum Building on GER40 – Continuation or Trap?🦹♂️ GERMANY 40 (GER40) — Smart Money Flow Blueprint 💰 | Bearish Swing Setup
🧭 Market Context
Hey Thief OGs & market heroes 🧙♂️,
Welcome to another precision strike setup on the 🇩🇪 GERMANY 40 Index (GER40).
The price action has triggered a Triangular Moving Average (382) breakdown —
confirming a bearish money-flow shift below dynamic support.
Let’s decode the play 👇
📉 Trade Blueprint (Swing Trade Plan)
🧩 Structure: Bearish bias confirmed ✅
⚡ Trigger: TMA-382 breakout below dynamic support
🎯 Strategy: Layered Sell Limit Entries (Thief-style entry stacking)
💸 Entry Layers:
🧱 24 100 • 💀 24 050 • 🎯 24 000
(You can add more layers based on your own risk appetite)
🛑 Stop-Loss: 🔐 Thief’s SL @ 24 250
🎯 Take-Profit Target: 💰 23 700 → dynamic support + oversold trap zone
💡 Thief Strategy Notes
“Layer it like a pro, exit like a ghost 👻”
• Multiple sell-limit layers help you catch volatility with precision ⚙️
• TMA serves as a dynamic moving structure – not a static line.
• Breakdown of support = momentum shift confirmed 🔻
• Clear risk/reward logic – structured SL & TP = disciplined flow 🎯
• Bearish bias remains intact while price holds under 24 100
🔍 Correlation Radar & Related Pairs to Watch
Stay alert to cross-market clues 🧠
🔗 Correlation Asset Key Observation
🇺🇸 US30 (Dow Jones) Often mirrors GER40 momentum — if Dow dips, GER40 tends to follow.
🇬🇧 FTSE100 European equity sentiment confirmation — weakness = bearish confidence boost.
💶 EUR/USD Strong Euro = export pressure → GER40 downside bias continuation.
🧠 Why This Setup Makes Sense
• TMA 382 breakout = momentum confirmation 📉
• Dynamic support break = structure shift 🔄
• Layered entries = better average fill 🔂
• SL = clear risk • TP = logical oversold zone 🎯
• Cross-asset watchlist keeps you aligned with global money flow 🌍
⚠️ Risk & Personal Choice
Dear Ladies & Gentlemen (Thief OGs) —
I’m not recommending you copy my stop-loss or take-profit.
They’re purely my levels for analysis reference only.
Trade responsibly. You make the call, you take the bag or the gold 💼✨
🧾 Quick Recap
🦹♂️ Strategy: Multi-Sell-Limit Layering
📉 Bias: Bearish below 24 100
💣 Entries: 24 100 • 24 050 • 24 000
🛑 Stop: 24 250
🎯 Target: 23 700
🧭 Setup Type: TMA Breakout + Dynamic Support Breakdown
🌍 Correlation Focus: US30 • FTSE100 • EUR/USD
✨ “If you find value in my analysis, a 👍 and 🚀 boost is much appreciated — it helps me share more setups with the community!”
#GER40 #Germany40 #DAX #Indices #BearishSetup #SwingTrade #SmartMoney #LayeringStrategy #ThiefTrader #MarketFlow #TMA #PriceAction #TechnicalAnalysis #TradingView #ChartSetup #RiskManagement

GER 40Where are we going? Germans never stop pushing. Depending on close of this D3 candle, I will determen next move. We had nice bullish momentum for past few days and I am liking it. Time to start posting again on Tradingview, until I get bored and saturated again 😂😂😂

GER40 Trade Idea: The Perfect Pullback Before Liftoff!I enjoy trading GER40, especially during the London session, where we consistently see a phase of manipulation followed by a clean move toward the target. At the moment, the structure is showing a similar pattern.
Although the HTF suggests a broader correction toward the 22,000 area, I’m looking for a short-term setup for next week.
My scenarios:
1) Primary scenario:
A move lower into the first Daily FVG, which is also visible on the 4H and 1H timeframes—confirming its validity. After a test of this zone and a liquidity grab around the 23,700 area, I expect price to move upward toward the 0.70–0.79 Fibonacci retracement, where I will look to take profit.
2) Alternative scenario (less likely):
A deeper correction into the second Daily FVG, which is only visible on the Daily timeframe. Due to its limited confluence, this scenario has lower probability.
Execution plan:
I’ll wait for price to trade into one of these FVGs, then look for LTF reversal signals to execute a long position targeting the 0.70–0.79 Fibonacci zone.
If you enjoy this type of analysis, make sure to follow and like this idea.

DAX: Sideways at ATH, Q3 Coil → Q4 Pop?Since May the DAX has moved sideways at/near all-time highs. Q3 has been chop as expected, but momentum hasn’t broken—buyers keep defending the 23.4–23.7k shelf. I’m leaning into seasonality and prior behavior: staying long for a push into quarter-end, then I’ll reassess. Plan on scaling out into 24,500 → 24,600 → 24,700 (ATH supply), with risk tucked below the recent range floor.
Technicals
• Structure: Multi-month range at the highs; no decisive lower-low. The 4H view shows repeated rejections of a minor descending supply line while the base at ~23,6xx keeps holding.
• Entry zone: 23,620–23,720 (range support / prior VWAP shelf).
• Invalidation: daily close below 23,200–23,300 (range break).
• Targets: 24,000 (psych), 24,300 (mid-supply), 24,600 (ATH line from your chart).
• Breadth/rotation clues (dashboard): Financials firm, tech mixed, autos soft; overall market still balanced rather than risk-off—consistent with consolidation, not reversal.
• Tape feel: Repeated “muted opens” with buyers showing up later in the session fits the grind-higher playbook into month/quarter end.
Fundamentals
• Macro tone: US risk appetite improved after the Fed’s first cut, even as Powell tempered hopes of an aggressive path—enough to cap deep corrections but still supportive of equities. European desk notes point to a restrained start, not a bear impulse.
• Germany specifics: Headlines flag auto-sector warnings (VW/Porsche) weighing on sentiment, but banks and select industrials offset—matching the mixed sector board rather than broad deterioration.
• Flows/seasonality: Quarter-end & Q4 seasonality often favor indices that have consolidated at highs; with DAX still ~1k points off the record, a range breakout toward 24.3k–24.65k is a reasonable path before re-calibrating.
• Risks to thesis: Another round of negative guidance from autos, hotter-than-expected US data re-pricing fewer cuts, or a clean daily close below 23.2k (range failure).
Trade what’s on the chart, respect the invalidation, and pay yourself into strength.
Note: Please remember to adjust this trade idea according to your individual trading conditions, including position size, broker-specific price variations, and any relevant external factors. Every trader’s situation is unique, so it’s crucial to tailor your approach to your own risk tolerance and market environment.

DAX/GER - LET RIDE THE WAVE AGAINTeam, yesterday we got both targets 1 and 2 hit,
Now we are entering at 23690 and buying more at 23650 - with stop loss at 23580
Once it breaks above 23710, bring the stop loss to BE
Target 1 at 23735-65
Target 2 at 23810-45
LETS GO - LETS MAKE DAX GREAT AGAIN

Maximum profit: Top 5 indices of OctoberIn October, client activity peaked around #SP500, #NQ100, #DAX30, #FTSE100, and #NIKKEI . These five indices not only showed the highest share of profitable trades but also delivered the best returns across all index instruments. Strong corporate earnings, steady demand, and a positive news backdrop continue to support their growth potential.
Growth outlook for key indices through the end of 2025:
• #SP500: New record highs, solid earnings from major players, and expectations of a Fed rate cut support buying the dip with moderate risk.
• #NQ100: Tech demand remains strong as firms invest in data centers and AI infrastructure. If earnings stay on track, there’s still room to grow.
• #DAX30: After hitting new all-time highs in 2025, the German index benefits from improved global trade sentiment and stable EU data. Exporters thrive on robust external demand.
• #FTSE100: The UK market remains near its highs, supported by strong performance in key sectors and commodities. Year-end liquidity may further reinforce the uptrend.
• #NIKKEI: Japan’s index keeps climbing, helped by a weak yen boosting exports and a predictable monetary environment. Further gains are possible if global conditions remain calm.
FreshForex analysts believe short-term index performance hinges on three main factors: current earnings season results, inflation trends, and central bank decisions. Risk management and awareness of the macro calendar remain essential.

GER/DAX30 - ARE YOU READYTeam, market is heavily sold off today
But it will recover during US Market opening
I find a good opportunity to go long DAX at 23720-35 - NOTE: it may drop low at 23700
STOP LOSS consider at 23650
Once the market hit above 23780 range bring STOP LOSS TO BREAK EVEN
Target 1 at 23785-23815 - take partial only 30%
Target 2 at 23845-85 - take another 30%
Target 3 at 23915-24015
LETS GO

German DAX 30 Rally Ahead? Strong Pullback Signals Momentum💎 DE30 (German DAX 30) — Thief Trader’s Market Profit Playbook! 💎
📈 Bias: Bullish Play Confirmed
⚙️ Strategy Type: Layered Limit Order Entries (Thief’s Signature Style)
🧠 Game Plan:
The German DAX 30 (DE30) shows strong bullish momentum after a clean moving average pullback — confirming a short-term continuation setup on the 4H and daily charts.
We’re loading our Thief-style layering entries to ride this momentum wave! 🏄♂️
Layered Entry Zone (Buy Limits):
💰 23,800 | 23,900 | 24,000 | 24,100
(Add more layers if you’re managing dynamic scaling — this is the Thief style of playing smart, not hard!)
🛑 Stop Loss (Protective Zone):
🚨 23,700 (Thief’s guard line!)
⚠️ Note: Dear Ladies & Gentlemen (Thief OGs), this SL is not a must-follow — manage your risk wisely. This is an educational plan — trade at your own discretion.
🎯 Take Profit Zone:
🎯 24,500 — realistic first exit zone.
💥 24,700 — Electric Shock Resistance Wall ⚡️ (strong resistance area + overbought + potential trap zone).
⚠️ Note: Again, dear Thief OGs — take your profits when you’re happy! Targets are reference points, not financial advice.
🔍 Key Technical Highlights:
Strong MA Confluence: 20EMA and 50EMA crossover support the bullish bias.
Volume Uptick: Smart money rotation visible on hourly accumulation bars.
Momentum Recovery: RSI rebounding from mid-zone (40–50), eyeing bullish breakout potential.
🌐 Correlated Assets to Watch:
Stay sharp — DAX often dances with global indices and major USD flows:
CAPITALCOM:US30 (Dow Jones) — correlated risk sentiment, bullish tone confirmation.
FX:FRA40 (CAC 40) — follows European equity momentum.
💵 FX:EURUSD — inverse correlation with DE30 strength during USD volatility.
Tracking these helps confirm whether the bull party 🎉 continues or the market bouncer 🚫 shows up early.
✨ “If you find value in my analysis, a 👍 and 🚀 boost is much appreciated — it helps me share more setups with the community!”
#DE30 #DAX30 #ThiefTrader #IndexTrading #GermanDAX #BullishSetup #LayeredEntry #PriceAction #SmartMoney #TradingStrategy #MarketAnalysis #ThiefStyle #ForexCommunity #RiskManagement

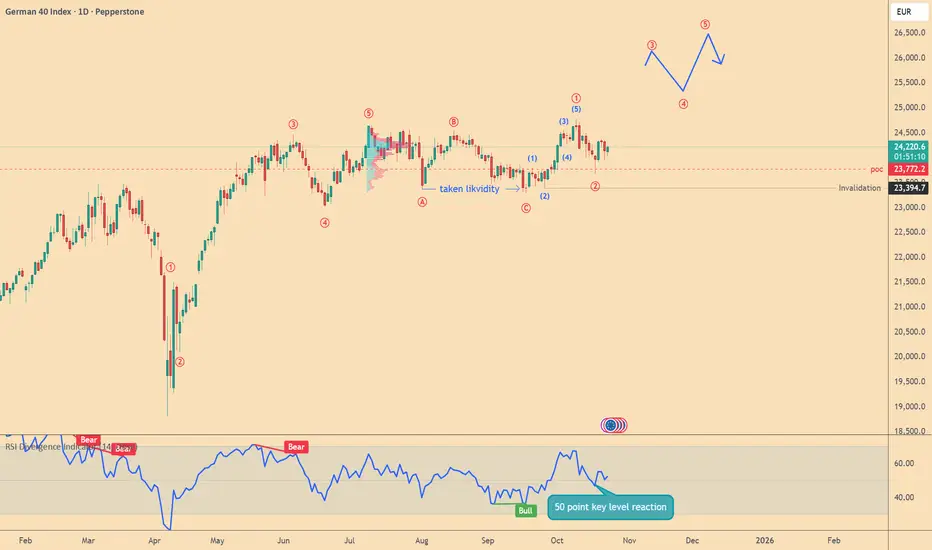
DAX/GER40, technical analysis 1DHello traders,
We bring you another important technical analysis on the DAX index.
We can see that according to Elliott Wave theory we have completed corrective ABC structure, also taken liquidity and started the bullish 12345 structure in smaller timeframe as u can see on the chart.
So the next outlook is that the value of the DAX index will increase.
But be careful!
It is necessary to respect the invalidation level in this case.
We also have to take into account the war in Ukraine, all of President Trump's statements, interest rates, and other stimuli that can change the market instantly!
WavePulse
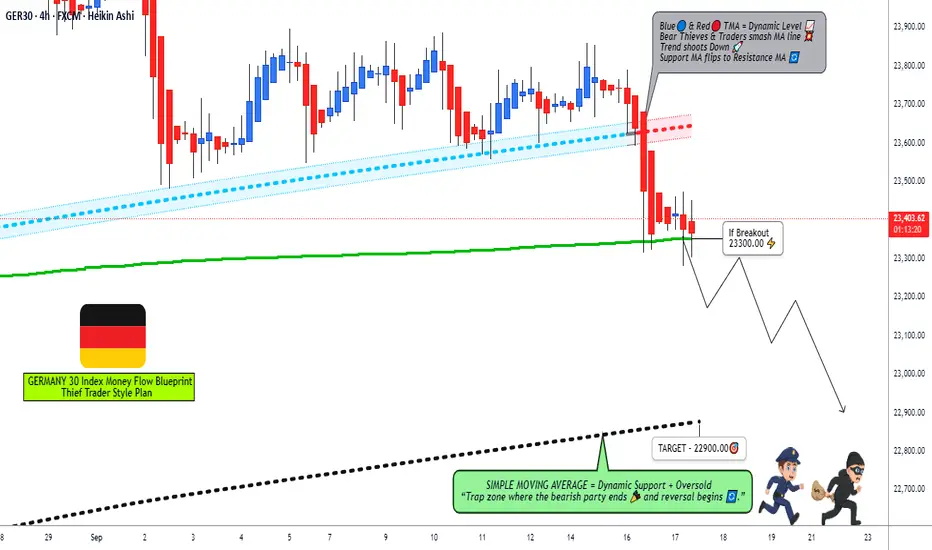
GER30 Trading Plan: Pending Orders, Breakout Levels, and Targets📉 GER30 (Germany Index) – Market Cash Flow Management Strategy 🏦
Hey Traders 👋,
Here’s a swing/day trade plan I’m watching on the GER30 (Germany Index). This setup is designed with a layered pending order strategy once confirmation hits.
🔑 Trading Plan
Bias: Bearish (waiting for sellers to breach the 4H Moving Average ✅ confirmation needed)
Entry Trigger: Breakout of MA @ 23300 ➝ after breakout confirmation, entries can be considered at different price levels.
Layered Entries (Sell Limits):
23500
23450
23400
23350
23300
(You can expand layering based on your own strategy)
⚠️ Important Note: Only activate sell limit layers after breakout confirmation. No confirmation = no entry.
🛑 Stop Loss
Suggested SL: 23650
But remember: risk management is personal! 🎯 Set your SL at your own comfort level.
🎯 Target
Exit Zone: 22900
Why? SMA acting as strong dynamic support, plus oversold conditions & potential liquidity traps.
Again ➝ this TP is optional. You’re in control of your profits. 💰
📌 Core Notes (Read Carefully!)
This plan uses multiple layered sell-limit entries (cash flow layering style).
Don’t jump in blindly! Wait for the moving average breach on 4H to confirm bearish momentum.
SL & TP are not recommendations, just references. Trade at your own risk.
🔗 Correlation / Related Pairs to Watch
FX:GER30 – Core instrument
XETR:DAX – Same Germany Index benchmark (futures)
FX:EURUSD – Often inversely correlated with DAX strength when EUR reacts to macro events
SP:SPX / CAPITALCOM:US30 – Global equity indices; U.S. flows can impact German equities
OANDA:XAUUSD – Gold as a hedge; risk-off flows sometimes push capital out of equities and into gold
Watching these pairs can give better context to the strength/weakness of GER30 📊.
✨ “If you find value in my analysis, a 👍 and 🚀 boost is much appreciated — it helps me share more setups with the community!”
#GER30 #DAX #Germany30 #IndexTrading #SwingTrading #DayTrading #TechnicalAnalysis #TradingStrategy #StockIndices #MarketFlow
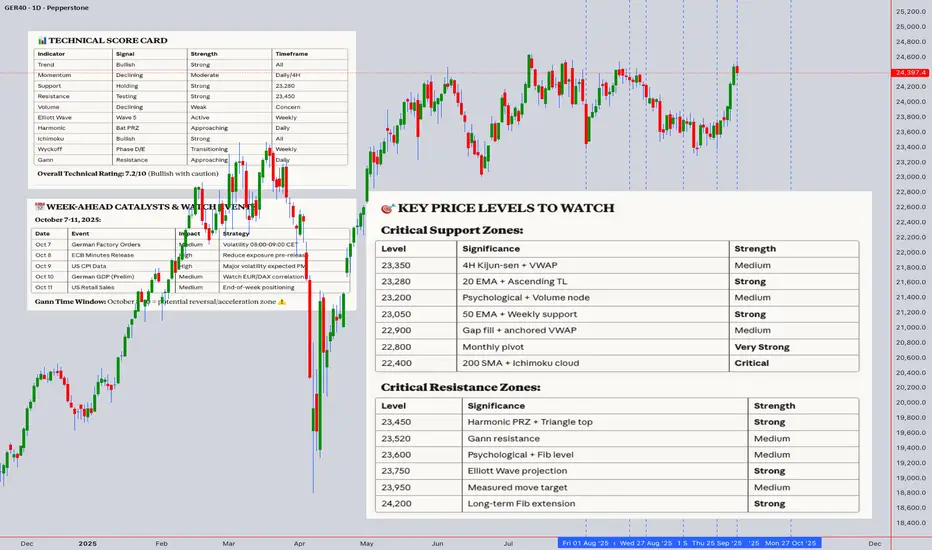
GER40 (DAX40) Technical Analysis & Trading OutlookCurrent Price: 23,397.40 | 4th October 2025, 12:54 AM UTC+4
📊 MARKET OVERVIEW & STRUCTURAL ANALYSIS
The DAX40 is trading near all-time highs, displaying robust bullish momentum following the breakout above 23,000. The index is currently in a consolidation phase after an extended rally, suggesting potential for either continuation or a corrective pullback.
Key Market Context:
Trend Structure: Primary uptrend intact across all major timeframes
Market Phase: Late-stage expansion with decreasing momentum divergence
Volatility: Moderate; Bollinger Bands showing compression on 4H/Daily charts
Volume Profile: Declining volume on recent highs suggests potential exhaustion
🎯 MULTI-TIMEFRAME ANALYSIS
MONTHLY CHART - Long-term Perspective
Elliott Wave Count: Currently in Wave 5 of a larger impulse structure from 2022 lows
Gann Analysis: Price approaching the 1x2 Gann angle from the 2022 pivot; resistance expected at 23,450-23,500
Ichimoku Cloud: Trading well above the Kumo; Tenkan-sen/Kijun-sen bullish crossover sustained
Key Support: 22,800 (monthly pivot) | 22,400 (cloud base)
Key Resistance: 23,500 (Gann resistance) | 23,850 (Wave 5 projection target)
WEEKLY CHART - Swing Trading Perspective
Pattern Recognition: Potential Bull Flag formation developing (consolidation after strong rally)
Wyckoff Analysis: Phase D (markup) transitioning to possible Phase E (redistribution)
RSI: 67.2 - approaching overbought territory but not yet extreme
VWAP (Anchored from Jan 2025): 22,950 - price trading above, bullish bias confirmed
Volume Analysis: Decreasing volume on upswings suggests weakening buying pressure
DAILY CHART - Swing & Position Trading
Harmonic Pattern: Potential Bat Pattern completion zone: 23,450-23,550 (PRZ)
Head & Shoulders Watch: No clear reversal pattern yet, but right shoulder formation risk if rejection occurs above 23,500
Bollinger Bands: Price at upper band (23,420); squeeze pattern suggests breakout/breakdown imminent
Moving Averages:
20 EMA: 23,280 (immediate support)
50 EMA: 23,050 (critical support)
200 SMA: 22,400 (long-term trend support)
RSI: 64.8 - neutral to slightly overbought
MACD: Bullish but histogram showing declining momentum
4-HOUR CHART - Intraday/Swing Bridge
Trend: Short-term consolidation within ascending channel
Ichimoku: Price above cloud; flat Kijun-sen at 23,350 = pivot zone
VWAP: 23,365 - current price trading slightly above, marginally bullish
Support Levels: 23,350 | 23,280 | 23,200
Resistance Levels: 23,450 | 23,520 | 23,600
Pattern: Ascending Triangle forming between 23,280 support and 23,450 resistance
1-HOUR CHART - Intraday Focus
Candlestick Pattern: Indecision candles (doji/spinning tops) suggesting hesitation
RSI: 58.4 - neutral zone
Bollinger Bands: Mid-band at 23,370; price oscillating around mean
Volume: Below average - lack of conviction
Gann Square of 9: Next resistance at 23,445 (45° from current pivot)
15-MINUTE & 5-MINUTE CHARTS - Scalping
Micro Structure: Range-bound between 23,370-23,420
VWAP: Acting as dynamic support/resistance at 23,385
Volume Spikes: Watch for breakout confirmation with volume >120% of 20-period average
RSI (15M): Oscillating between 45-60 (neutral range)
🔍 CRITICAL TECHNICAL SIGNALS
Bullish Indicators:
✅ Price above all major moving averages (20/50/200 EMA)
✅ Ichimoku Cloud bullish alignment across all timeframes
✅ Higher lows pattern maintained since September
✅ Golden Cross intact (50 EMA > 200 EMA)
✅ Volume-weighted averages showing institutional support
Bearish Warning Signs:
⚠️ Declining volume on rallies (distribution concern)
⚠️ RSI bearish divergence forming on 4H/Daily charts
⚠️ Approaching Gann resistance and harmonic PRZ
⚠️ MACD histogram declining (momentum weakening)
⚠️ Potential Bull Trap risk if rejection occurs above 23,450
Neutral/Watch Factors:
🔶 Bollinger Band squeeze on daily chart (breakout pending)
🔶 Wyckoff redistribution signs require confirmation
🔶 No clear Head & Shoulders pattern yet (monitoring right shoulder)
📈 INTRADAY TRADING STRATEGY (Next 5 Trading Days)
SCENARIO A: BULLISH BREAKOUT (Probability: 45%)
Trigger: Break and hold above 23,450 with volume confirmation
Entry Points:
Aggressive: 23,455 (immediate breakout)
Conservative: 23,470 (retest of breakout level)
Targets:
T1: 23,520 (short-term resistance)
T2: 23,600 (Gann 1x1 angle)
T3: 23,750 (measured move from triangle)
Stop Loss:
Below 23,350 (4H Kijun-sen)
Time Frames: 5M, 15M, 1H entries | Hold 4H-Daily for swing
Risk:Reward: Minimum 1:2.5
SCENARIO B: RANGE-BOUND CONSOLIDATION (Probability: 35%)
Range: 23,280 - 23,450
Long Entries:
23,280-23,300 (lower range support + 20 EMA)
23,350-23,365 (4H pivot + VWAP)
Short Entries:
23,430-23,450 (upper range resistance)
23,520-23,535 (false breakout rejection)
Targets:
Range midpoint: 23,365
Opposite range boundary
Stop Loss:
Longs: Below 23,250 (range invalidation)
Shorts: Above 23,480 (breakout confirmed)
Strategy: Mean reversion scalping on 15M/1H charts
SCENARIO C: BEARISH CORRECTION (Probability: 20%)
Trigger: Break and close below 23,280 (20 EMA + ascending trendline)
Short Entry Points:
Aggressive: 23,275 (break confirmation)
Conservative: 23,300 (retest as resistance)
Targets:
T1: 23,200 (minor support)
T2: 23,050 (50 EMA + psychological level)
T3: 22,900 (weekly VWAP + gap fill)
Stop Loss:
Above 23,370 (failed breakdown)
Confirmation Signals:
RSI breaking below 50
MACD bearish crossover on 1H/4H
Volume surge on breakdown
📊 SWING TRADING STRATEGY (1-4 Weeks Outlook)
BULLISH SWING SCENARIO
Entry Zone: 23,200-23,280 (pullback to 20 EMA support)
Position Sizing: Build in 3 tranches
40% at 23,280
30% at 23,200
30% at 23,050 (if deeper correction)
Targets:
T1: 23,750 (Elliott Wave 5 target - partial profit 40%)
T2: 23,950 (Measured move + Gann extension - 30%)
T3: 24,200 (Fibonacci 1.618 extension - runner 30%)
Stop Loss: Below 22,950 (daily close basis)
Hold Duration: 2-4 weeks
Ideal Setup:
Bullish engulfing candle on daily chart at support
RSI bounce from 40-45 zone
Volume increase on bounce
BEARISH SWING SCENARIO (Hedge/Counter-trend)
Entry Zone: 23,480-23,550 (harmonic PRZ + Gann resistance)
Confirmation Required:
Bearish reversal candlestick (shooting star, evening star)
RSI bearish divergence
MACD bearish crossover on daily chart
Break below 23,350 on closing basis
Targets:
T1: 23,050 (50 EMA - 40% cover)
T2: 22,800 (monthly pivot - 35% cover)
T3: 22,400 (200 SMA + cloud base - final 25%)
Stop Loss: Above 23,650 (daily close)
Risk Management: Tight stops; favor bullish bias unless clear reversal
⚡ ELLIOTT WAVE ANALYSIS
Current Count:
Primary Wave: Wave 5 of larger impulse from 2022 lows
Intermediate Wave: Subwave 5 of Wave 5 (terminal phase)
Minor Wave: Possible wave (iv) consolidation completing
Wave Projections:
Wave 5 Target (Equal legs): 23,750-23,800
Wave 5 Target (1.618 extension): 24,150-24,250
Corrective Wave A Target (if reversal): 22,800-22,900
Wave C Target (full correction): 22,200-22,400
Key Insights:
Wave structure suggests uptrend continuation likely
Terminal wave characteristics: decreasing momentum, longer time
Watch for five-wave completion signals near 23,750-24,000 zone
🔮 GANN ANALYSIS
Square of 9 (from 23,000 pivot):
45° Resistance: 23,445 ⚠️ (approaching)
90° Resistance: 23,667
180° Major Resistance: 24,000 (psychological confluence)
45° Support: 23,111
90° Support: 22,889
Gann Angles (from September 2024 low):
1x1 Angle: Currently at 23,580 (equilibrium)
1x2 Angle: 23,450 (major resistance) ⚠️
2x1 Angle: 23,100 (support)
Time Cycles:
Next significant Gann time window: October 8-10, 2025 (21 trading days from last pivot)
Potential reversal/acceleration zone
Price & Time Squaring:
Price at 23,400 squares with October 7th time projection
Suggests potential turning point early next week
🌊 ICHIMOKU KINKO HYO ANALYSIS
Current Status (Daily Chart):
Tenkan-sen (Conversion): 23,350 (flat = consolidation)
Kijun-sen (Base): 23,280 (critical support)
Senkou Span A: 23,100
Senkou Span B: 22,850
Chikou Span: Above price (bullish confirmation)
Cloud Analysis:
Price well above cloud = Strong Bull Trend
Cloud thickness = robust support structure
Future cloud (26 periods ahead) shows slight thinning = potential volatility increase
Key Signals:
TK Cross: Tenkan approaching Kijun from above (watch for bearish cross)
Price vs Kijun: Trading above = bullish, but proximity suggests correction risk
Chikou Span: Clear of price = trend continuation likely
Ichimoku Trading Signals:
Buy Signal: Pullback to 23,280-23,300 (Kijun support) with bullish rejection
Sell Signal: Daily close below Kijun (23,280) with bearish TK cross
Strongest Support: Cloud base at 22,850-23,100
📉 WYCKOFF MARKET CYCLE ANALYSIS
Current Phase Assessment: Late Phase D (Markup) / Early Phase E Watch
Characteristics Observed:
Accumulation (Complete): Built solid base 22,000-22,500 (July-August)
Markup Phase D: Strong advance from 22,500 to 23,400 (September-October)
Distribution Signs (Emerging):
Declining volume on rallies
Buying Climax (BC) potential near 23,500
Automatic Reaction (AR) risk if sharp rejection occurs
Secondary Test (ST) of supply likely
Wyckoff Price Levels:
Creek: 22,900-23,000 (major demand zone)
Spring Potential: 23,480-23,550 (if false breakout occurs)
Sign of Weakness (SOW): Break below 23,200 would signal distribution
Trading Implications:
If Markup Continues: Target 23,750-24,000 (Phase E)
If Distribution Begins: First support 23,000-23,050, major 22,800
Volume Confirmation Critical: Breakouts require 30%+ above average volume
Composite Operator Behavior:
Likely testing supply at current levels
Watch for shake-out below 23,280 to trap weak longs
Absorption of supply above 23,450 needed for continuation
🎪 HARMONIC PATTERN ANALYSIS
Active Pattern: Potential Bat Pattern Completion
Pattern Structure:
X: 22,450 (September low)
A: 23,150 (interim high)
B: 22,850 (retracement)
C: 23,350 (rally)
D (PRZ): 23,450-23,550 (reversal zone) ⚠️
Fibonacci Ratios:
AB: 0.382-0.500 retracement of XA ✓
BC: 0.382-0.886 retracement of AB ✓
CD: 1.618-2.618 extension of BC (target: 23,480-23,550)
XD: 0.886 retracement of XA (23,520) ⚠️
Trading Strategy:
Bearish Reversal Zone: 23,450-23,550
Entry: Short on bearish reversal confirmation in PRZ
Targets (if pattern activates):
38.2% CD: 23,200
61.8% CD: 22,950
100% CD: 22,650
Stop Loss: Above 23,600 (pattern invalidation)
Alternative Patterns:
Bullish Butterfly target at 23,750 if breakout sustains above 23,550
Gartley Pattern support at 23,050 on any correction
📊 INDICATOR SYNTHESIS
RSI (Relative Strength Index):
Daily: 64.8 (neutral/slightly overbought)
4H: 61.2 (neutral)
1H: 58.4 (neutral)
Divergence: Bearish divergence forming on 4H/Daily (price higher highs, RSI lower highs) ⚠️
Key Levels:
Overbought: >70 (not yet extreme)
Oversold: <30 (correction target)
Support: 50 level = trend strength gauge
Bollinger Bands:
Daily: Squeeze pattern (low volatility = breakout imminent)
4H: Price at upper band (23,420) = short-term extended
Bandwidth: Narrowing significantly = explosive move coming (direction TBD)
Strategy: Wait for band break + close outside, then enter in direction of break
VWAP Analysis:
Session VWAP: 23,385 (dynamic pivot)
Weekly VWAP: 23,290 (critical support)
Anchored VWAP (Jan 2025): 22,950 (major support)
Volume Profile: Highest volume node at 23,300-23,350 (strong support/resistance flip zone)
Moving Average Confluence:
20 EMA: 23,280 (immediate support)
50 EMA: 23,050 (medium-term support)
200 SMA: 22,400 (long-term trend)
Alignment: Bullish across all timeframes
Golden Cross: Active since August 2024 (50>200) = long-term bullish
MACD (Moving Average Convergence Divergence):
Daily: Bullish, but histogram declining (momentum loss)
4H: Approaching zero line (neutral)
Signal: Watch for bearish crossover on 4H as early reversal warning
Divergence: Confirming RSI bearish divergence on daily chart
🚨 TRAP IDENTIFICATION & AVOIDANCE
BULL TRAP Risk (HIGH ALERT): ⚠️⚠️⚠️
Scenario: False breakout above 23,450-23,500 followed by sharp reversal
Warning Signs:
Breakout with declining volume (no conviction)
Quick spike to 23,500-23,550 with long upper wicks
Inability to hold above 23,450 for more than 2 hours (1H chart)
RSI divergence + MACD histogram declining
Break below 23,350 after failed breakout
Protection Strategy:
Wait for retest of breakout level before entering longs
Require volume confirmation (>120% of 20-period average)
Set tight stops below 23,380 if entering on breakout
Reduce position size by 50% if entering in potential trap zone
Bull Trap Target (if triggered): 23,000-23,050 (trap participants' stops)
BEAR TRAP Risk (LOW-MODERATE):
Scenario: False breakdown below 23,280 followed by sharp recovery
Warning Signs:
Break on low volume
Quick recovery above 23,280 within 1-2 candles
Strong bullish reversal candlestick at support
RSI showing bullish divergence at lower levels
Protection Strategy:
Wait for daily close below 23,250 before aggressive shorts
Watch for volume confirmation on breakdown
Be ready to cover shorts if price reclaims 23,300 quickly
Don't short against major support zones without confirmation
🌍 MARKET CONTEXT & EXTERNAL FACTORS
Macroeconomic Considerations:
ECB Policy: Dovish stance supporting equity markets
German Economy: Manufacturing PMI showing signs of stabilization
EUR/USD: Correlation with DAX; watch 1.08-1.10 zone
US Markets: S&P 500 correlation strong; US data impacts DAX sentiment
Geopolitical: Middle East tensions = safe-haven flows (moderate risk)
Earnings Season:
German corporate earnings (October) = potential volatility catalyst
DAX constituent reporting: watch for sector rotation
Seasonal Patterns:
October historically volatile for European indices
End-of-month portfolio rebalancing (October 31st) = potential volatility
Volatility Indicators:
VDAX (DAX volatility): Currently moderate ~15-16
Complacency risk if volatility spikes above 18
🎯 COMPREHENSIVE TRADING PLAN
INTRADAY TRADERS (5M - 1H Charts):
Monday-Wednesday Outlook:
Primary Strategy: Range trading between 23,280-23,450
Scalp Zones:
Buy: 23,300-23,320 | Target: 23,380-23,400 | Stop: 23,275
Sell: 23,430-23,450 | Target: 23,370-23,350 | Stop: 23,475
Thursday-Friday Outlook:
Breakout Watch: Decision time for triangle pattern
If Bullish: Long 23,460+ | Target: 23,550 | Trail stop
If Bearish: Short <23,270 | Target: 23,150 | Stop: 23,320
Risk Management:
Maximum 1% risk per trade
2:1 minimum risk:reward
No more than 3 active positions simultaneously
Daily loss limit: 2% of account
SWING TRADERS (4H - Daily Charts):
PRIMARY SETUP: Buy the Dip
Entry Zone: 23,200-23,280 (expect pullback next week)
Confirmation: Bullish engulfing or hammer on daily chart
Position Size: 2-3% risk per trade
Targets: 23,750 (T1) | 24,000 (T2) | 24,250 (T3)
Stop Loss: 22,950 (daily close basis)
Time Horizon: 2-4 weeks
SECONDARY SETUP: Breakout Long
Entry: Break and hold above 23,480 (daily close)
Confirmation: Volume >1.5x average + consecutive closes above
Targets: 23,750 | 24,000 | 24,300
Stop Loss: 23,350
Hold: Trail stop to 20 EMA on daily chart
HEDGE SETUP: Short from Resistance
Entry: 23,500-23,550 with reversal confirmation
Confirmation: Shooting star + RSI divergence + MACD cross
Targets: 23,200 | 23,050 | 22,800
Stop Loss: 23,650 (strict)
Position Size: 50% of normal (counter-trend)
POSITION TRADERS (Weekly - Monthly Charts):
Long-Term Bullish Thesis:
Entry Strategy: Accumulate on corrections to 23,000-23,200
Core Position: Build over 2-3 weeks
Targets:
24,000 (3-month target)
24,500 (6-month target)
25,000 (12-month psychological)
Stop Loss: Weekly close below 22,600
Rationale: Elliott Wave 5 completion + breakout from multi-year consolidation
Portfolio Allocation:
60% long exposure at current levels
20% cash for pullback buying
20% hedges if approaching 23,800-24,000 zone
🔔 ALERT LEVELS & NOTIFICATIONS
Critical Price Alerts to Set:
✅ 23,480 (Breakout level - LONG signal)
✅ 23,450 (Harmonic PRZ - Watch for reversal)
✅ 23,350 (4H support - Breakdown warning)
✅ 23,280 (Daily 20 EMA - CRITICAL support)
✅ 23,200 (Buy zone activation)
✅ 23,050 (50 EMA - Major support test)
✅ 22,950 (Stop loss trigger for swings)
Indicator Alerts:
RSI crossing 70 (overbought) or 50 (weakness)
MACD bearish crossover on 4H/Daily
Bollinger Band break (either direction)
Volume spike >150% of average
📌 CONCLUSION & BIAS
Overall Bias: CAUTIOUSLY BULLISH 🟢 (60% probability)
Bullish Case (60%):
The primary trend remains intact with price above all major moving averages and strong cloud support. The consolidation near highs is healthy, and a resolution to the upside targeting 23,750-24,000 is the path of least resistance. Elliott Wave structure suggests one more push higher to complete Wave 5.
Bearish Case (20%):
Declining volume, RSI divergence, and approach of major resistance (Gann, harmonic PRZ) suggest caution. A failed breakout above 23,500 could trigger a correction to 23,000-22,800. Wyckoff distribution signs require monitoring.
Neutral/Range Case (20%):
Continued consolidation between 23,200-23,500 for 1-2 weeks is possible as the market digests recent gains and awaits economic catalysts.
Best Trading Approach:
Intraday: Range trade 23,280-23,450 until breakout
Swing: Wait for pullback to 23,200-23,280 for optimal risk:reward longs
Position: Maintain core long exposure with stops below 22,800
Key Success Factors:
Patience: Wait for high-probability setups at defined levels
Discipline: Honor stop losses without exception
Flexibility: Adapt to price action; market is always right
Confirmation: Require volume and indicator alignment before major trades
🎓 FINAL RECOMMENDATIONS
For Aggressive Traders:
Trade both sides of the range
Quick profits (50-100 points)
Tight stops (50-80 points)
High frequency (5-10 trades/week)
For Conservative Traders:
Wait for 23,200-23,280 pullback
Larger position size with better risk:reward
Wider stops (150-200 points)
Target 23,750+ for 1:3+ reward
Low frequency (1-2 trades/month)
For Long-Term Investors:
Accumulate on any dip toward 23,000
Hold through minor volatility
Target 24,500+ over 3-6 months
Stop only on weekly close <22,600
Disclaimer: This analysis is for educational purposes only and should not be construed as financial advice. Trading involves substantial risk of loss. Always conduct your own research and consult with a licensed financial advisor before making investment decisions. Past performance does not guarantee future results.
GER40 Critical Level: Which Way Will It Break?📊 GER40 Critical Breakout Analysis
Hello Guys,
By popular demand, I’ve prepared a GER40 analysis. Every single follower matters to me, and that’s why I’m sharing this breakdown with you.
🔹 Buy scenario: Price needs to break above 23,895 and close a candle there.
🔹 Sell scenario: Price needs to drop below 23,278 and close a candle under it.
I’ll be watching both levels closely. Once a breakout happens, I’ll update you right away.
Every like is my biggest motivation to keep sharing these analyses.
Thanks to everyone supporting me!

DAX/GER - HEADING TO HELLTeam,
Since last week, we got short with target and couple of trades before that.
Time to send DAX to SOUTH
SHORT at 24245-24265 - STOP LOSS AT 24335
TARGET 1 AT 24191-24160 - TAKE PARTIAL AND BRING STOP LOSS TO BE
TARGET 2 AT 24092-24072
LETS GO
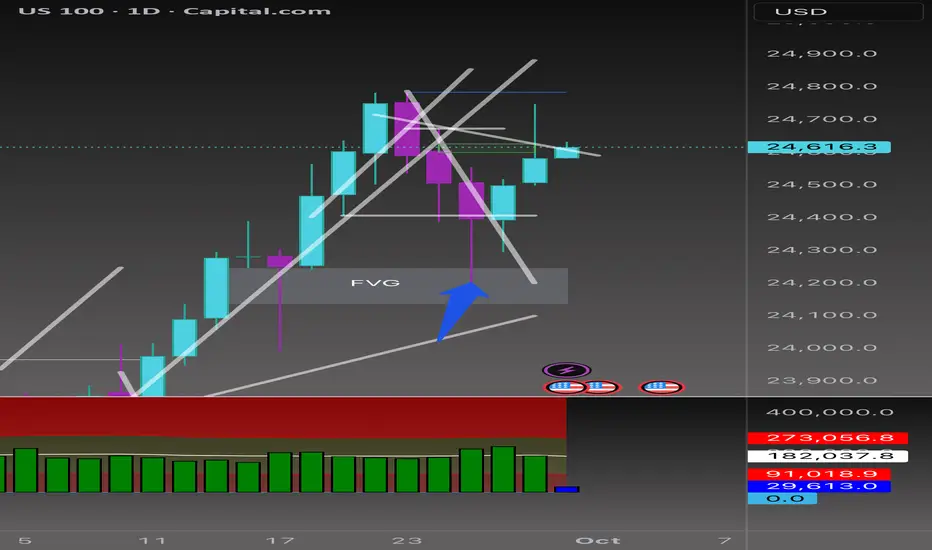
Beyond the Chart - NAS100 Through Technicals & FundamentalsCAPITALCOM:US100 The trendline I drew on the lower timeframe yesterday worked perfectly, and price is still respecting it. We did see a break, but right after that, a Bearish FVG and a Breaker Block formed. This trendline will remain my pilot line for analysis.
NASDAQ Daily Analysis 📊
On the daily chart, the FVG formed on Sep 15th has been revisited, but price couldn't hold in this zone and was quickly rejected. The trendline I've drawn is still active and guiding the move.
⚡️Volatility note: Daily volatility is starting to compress (blue print on my model), meaning the next breakout move could expand strongly. If price breaks above the trendline with momentum, buyers may look beyond 24,650 toward 24,720–24,800 before reevaluating. If rejection holds, compressed volatility could fuel an accelerated drop into the 24,520 → 24,440 FVG zone, and possibly 24,300.
🦖 If a bullish candle closes back above the trendline, I’ll be looking at 24,650 as a buy trigger. A confirmed break here could open the door toward 24,720 → 24,780 liquidity levels.
🐼 If sellers keep control below the trend, downside targets remain at the FVGs around 24,520 → 24,440, and potentially 24,300 (Discount PD Array).
⚡️ Bottom line:
Today’s US data (Chicago PMI, JOLTS, Consumer Confidence) + multiple FOMC speeches will likely decide direction.
📉 Hot data or hawkish tone → sellers push deeper.
📈 Softer numbers or dovish Fed comments → bulls may retest higher levels.
DAX/GER - TIME FOR A SHORTTeam,
DAX, bets to short at this range 23830-23850 - STOP LOSS at 24015
Target 1 - 23756-50 - take partial 70% and bring stop BE
target 2 - 23715-25
lets go.
