DAX on the way to old ATH (in the long run)We had a risky time after the german index DAX has fallen to a low at 11.800 pt and after leaving the diamond pattern.
At 11.730 pt it found the low which marked the end of wave C.
I wasn´t sure if the index had enough momentum to break the strong resistance at 12.600 pt (fib retracement 78.6%). But it had, when attacking it in the second motive wave.
I think this wave hasn´t ended yet; instead it could lead the index to levels around 13.000 pt - this zone has been a swing trend zone - there´s also a gap which hasn´t be closed yet.
But with reaching this zone we also reached the overbought zone (RSI) and some profit-takes would be reasonnable.
If the analysis is right up to this point we should see a correction wave (4) leading to the last support (fib retracement 78.6% at 12.600 pt). But not below this level, because in EW-theory the wave 4 can´t lead to lower points than the peak of wave 1. And if so, this analysis will be false at that point.
But if not, we should enter in wave 5 after having rebounced. Above the swing trend zone at 13.000 pt there are no significant lines or gaps which could mark an end of w5 - so it´ll be possible that the index tests the last ATH at 13569 pt another time.
Actually the indicators are signalling a bullish trend.
This analysis is no trade avice!!!
Daxlong

1D Channel Up on DAXDAX remains on the medium term Channel Up on 1D (RSI = 65.938, Highs/Lows = 113.6786), being kept on a consolidation range in an effort to normalize the overbought STOCH, STOCHRSI and Williams numbers. As seen on the chart, 12,919 and 12,854 are the support levels (and long entries) with 13,141 the resistance (and TP). As long as EURUSD keeps falling, DAX will be bearish proof and will at worst trade sideways.


DAX - DAILY - BUY SETUPDax - Daily time frame. I see a great buy setup on Dax for a quick 300-500 points move to the upside. Reason for the buy call is purely price action and simple technical analysis.


DAX
IDEA: Expecting long move with support at 12507.5 @ Daily S1 pivot & resistance @ Daily S2 pivot 12612.4 . Fibonacci support along the way.
DISCLAIMER:
This is where I practice ideas and work on my trading techniques. Please note I am only providing my own trading information for insight to my trading techniques, you should do your own due diligence and not take this information as a trade signal. Trade at your own risk.

Dax looks like the correction is complete (Elliott Wave)In my previous post I discussed how DAX was moving down in Wave 4, as of now it seems that the correction is complete and that DAX can move upwards for a Wave 3, the green corrective channel should be broken on the upside for further confirmation.
Stops should be placed below 12064 level as that is the recent low of Wave 2.
I will update further as this market continues.

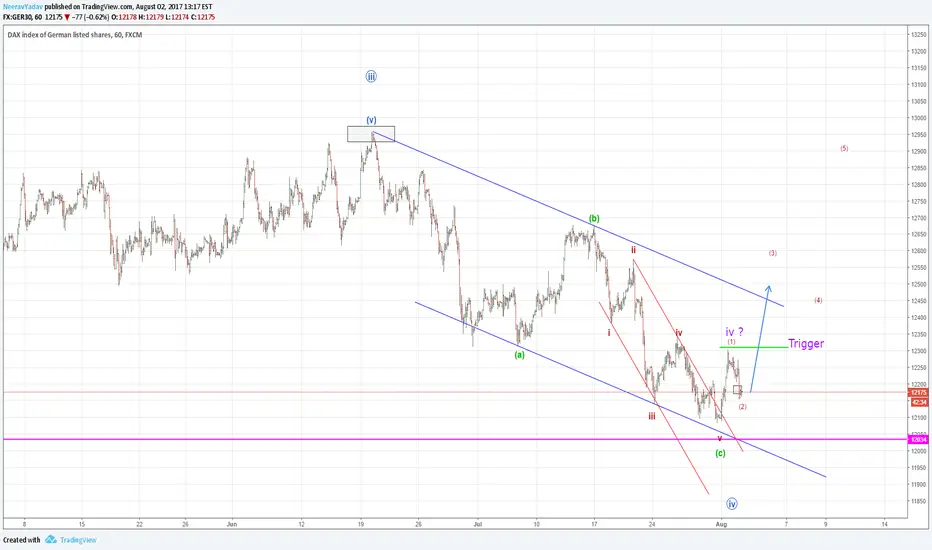
German Markets DAX 30 to head higher (Elliott Wave Analysis)It looks like DAX 30 (German Index) has just completed an A-B-C corrective Wave 4 (The circled Blue Wave iv) and hence we can expect good upside in the coming sessions.
From an alternate perspective it is also possible that the Wave iv of Wave (c) is still continuing as a Triangle or some other corrective structure, hence it would be best to look for longs only after the break of the Green Trigger line 12308 level to the upside.
The exact confirmation of the new leg up will only come after the break of the Blue upper channel line.
Even if the Wave iv (Blue circled) is continuing as a Flat, we still have a good trade setup here to look for longs untill atleast the all time highs of 12960.
I will update further as this market continues.

Dax Trade - Long Idea - Double Bottom, and W formationDAX created a double bottom the last days and also created a W Chart formation, which is shown in the chart. The formation made a retracement to 78% which is pretty much and should give the power to reach the area of 12680 and maybe 12800.
Trade can be entered at 12500 with tartet 12680 and stop 12380.


DAX in a crossroadI wrote a few days ago regarding a potential short setup, which has now materialised. The question is where will this end and are we going to see a bounce-back from this all-time highs. Price action will show, but for now I am short


Ger30 - DAX 60min. PingPongThe DAX is good to us, offering a good setup again.
If price is holding at the centerline, once or twice, the the ride to the U-MLH could work out.
P!


Weekly Dax analysis for 13.02-17.02Next week we can go upto 11840 and max down to 11480.
If Dax goes under 11640 till Friday we can see 11575 - 11500 - 11480 - 11400 and max 11200.
I will buy from 11690 - 11700 - 11720 - 11760 with TP 11805.
I will sell from 11805 - 11760 - 11735 - 11690 - 11640 - 11580 - 11540 - 11480 with TP 11408.

DAX 60min BULL dvg all indicators, shortterm couple of days?BULL dvg in MOM , RSI & MACD in 60min chart, often be a bullish sign.
BUT it's obviose a HS topformation, so here we have to be careful,
and watch careful for bearish sign's again, and if it turn down again....
This could also be used for a new better short-position again,
if that should appear :)
If it stay's over 650-700, that could also be even a stronger BULL-case.

Ger30: Long :Time To ride the Trump Wave :Long Dax with targets of 11800 - 12000 within november/by mid december ..
Wave 3 of Wave 5 in play !!
Jump on the Bull Ride Till it Lasts !!

Dax Short -> Long 13.01Sell Dax at 11530
SL 11565
TP 11400
Buy Dax at 11400
SL 11375
TP 11620
Range between 530 and 620
Under 530 it will go down to 480 - 400
Over 620 it will continue to 700
Good Luck!

