DAX One last push lower for a bottom.DAX has had the strongest 1D bearish candle today since December 15 2022. That was the candle that accelerated the correction from the Higher High Zone (red zone) of the long-term Channel Up to the Buy Zone (green zone). With the Channel Up pattern starting on the October 03 2022 market bottom and remaining valid up to now, this Buy Zone has been the most optimal long entry of the past four months.
We look at two indicators for buying, the 1D MA50 (blue trend-line) and the 1D RSI hitting the bottom of its Rectangle pattern and entering the Accumulation Mode. A -6.50% correction doesn't have to necessarily be completed as in late December. Our long-term target is the 0.786 Fibonacci Channel level, which an early projection giving us a 16350 Target.
-------------------------------------------------------------------------------
** Please LIKE 👍, FOLLOW ✅, SHARE 🙌 and COMMENT ✍ if you enjoy this idea! Also share your ideas and charts in the comments section below! **
-------------------------------------------------------------------------------
💸💸💸💸💸💸
👇 👇 👇 👇 👇 👇
Daxsignals

DAX on a potential medium-term correction.Since our analysis last month, DAX (DE40) hit our target by rising more than +12.50%, as the previous rally fractal within the +4 month Channel Up suggested. Right now the index is loosely supported by the 4H MA100 (red trend-line), having already broken it 3 times, but managed to close all of them back above it. As on December 06 2022, a 1D candle close below the 4H MA100 could trigger the start of a medium-term correction back to the 1D MA50 (blue trend-line). A -6.50% pull-back from the top can even put the price slightly below the 1D MA50 but still on the 0.236 Channel Fibonacci retracement level.
-------------------------------------------------------------------------------
** Please LIKE 👍, FOLLOW ✅, SHARE 🙌 and COMMENT ✍ if you enjoy this idea! Also share your ideas and charts in the comments section below! **
-------------------------------------------------------------------------------
💸💸💸💸💸💸
👇 👇 👇 👇 👇 👇

DAX on a thin thread eyeing the 1D MA50DAX is rebounding after holding the 4H MA50 (blue trend-line) and remains overbought on daily. The similarities with the November - December fractal evident and the 1D MA50 (red trend-line) untested since January 03, we expect a sharp short-term correction to it, if the 4H MA50 breaks again. The long-term pattern remains a Channel Up since the October 02 market bottom so our perspective is to take advantage of such short-term pull-backs and buy for the long-term.
-------------------------------------------------------------------------------
** Please LIKE 👍, FOLLOW ✅, SHARE 🙌 and COMMENT ✍ if you enjoy this idea! Also share your ideas and charts in the comments section below! **
-------------------------------------------------------------------------------
💸💸💸💸💸💸
👇 👇 👇 👇 👇 👇

DAX This Resistance makes all the differenceThe German stock index DAX broke today (and so far stays ahead of the Fed) above the 4H MA50 (blue trend-line). On our last analysis two weeks ago, we pointed out that a Channel Up similar to November's would form and its break-out will deliver the next move:
As you see, the price traded exactly within that short-term Channel Up and delivered excellent scalping opportunities to us. Right now it is still intact and we are still scalping, only willing to commit to the direction on the next break-out.
A break below it should be enough to target the 4H MA200 (orange trend-line) as it happened on December 28 and then rebound for another medium-term bullish leg. If the Double Top Resistance breaks first, we will go long regardless, targeting the top of February's Resistance Zone (15730). Further break will extend our selling to the 16300 All Time High.
On the downside, if the price closes below the 4H MA200/ 1D MA50, we will buy again at the bottom (Higher Lows trend-line) of the long-term Channel Up (blue) near the 13900 Support (December 16 Low).
-------------------------------------------------------------------------------
** Please LIKE 👍, FOLLOW ✅, SHARE 🙌 and COMMENT ✍ if you enjoy this idea! Also share your ideas and charts in the comments section below! **
-------------------------------------------------------------------------------
💸💸💸💸💸💸
👇 👇 👇 👇 👇 👇

DAX Pull-back to 4H MA200 likelyThe German stock index (DAX) is showing signs of exhaustion of the 2023 rally, following our strong buy signal last week. The 4H RSI hit and got rejected on the 84.600 Resistance level, which is where a Channel Up started on November 11 2022. The Channel Up made one last High before it broke below the 4H MA50 (blue trend-line) and started a correction (short-term) that hit the 4H MA200 (orange trend-line).
As a result, we believe it is worth to start building up sell positions for a medium-term pull-back to the 4H MA200. Keep in mind that the strongest long-term buy is when the 1D RSI approaches its oversold level of 30.000. That could happen, if DAX closes a 1D candle below the 4H MA200, near the bottom of the long-term Channel Up that started in early October.
The medium-term target is the 15500 - 15700 Resistance Zone of February and the long-term the All Time High of 16300.
-------------------------------------------------------------------------------
** Please LIKE 👍, FOLLOW ✅, SHARE 🙌 and COMMENT ✍ if you enjoy this idea! Also share your ideas and charts in the comments section below! **
-------------------------------------------------------------------------------
💸💸💸💸💸💸
👇 👇 👇 👇 👇 👇

DAX held the 1D MA50 going for the 9-month Resistance.DAX is on a very strong rebound after holding the 1D MA50 (blue trend-line) as Support, having closed all 1D candles above it since December 20. As mentioned on previous analyses, the target is the 14680 - 14950 Resistance Zone. We are looking to take profits on the first sign of rejection within that zone.
Beyond that, we will buy either after a 14950 bullish break-out, i.e. a 1D candle closing above 14950 and target the top (Higher Highs trend-line) of the Channel Up within 15300- 15400. That is located directly below the February Resistance Zone.
As long as the 1D MA50 holds, (i.e. candle closing above it), buy on the short-term and target 14680. A closing below the 1D MA50 should take DAX to the 1D MA200 (orange trend-line), located at the bottom (Higher Lows trend-line) of the Channel Up. Keep an eye also on the 1D RSI Buy Zone for medium-term buys.
-------------------------------------------------------------------------------
** Please LIKE 👍, FOLLOW ✅, SHARE 🙌 and COMMENT ✍ if you enjoy this idea! Also share your ideas and charts in the comments section below! This is best way to keep it relevant, support me, keep the content here free and allow the idea to reach as many people as possible. **
-------------------------------------------------------------------------------
You may also TELL ME 🙋♀️🙋♂️ in the comments section which symbol you want me to analyze next and on which time-frame. The one with the most posts will be published tomorrow! 👏🎁
-------------------------------------------------------------------------------
💸💸💸💸💸💸
👇 👇 👇 👇 👇 👇

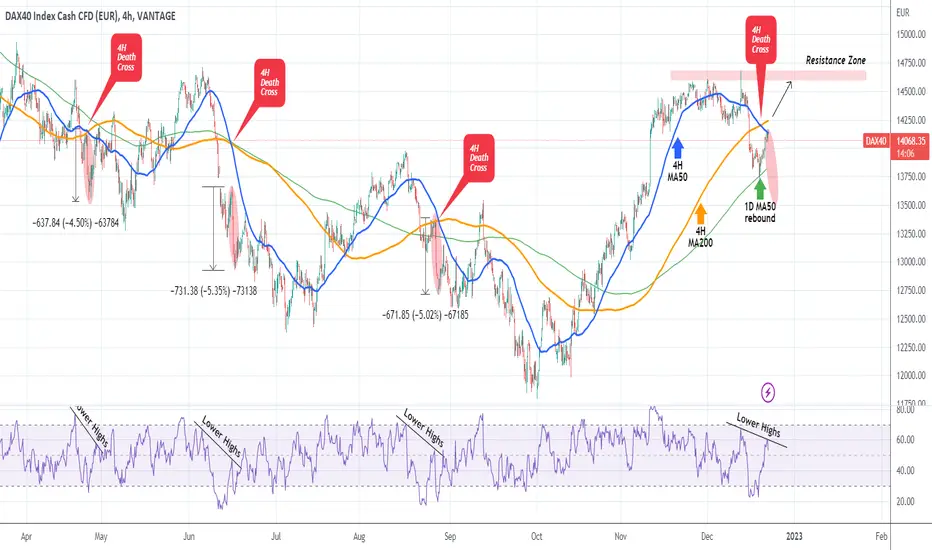
DAX Can it avoid the drop on this 4H Death Cross?The German stock index (DAX) just hit the 4H MA50 (blue trend-line) and it getting rejected. This pull-back has high probabilities of turning into a sustainable sell sequence to a Lower Low considering that just two days ago a Death Cross was formed on the 4H time-frame, which is when the 4H MA50 crosses below the 4H MA200 (orange trend-line).
In 2022 every 4H Death Cross failed on or below the 4H MA50 and made a Lower Low with an average -5% fall. A repeat of that would pull DAX down to 13500.
In order to avoid the consequences of the Death Cross, the price needs to close above the 4H MA200, in which case we will target the bottom of the 14570 - 14680 Resistance Zone.
Notice the Lower Highs pattern on the RSI how consistent it is as a bearish signal. We just formed a Lower High.
-------------------------------------------------------------------------------
** Please LIKE 👍, SUBSCRIBE ✅, SHARE 🙌 and COMMENT ✍ if you enjoy this idea! Also share your ideas and charts in the comments section below! This is best way to keep it relevant, support me, keep the content here free and allow the idea to reach as many people as possible. **
-------------------------------------------------------------------------------
You may also TELL ME 🙋♀️🙋♂️ in the comments section which symbol you want me to analyze next and on which time-frame. The one with the most posts will be published tomorrow! 👏🎁
-------------------------------------------------------------------------------
💸💸💸💸💸💸
👇 👇 👇 👇 👇 👇
DAX Can dip even lower with the RSI being the keyThe German stock index (DAX) has had a strongly bearish week as it got rejected just below the 14700 June 06 High, inside the greater Resistance Zone that is holding since March 29. As we mentioned last week, this is a much needed technical pull-back following the +24.50% rise since the October 03 Low. The 1D RSI got vastly overbought above 80.000 and it is only natural for the market to seek to normalize these levels.
The 1D RSI is now almost at 40.000 but based on the Support Zone (green) that has been holding for over a year, it can dip to 30.000 if not lower before DAX turns into a buy opportunity again long-term. This will most likely be below the 1D MA50 (blue trend-line) with the 1D MA200 (orange trend-line) being the 1st Support and the Higher Lows trend-line the 2nd.
-------------------------------------------------------------------------------
You may also TELL ME 🙋♀️🙋♂️ in the comments section which symbol you want me to analyze next and on which time-frame. The one with the most posts will be published tomorrow! 👏🎁
-------------------------------------------------------------------------------
💸💸💸💸💸💸
👇 👇 👇 👇 👇 👇

DAX 1D Golden Cross is bullish but mid-term indicates volatilityToday the German stock market (DAX) completed a Golden Cross pattern on the 1D time-frame, which is when the 1D MA50 (blue trend-line) crosses above the 1D MA200 (orange trend-line). That is technically a bullish formation and that is what we interpret it as, at least on the long-term. Historically a 1D Golden Cross delivers new Bull Phases on DAX and it was such a Cross that took it out of the last major Bull Cycle in 2009 (U.S. housing crisis).
On this study though we give particular attention to the previous two Golden Crosses, which all share similar characteristics to today's. Once the index broke above the Bear Phase's Lower Highs trend-line, the Golden Cross was formed shortly after, with the 1W RSI getting rejected on roughly the same level (red Resistance Zone). On both occasions the price pulled-back to at least the 1D MA200. That is currently at 13540 and should stay around this level through-out Q1 of 2023. If a similar Megaphone pattern transitions DAX into the new Bull Phase, then we expect the index to have bottomed around the 1D MA200 by the end of Q1 (March) 2023 and then rebound towards recovering its All Time High.
-------------------------------------------------------------------------------
** Please LIKE 👍, SUBSCRIBE ✅, SHARE 🙌 and COMMENT ✍ if you enjoy this idea! Also share your ideas and charts in the comments section below! This is best way to keep it relevant, support me, keep the content here free and allow the idea to reach as many people as possible. **
-------------------------------------------------------------------------------
You may also TELL ME 🙋♀️🙋♂️ in the comments section which symbol you want me to analyze next and on which time-frame. The one with the most posts will be published tomorrow! 👏🎁
-------------------------------------------------------------------------------
💸💸💸💸💸💸
👇 👇 👇 👇 👇 👇

DAX 's incredible 8 straight green week rally may come to an endThe German Index (DAX) hit last week its 1W MA100 (green trend-line) and early this week, the 1W candle is pulling-back in red. If it closes this way, it will be the first week of loss (red) since late September, running an amazing streak of 8 straight green ones.
With the 1W RSI almost reaching 65.000 for the first time since November 15 2021 (a whole year ago), a potential 1W MA100 rejection can draw comparisons with the post U.S. - China trade war recovery early in 2019. As shown on this chart, DAX pulled-back on the 2nd week after breaking above its 1W MA100 and the pull-back broke marginally below the 1W MA50 (blue trend-line).
A megaphone pattern of Higher Highs and Lower Lows took the price just below the 1W MA200 (orange trend-line) before recovering and post a strong rally that broke slightly above its Resistance Zone from the previous All Time Highs.
-------------------------------------------------------------------------------
** Please LIKE 👍, SUBSCRIBE ✅, SHARE 🙌 and COMMENT ✍ if you enjoy this idea! Also share your ideas and charts in the comments section below! This is best way to keep it relevant, support me, keep the content here free and allow the idea to reach as many people as possible. **
-------------------------------------------------------------------------------
You may also TELL ME 🙋♀️🙋♂️ in the comments section which symbol you want me to analyze next and on which time-frame. The one with the most posts will be published tomorrow! 👏🎁
-------------------------------------------------------------------------------
💸💸💸💸💸💸
👇 👇 👇 👇 👇 👇

DAX Crucial 1D MA200 test! Sell with low risk but BUY if broken!The German stock index (DAX) has been trading within a Channel Up (Higher Highs/ Higher Lows) since the September 29 bottom. Following the contact with the 4H MA50 (blue trend-line) on Wednesday's Fed Rate Announcement, the price has been rebounding strongly, aiming at the 1D MA200 (red trend-line).
Having already broken above the January 05 Lower Highs trend-line last week, that would be the most crucial test for the long-term trend as the 1D MA200 has been unbroken since February 02, practically throughout the whole Bear Cycle of 2022. If broken, expect a Higher High on the Channel Up that would test the 13980 August 16 High (Resistance 1) where a 1W closing above it can target further upwards the 14710 June 06 High (Resistance 2).
Until the 1D MA200 break-out happens though, DAX's Channel Up draws heavy comparisons with the July 14 - August 16 Channel Up, which eventually topped and started a new heavy sell sequence that made the current market Low. As you see the top was formed after a 4H MA100/200 Bearish Cross (4H MA100 green trend-line crossing below the 4H MA200 orange trend-line), which is the pattern that DAX just formed today. On top of that, the 4H RSI sequences of the two Channel Up patterns are very similar following an (a)-(b)-(c)-(d) pattern. That means that until the price breaks and closes above the 1D MA200, being that close to it, we can take a low risk/ high reward sell and target the 4H MA200 (orange trend-line).
-------------------------------------------------------------------------------
** Please LIKE 👍, SUBSCRIBE ✅, SHARE 🙌 and COMMENT ✍ if you enjoy this idea! Also share your ideas and charts in the comments section below! This is best way to keep it relevant, support me, keep the content here free and allow the idea to reach as many people as possible. **
-------------------------------------------------------------------------------
You may also TELL ME 🙋♀️🙋♂️ in the comments section which symbol you want me to analyze next and on which time-frame. The one with the most posts will be published tomorrow! 👏🎁
-------------------------------------------------------------------------------
👇 👇 👇 👇 👇 👇
💸💸💸💸💸💸
👇 👇 👇 👇 👇 👇

DAX Short-term bullish but heavy Resistance Zone ahead of ECB.The German stock index (DAX) has been trading within a Rising Wedge (dashed lines) since the October 02 bottom that is about to break. The 4H Golden Cross (4H MA50 (blue trend-line) crossing above the 4H MA200 (orange trend-line)) is a short-term bullish signal as the three times we had this pattern formed in 2022, the price rose more ranging from the 1.236 Fibonacci extension to the 1.5.
Moreover, the 1D RSI broke above its Lower Highs trend-line, adding more buying pressure. The 1.236 Fib is located exactly on the January 05 Lower Highs trend-line, which is basically the Resistance dictating the 2022 Bear Market, while the 1.5 is just below the 1D MA200 (green trend-line). That trend-line has been unbroken since February 02, so we are willing to buy (on the long-term) again only if the price breaks above it and target the previous Lower Highs. Until then, selling the Fib extensions on tight SLs is our approach, targeting the 4H MA200.
-------------------------------------------------------------------------------
** Please LIKE 👍, SUBSCRIBE ✅, SHARE 🙌 and COMMENT ✍ if you enjoy this idea! Also share your ideas and charts in the comments section below! This is best way to keep it relevant, support me, keep the content here free and allow the idea to reach as many people as possible. **
-------------------------------------------------------------------------------
You may also TELL ME 🙋♀️🙋♂️ in the comments section which symbol you want me to analyze next and on which time-frame. The one with the most posts will be published tomorrow! 👏🎁
-------------------------------------------------------------------------------
👇 👇 👇 👇 👇 👇
💸💸💸💸💸💸
👇 👇 👇 👇 👇 👇

DAX Hit the 4H MA200 for the first time in +1 month.DAX (FDAX1!) hit today the 4H MA200 (orange trend-line) for the first time since September 14. This is still technically a short-term bullish reaction (Channel Up) within two longer term bearish structures (Bearish Megaphone with the dashed lines and Falling Wedge o a broader frame). With the 4H RSI approaching its Resistance Zone, it is not unlikely to see a rejection by tomorrow back to the 4H MA50 (blue trend-line).
We have accurately laid out this information on our previous DAX analysis 10 days ago:
Basically as it happened from July 19 to August 12, we may see continuous pull-backs on that Zone as the price breaks the Bearish Megaphone to test the top of the Falling Wedge. On the long-term only a closing above the 1D MA200 (red trend-line), which is untested since February 02, can be enough to change the trend from bearish to bullish.
-------------------------------------------------------------------------------
** Please LIKE 👍, SUBSCRIBE ✅, SHARE 🙌 and COMMENT ✍ if you enjoy this idea! Also share your ideas and charts in the comments section below! This is best way to keep it relevant, support me, keep the content here free and allow the idea to reach as many people as possible. **
-------------------------------------------------------------------------------
You may also TELL ME 🙋♀️🙋♂️ in the comments section which symbol you want me to analyze next and on which time-frame. The one with the most posts will be published tomorrow! 👏🎁
-------------------------------------------------------------------------------
👇 👇 👇 👇 👇 👇
💸💸💸💸💸💸
👇 👇 👇 👇 👇 👇

DAX Broke the 4H MA50. Bearish extension.The German stock index (DAX) broke below its 4H MA50 (blue trend-line) on Friday after failed to break and being rejected on the 4H MA100 (green trend-line) earlier this week. This keeps the price inside both the short-term Bearish Megaphone pattern and the longer term Falling Wedge pattern.
That break is a major sell break-out signal and targets directly the 11875 Support. Below that we can only take an extension if DAX makes a closing below the bottom (Lower Lows trend-line) of the Falling Wedge. Otherwise as the price approaches the 11875 Support, it becomes a buy opportunity towards the 4H MA200 (orange trend-line).
-------------------------------------------------------------------------------
** Please LIKE 👍, SUBSCRIBE ✅, SHARE 🙌 and COMMENT ✍ if you enjoy this idea! Also share your ideas and charts in the comments section below! This is best way to keep it relevant, support me, keep the content here free and allow the idea to reach as many people as possible. **
-------------------------------------------------------------------------------
You may also TELL ME 🙋♀️🙋♂️ in the comments section which symbol you want me to analyze next and on which time-frame. The one with the most posts will be published tomorrow! 👏🎁
-------------------------------------------------------------------------------
👇 👇 👇 👇 👇 👇
💸💸💸💸💸💸
👇 👇 👇 👇 👇 👇

DAX Lower bottom and recovery signal on 8-year patternThe German stock index (DAX) has been trading under Lower Highs ever since the late December All Time High (ATH). Ignoring the March 08 2022 breach due to the Ukraine - Russia war, the pattern is a Channel Down. The last two times DAX traded within a Channel Down was for the whole year of 2018 and April 2015 - July 2016. Both correction were almost a year and took place due to bearish fundamentals (U.S. - China trade war and Brexit, Grexit, VW scandal Oil respectively).
Both previous Channel Down patterns made their bottom on the 1.236 Fibonacci extension from the previous Lower Low. If we apply this on the current Channel Down, we get the 1.236 Fib a little over 11400. That is roughly the low of the November 2020 U.S. Presidential election.
In all patterns, the RSI trades under Lower Highs (with the exception of the actual ATH) way before the index top (indicating that strength was lost earlier), and when the RSI broke above that trend-line, it coincided with the price breaking above the Channel Down, thus starting a new 1 year Bull Phase.
------------------------------------------------------------------------------------------
** Please LIKE 👍, SUBSCRIBE ✅, SHARE 🙌 and COMMENT ✍ if you enjoyed this idea! Also share your ideas and charts in the comments section below! This is best way to keep it relevant and support me and allow the idea to reach as many people as possible. **
------------------------------------------------------------------------------------------
You may also TELL ME 🙋♀️🙋♂️ in the comments section which symbol you want me to analyze next and on which time-frame. The one with the most posts will be published tomorrow! 👏🎁
------------------------------------------------------------------------------------------
👇 👇 👇 👇 👇 👇
👇 👇 👇 👇 👇 👇
👇 👇 👇 👇 👇 👇

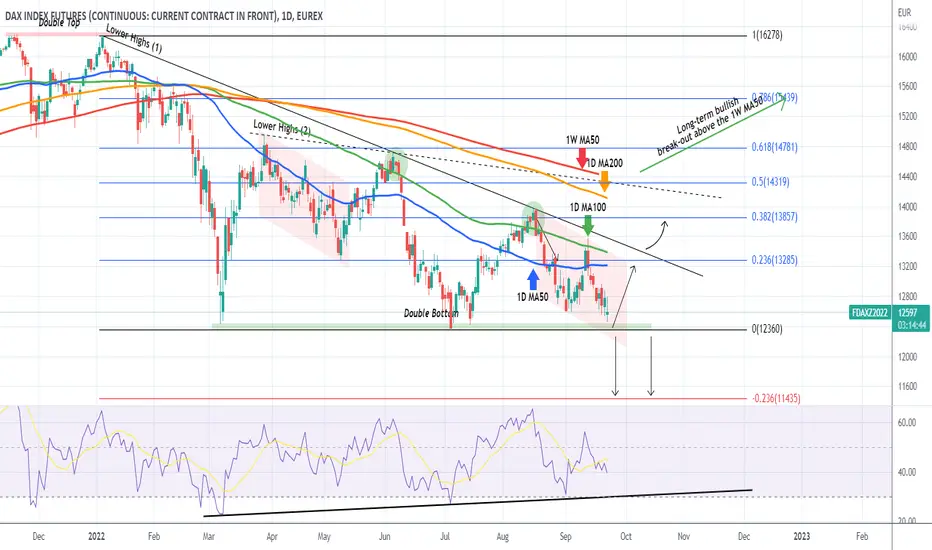
DAX Testing the March Support. Potential Triple Bottom.The DAX futures index (FDAX1!) followed exactly what we pointed out on our last analysis more than a month ago, as it got rejected on the All Time High Lower Highs trend-line (1) and is now approaching the Support Zone that started after the March 07 Low:
As you see, that Support Zone has so far made a Double Bottom (March 07 and July 05) and along with the Lower Highs trend-line (1) have formed a massive Descending Triangle that is on the verge of breaking out. With the 1D RSI on Higher Lows since March 07, a bullish break-out is quite likely and it should target the 1D MA200 (orange trend-line) around the 0.382 Fibonacci retracement level. Note that the 1D MA200 has been untouched since February 02. However no further buying can be engaged with as the price will still be limited to the Lower Highs trend-line (2). In our opinion, only a break above the 1W MA50 (red trend-line) can restore the bullish sentiment on DAX on the long-term.
If on the contrary the 12360 Support breaks, we expect aggressive selling that can target the -0.236 Fibonacci extension around 11435.
--------------------------------------------------------------------------------------------------------
** Please support this idea with your likes and comments, it is the best way to keep it relevant and support me. **
--------------------------------------------------------------------------------------------------------
DAX testing its first Support, the 1D MA50The German Stock Index (DAX) got emphatically rejected on its January Lower Highs trend-line, as we anticipated with our previous analysis two weeks ago:
The price broke below the 1D MA100 (green trend-line) and hit the 1D MA50 (blue trend-line), which is the first line of Support. As long as it closes above it, chances are that we will rise and re-test the Lower Highs (1) trend-line. A close below though, calls for a sell extension towards the 12400 Support, currently a Double Bottom.
Notice how the RSI on the 1W time-frame got rejected exactly on the 48.80 Resistance, which was where the June 06 High was made. That matches the Lower Highs as well. A break above this Resistance, would be an additional factor indicating that the long-term trend may be shifting from bearish back to bullish.
Technically, only a break above the 1D MA200 (orange trend-line)/ 1W MA50 (red trend-line) Resistance cluster, constitutes a long-term bullish break-out.
--------------------------------------------------------------------------------------------------------
** Please support this idea with your likes and comments, it is the best way to keep it relevant and support me. **
--------------------------------------------------------------------------------------------------------

DAX broke above the 1D MA100. Important Lower High test.The German Index DAX (FDAX) is attempting today a 1D candle closing above the 1D MA100 (green trend-line) and if successful it will be the first since June 07. Despite the bullish short-term action, this is not the time to double down on buying as the January 05 Lower Highs trend-line (1) is right above, providing Resistance. On top of that, the 0.382 Fibonacci retracement level is at 13855.
Only a break above the LH (1) can justify further buying, targeting the 1D MA200 (orange trend-line) and the 0.5 Fib. Until then, it is likely to see a rejection and short-term pull-back to test the 1D MA50 (blue trend-line) as Support. Note that if the index breaks above the 1W MA50 (red trend-line), we can claim that the trend will turn bullish on the long-term.
A strong sign that we may be turning bullish on the long-term is the fact that the RSI on the 1W time-frame is on Higher Highs since March 21 with the price rebounding after the Double Bottom. We saw the exact opposite formations right before the 2022 correction started. Price formed a Double Top while the 1W RSI was on Lower Highs.
--------------------------------------------------------------------------------------------------------
Please like, subscribe and share your ideas and charts with the community!
--------------------------------------------------------------------------------------------------------

DAX made a major bullish break-out.DAX is now trading above the 1D MA50 (blue trend-line) for the third straight session with the 1W RSI at its highest level since late January. The 0.618 Fibonacci retracement level (14800) is just below the 14950 Resistance formed by the March 29 High.
That is a short-term target, buying after that can be justified only by a 1D candle close above the 1D MA200 (orange trend-line), in which case we will look for a complete gap closing at 16275.
--------------------------------------------------------------------------------------------------------
Please like, subscribe and share your ideas and charts with the community!
--------------------------------------------------------------------------------------------------------

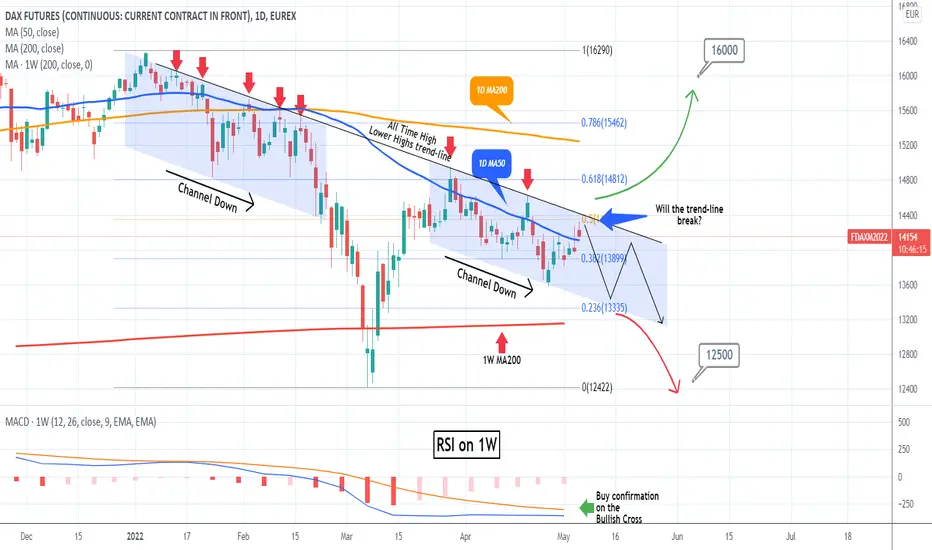
DAX Bearish unless this trend-line breaks.In the past month, I've made a case why DAX remains a long-term sell. The key parameter is the Lower Highs trend-line that started after the index made a (near) All Time High on January 05. As you see, the price has been rejected on that trend-line countless times already and on today's 1D candle, it has come the closest since the April 21 rejection.
A new rejection there, should extend the Channel Down, towards a new Lower Low around 13400. A break above the All Time High Lower Highs trend-line should be enough to reverse the long-term market sentiment from bearish to bullish. Keep in mind that the whole pattern since January, resembles a giant Inverse Head and Shoulders on a slope, with the two Channel Down patterns possibly serving the role of the Shoulders and the March 07 dip the role of the Head.
Keep an eye on the 1W RSI. A Bullish Cross will most likely confirm the sentiment shift from long-term bearish to bullish. In that case, target 16000. If on the other hand the Channel Down breaks to the downside, we may see accumulated selling similar to the February 24 break-out. In that case, I expect at least 12500.
--------------------------------------------------------------------------------------------------------
Please like, subscribe and share your ideas and charts with the community!
--------------------------------------------------------------------------------------------------------
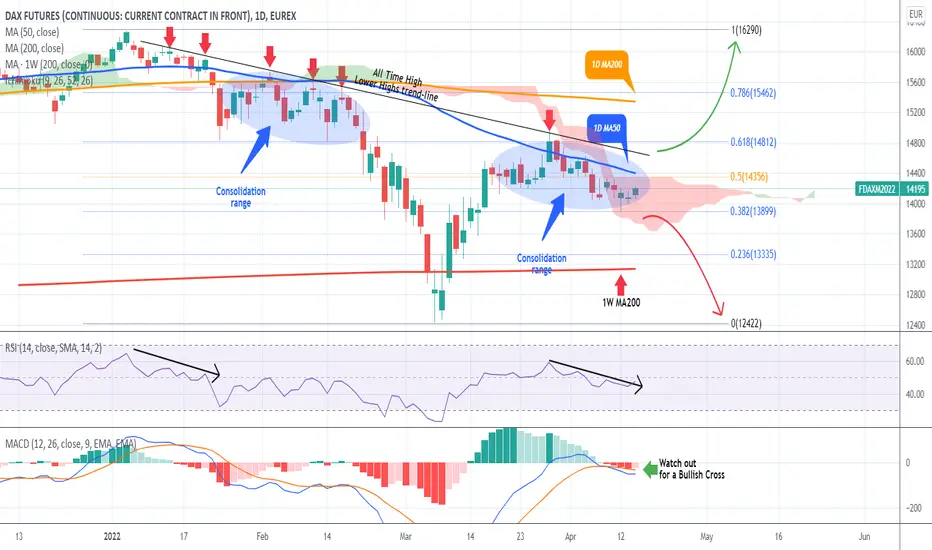
DAX Still consolidating. Trade the break-out.Not much have changed on the German stock market (DAX) as the price is still consolidating within the All Time High Lower Highs trend-line of January (Resistance) and the 0.382 Fibonacci retracement level (Support).
Being below the 1D MA50 (blue trend-line) as well, scalpers may find some value trading the 1D MA50 - 0.382 Fib Zone but a lower risk trade lies on the break-out, either above the Lower Highs trend-line (bullish targeting the 1D MA200 (orang trend-line) and then the All Time High) or below the 0.382 Fib (bearish towards the 0.236 Fib/ 1W MA200 (red trend-line) and then the March lows.
While the 1D RSI favors the downside, keep an eye on the MACD for a Bullish Cross, which will shift the sentiment upwards. Also on a longer-term horizon, this looks like an Inverse Head and Shoulders on a declining trend with the ATH Lower Highs trend-line as the Resistance to break. And that is typically a bottom pattern calling for a trend reversal to the upside.
--------------------------------------------------------------------------------------------------------
Please like, subscribe and share your ideas and charts with the community!
--------------------------------------------------------------------------------------------------------
DAX Last week's trading plan intactDAX eventually followed the trading plan suggested last week, as the price turned neutral into a consolidation range, following the rejection on the All Time High Lower Highs trend-line:
The strategy is still valid. As long as the Lower Highs trend-line holds and the 0.382 Fibonacci retracement level supports, we can keep scalping for medium-term profits. A break above the Lower Highs is a bullish break-out signal targeting the 16290 High, while a break below the 0.382 Fib (13900) is a bearish break-out signal targeting initially 13350 (March 10 Low).
Notice that in RSI terms (portrayed on the 1D time-frame), it has started trading downwards on Lower Highs, similar to January. That was when the correction trend of the Lower Highs started.
--------------------------------------------------------------------------------------------------------
** Please support this idea with your likes and comments, it is the best way to keep it relevant and support me. **
--------------------------------------------------------------------------------------------------------

DAX rejected on Lower Highs. Unless broken, consolidation ahead.DAX broke and closed yesterday above the 4H MA200 (orange trend-line) for the first time since January 20. Despite this bullish development, the index failed to break above the long-term Lower Highs trend-line of the correction, which has been holding and rejecting the price (6 rejections including yesterday's) since after the All Time Highs.
The last time that happened, DAX consolidated for more than 2 weeks (February). As a result, as long as it fails to break above the Lower Highs, it is more likely to see a consolidation within roughly 14800 - 14100, which as you see is within the zone of the 0.618 - 0.382 Fibonacci retracement levels.
A break (and 1D candle closing) above the Lower Highs, should be enough to extend this bull run all the way to the 16290 All Time Highs. Similarly a break below the 0.382, could restore the bearish sentiment back to the 12420 March low.
--------------------------------------------------------------------------------------------------------
** Please support this idea with your likes and comments, it is the best way to keep it relevant and support me. **
--------------------------------------------------------------------------------------------------------
