XAUUSD 4H: Bullish Continuation Trade SetupKey Observations:
Bullish Momentum: The chart displays a large bullish candle breaking significantly upward just before the potential entry point. This suggests strong recent buying pressure and momentum.
Support Zone: A "Support Zone" is highlighted in red/blue, centered around the Entry Point of 4,080.06 and 4,079.58. This zone likely represents a recent area of consolidation or previous resistance that has been broken and is expected to now act as support.
Entry and Exit:
Entry Point: ≈4,080.06 (indicated by the solid line at the bottom of the green potential profit box).
Stop Loss (Risk): 4,065.61 and 4,065.63 (indicated by the bottom of the red box, representing the maximum acceptable loss).
Take Profit (Reward): 4,100.22 (indicated by the dashed line at the top of the green box, representing the target price).
Risk/Reward Ratio (R:R): The setup suggests a favorable risk/reward ratio, as the potential profit (distance from Entry to Take Profit) is visibly larger than the potential loss (distance from Entry to Stop Loss).
Calculation: Risk ≈4080.06−4065.61=14.45. Reward ≈4100.22−4080.06=20.16. The R:R is ≈20.16/14.45≈1.39:1.
Trading Hypothesis:
The strategy shown is a "buy the pullback" or "continuation" strategy. The expectation is that after the initial sharp bullish move, the price might briefly pull back to the identified Support Zone (the Entry Point) before continuing its upward trajectory toward the Take Profit target of 4,100.22.
Daytrading

GBPUSD: Testing Daily HTLKey Observations
Daily Timeframe
EMA20 crosses below EMA60 > signals a weak downtrend
Overall, this pair is topping out given the lower high formed
H1 Timeframe
Price fails to hold above the EMA band as it quickly cross below it
Very likely momentum to the downside will pick up

XAUUSD Bullish Retracement Opportunity: Targeting $4,030 ?(XAUUSD) price action, focusing on a recent strong move and a potential reversal setup.
1. Key Price Action
Prior Uptrend: The chart shows a significant, powerful bullish move leading up to the $4,030–$4,040 area, evidenced by a series of large, green (bullish) candlesticks. This indicates strong buying pressure and momentum preceding the current segment.
Recent Sell-off/Correction: Following the high, the price experienced a sharp sell-off (red candlesticks), bringing it back down significantly.
Current Bounce and Retracement Area: The price has bounced off a lower area and is now currently trading around $4,012.48.
2. Proposed Trading Scenario (Technical Pattern)
The black and green arrow indicates a potential bullish reversal/continuation pattern:
Potential Retracement/Support Zone: The cyan-shaded rectangle, roughly between $3,990 and $4,005, appears to be a demand zone or a zone of prior support/resistance that the price is expected to re-test. The proposed path shows the price first pulling back to this zone before resuming its ascent.
Planned Trajectory: The indicated path suggests a "dip-buying" strategy, where a trader would wait for a pullback into the support/demand zone (the cyan box) and then enter a long position.
Target 1 (T1): $4,030.42: This is the immediate target, likely a re-test of a recent swing high or a key resistance level.
Target 2 (T2): $4,040.00: This is the secondary target, indicating an expectation for the price to break the first resistance and continue higher to test the ultimate recent high or the next significant resistance level.
3. Conclusion
The analysis suggests a bullish outlook in the short to medium term, following an initial retracement. The trading plan hinges on the cyan box holding as a key support/demand zone to facilitate a push back toward the recent high, aiming for new short-term highs at $4,030 and $4,040. This is a classic "buy-the-dip" setup within a broader context of strong upward momentum.

YALLA XAUMO — WEEKLY COMPREHENSIVE (Confluence Edition)YALLA XAUMO — WEEKLY COMPREHENSIVE (Confluence Edition)
Educational only — not financial advice. Timezone: Africa/Cairo.
1) Snapshot & Map
Spot (XAUUSD): ~4012.8
Distribution Gate: 4022–4029 → unlocks 4046 → 4059.2 → 4090
Uploading bands (supports): 3985 (≈VWAP) • 3970.65 (15m swing low) • 3944.2 (H1/H4 base)
Context: Uptrend intact; repeated probes of 4029 with liquidity building below.
2) GC Futures Structure (COMEX)
GC1 (front): 4036.2
GC2 (next): 4054.4
Term spread: +0.45% → Contango (healthy carry)
Read: Spot marginally under GC1 → synced. Breakout quality improves if the spread flattens during a push.
Plain-English futures curve explainer (always included):
Contango → GC2 > GC1: a normal upward curve; storage/carry cost is priced in (not inherently bearish).
Backwardation → GC2 < GC1: often signals strong near-term demand or short supply.
Term spread (%) → % difference between GC2 and GC1 that shows whether the curve is rising or falling.
3) Fib-Kicker Volume Matrix
(Directional read; volumes summarized from your charts.)
Uploading = accumulation; Offloading = distribution at resistance.
4) Ichimoku Regime Table
15m: Price above cloud; Tenkan > Kijun; Chikou free above price → Bias +
1h: Touching/above Kijun; future cloud slightly up → Bias + (light)
4h: On/near cloud edge; needs a clean 4h close >4029 → Neutral → +
Daily: Well above cloud, stretched from Kijun → Bias ++
Weekly: Above cloud; major trend up → Bias ++
5) Schabacker Patterns (concise)
4h: Flag/rectangle build over 3985–4005.
Daily: Ongoing ascending structure; measured pushes toward 4046/4059.
Weekly: Extended uptrend; 4090 as decision/supply.
6) POC / VAL / VAH / VWAP Table
15m: POC ~4004 • VAL ~3996 • VAH ~4015 • VWAP ~4003
1h: POC ~4006 • VAL ~3992 • VAH ~4022 • VWAP ~4003
4h: POC ref ~3975.15 • value area rising toward ~4020 • VWAP wkly > 3995
Daily: POC 4012 • VAL 3995 • VAH 4029 • VWAP 4003
7) XAUMO Trend Map
15m: 62% Up — buy dips above VWAP 4003
1h: 58% Up — holding >4012 strengthens breakout odds
4h: 55% Neutral→Up — decision >4029
Daily: 68% Up — targets 4046/4059
Weekly: 72% Up — 4090 supply/trim zone
Composite bias: +61% Up — Prefer buy-the-dip; avoid chasing without RVOL & positive delta.
8) Kicker Improvement (Fib + Price Projections)
Gate: 4022–4029
Kickers: 4046 → 4059.2 → 4090
Below gate: Layered support 4003 → 3985/3971; 3944 break would invalidate the weekly bull case.
9) Trade Scenarios
A) Swing — Long (bias)
Type: Buy Limit on pullback into 3985–3971
Entry: 3988 ±
SL: 3961
TP1/TP2/TP3: 4029 / 4059 / 4090
Probability: 62% ↑
Confirmation: RVOL ≥ 1.1 + positive delta + 1H close above 4012/VWAP.
B) Reversal / Edge-Fade — Short (conditional)
Type: Sell Limit from 4046–4059 only on strong rejection
SL: 4066
TP1/TP2/TP3: 4029 / 4011 / 3995
Probability: 48% ↓
Confirmation: Negative delta + failure to close 1H above 4059 + RVOL rolls < 0.9.
Invalidation: 4H close >4066.
C) Scalping — Long (execution)
Type: Buy Stop >4022; add only after 15m/1h close >4029
SL: 4014
TP1/TP2: 4036 / 4046 (move SL to BE after TP1)
Probability: 58% ↑
Confirmation: RVOL ≥ 1.2, green delta, no sharp sell-off at 4046.
10) (Quick Kicker Reference)
4022 is ignition; sustained closes >4029 activate 4046 → 4059.2; 4090 is weekly decision/supply.
11) Macro Calendar — Week Ahead (Cairo)
Mon: Central-bank speaks / bill auctions.
Tue: Sentiment/Business surveys; secondary inflation prints.
Wed: Key inflation/central-bank minutes (if scheduled).
Thu: US jobless claims + activity gauges.
Fri: Consumer sentiment / inflation expectations.
Always re-check your platform calendar for exact times and adjust risk.
12) Arabic Quick Summary (one-liner)
Uptrend, buy dips 4003/3985, gate 4022–4029 → 4046/4059, fade 4046–4059 only with rejection & red delta, break 3944 kills weekly bull.
13) Quick Reference (levels)
Supports: 4003 • 3985 • 3970.65 • 3944.2
Gate: 4022–4029
Upside: 4046 → 4059.2 → 4090
Invalidation (Swing): Daily break <3944.
Disclaimer: Educational content only; not investment advice. Trading involves substantial risk.
🏆 Winners trade with XAUMO

BTC/USD Bullish Reversal Setup from Demand Zonea potential bullish retracement setup on Bitcoin (BTC/USD) in the 1-hour timeframe. After a strong bearish move, price entered a highlighted demand zone, suggesting a possible short-term reversal. The projection shows a rebound from this support area toward Target 1 (118,472) and Target 2 (119,404), with a Stop Loss positioned below the recent swing low at 115,628.

XAUUSD - Bullish Reversal Zone Forming Near 3945 | SMCGold (XAUUSD) is showing potential bullish signs after reacting from the previous day’s low at 3945.
Price tapped into the Fibonacci 0.5–0.618 retracement zone, aligning perfectly with demand imbalance on the 15-min timeframe.
Key Insights:
📉 Previous Day Low: 3945 acts as liquidity grab zone
🟨 Fib Confluence: 0.5–0.618 golden pocket
🔄 Expectation: Possible pullback → higher low → push toward 3990–4020
📈 Bullish confirmation above 3980
🚫 Invalid below 3940 (clean break of structure)
This setup aligns with Smart Money Concepts (SMC) — expecting a liquidity sweep + market structure shift before continuation.

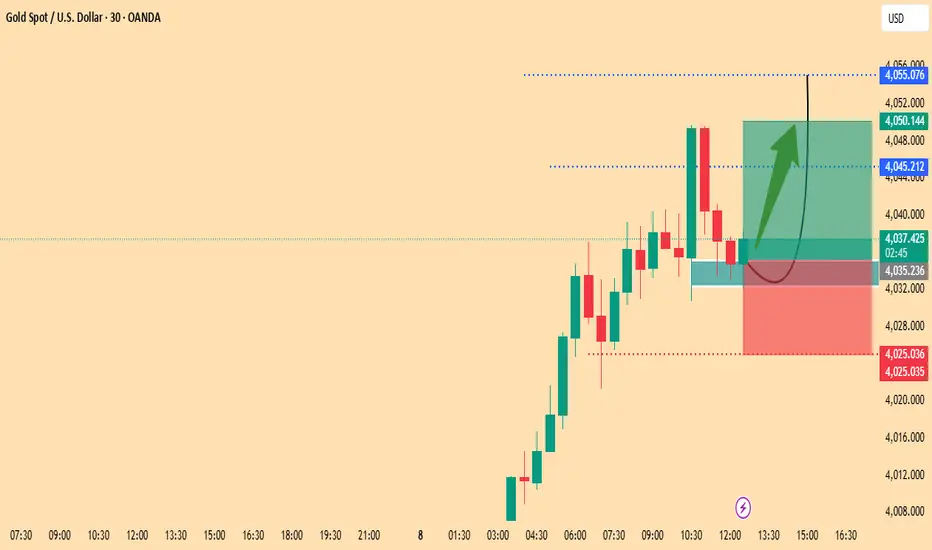
Bullish Retracement Setup on Gold (XAU/USD)a bullish retracement setup on Gold (XAU/USD) in the 30-minute timeframe. After a downward correction, price has bounced from a minor support zone and is now showing signs of recovery toward the previous resistance area (target zone). The setup features a defined entry zone, stop-loss below the support, and target at the resistance level—indicating a favorable risk-to-reward ratio for a long (buy) position.

EURSEK: Trend ContinuationKey observations on the daily and H1 timeframes below.
Daily Timeframe:
Price is holding below HTL
Downtrend is indicated by EMA20 below EMA60
H1 Timeframe:
Price is accelerating away from EMA band
Sell stop set to enter when price breaks out of the micro-range
Gold Retesting Support – Bullish Continuation ExpectedGold (XAU/USD) is showing strong bullish momentum after a brief consolidation around the support zone. Price is currently retesting the breakout level, indicating potential continuation toward the upper resistance area. The bullish engulfing candles and higher lows suggest sustained buying interest, favoring long positions above the support level.
Gold (XAU/USD) – Bullish Continuation Setup Toward $4,000 Target
You said:
Uploaded image
analyze this chart and give suitable chart
ChatGPT said:
This chart shows the Gold Spot (XAU/USD) on the 1-hour timeframe, and it outlines a potential long (buy) setup. Let’s break down the analysis:
🧠 Chart Overview
Instrument: Gold Spot / U.S. Dollar (XAU/USD)
Timeframe: 1 Hour
Broker Feed: OANDA
Current Price: ≈ 3,960.21 USD
Date: October 7, 2025
📊 Technical Analysis
1. Trend Context
The recent candles show higher lows forming after a small pullback — a sign of bullish continuation.
Price structure indicates accumulation around the 3,950–3,960 range before a potential push upward.
2. Support and Resistance
Support Zone: ~3,940.93
→ This acts as the base for the bullish setup; a break below may invalidate the trade.
Target / Resistance Zone: ~4,001.07
→ This is the projected take-profit zone, near a psychological level (4,000), which often acts as a strong barrier.
3. Trade Setup Summary
Entry Zone: Around 3,960.60 (current price)
Stop Loss: Around 3,935.12
Take Profit: Around 4,000.84
This gives an approximate Risk-to-Reward Ratio (RRR) of 1:2, which is a favorable setup for swing or intraday traders.
📈 Outlook
Bias: Bullish (buy)
Confirmation Needed: A break and close above 3,965 on the 1H chart with increasing volume.
Invalidation: A 1-hour candle close below 3,940 would suggest bearish momentum or a false breakout.

EURAUD: DowntrendKey Observations
Daily Timeframe
EMA20 is slightly lower than EMA60 and price is below both to indicate weak downtrend
However, price is also holding below a daily HTL so buying pressure also remains weak or non-existent
H1 Timeframe
Price is exiting away from the EMA band and below both EMA20 and EMA60 to indicate high probability of downside momentum
If price crosses below the ATL, that's a further indication of downside momentum

XAU/USD Short-Term Buy Opportunity Near $3,950 SupportCurrent price: around $3,949.60
Support zone: near $3,940
Resistance targets: around $3,962, $3,965, and $3,970
Setup type: A long position with a defined entry near current price, stop loss just below $3,940, and take profit around $3,962–$3,970.
The green box indicates the reward zone, while the red box shows the risk area.
✅ Interpretation: The trader anticipates a short-term bullish rebound after a corrective move down.

AUDUSD: Trend ContinuationKey Observations
Daily Timeframe:
EMA20 remains above EMA60 > uptrend indication
Price holds above HTL > no strong downside momentum
H1 Timeframe:
Price crossed above DTL and holds
Price pulled back to DTL and held above it
Price also exited EMA band with momentum strength

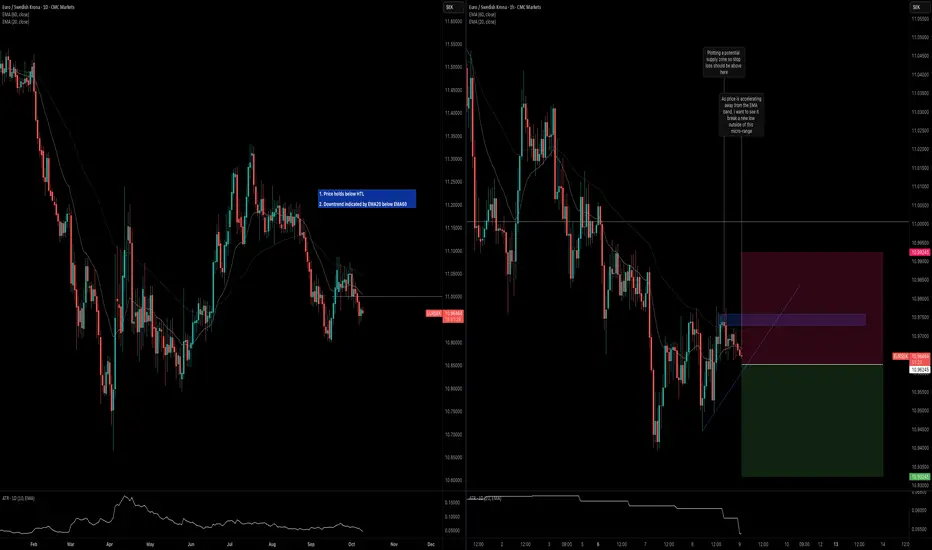
EURSEK: Trend ContinuationKey Observations
Daily Timeframe:
Price breaks HTL and shows downtrend confluence with EMAs
EMA20 is also expanding away from EMA60 to indicate the downtrend continuation
H1 Timeframe:
Swinging this downtrend as intraday upside is exhausted
Price is also showing confluence with EMA20 and EMA60

USDCAD: H1 ConfluenceKey Observations
Daily Timeframe:
On Friday's close last week, price held above the daily level
This week's open indicate price is likely held supported
H1 Timeframe:
There's confluence on the H1 timeframe where price is crossing above the DTL
Price is also moving away from the EMA band, which indicates momentum could be picking up here

GBPJPY Sell SetupGBPJPY sell set up firstly, Price already took out a buy side liquidity and closed with two momentum candles in 4 hours timeframe and also swept liquidity, an indication that Price might want to go to the downside, so wait for a level support and resistance breakout and we enter

AUDUSD: Momentum Picking UpKey observations
Daily Timeframe:
Price holds above EMA20 and bullish bar indicates potential upside momentum
EMA20 remains above EMA60 to technically indicate uptrend
H1 Timeframe:
Price cross above DTL to indicate upside momentum
Price also crossing above EMA20 to indicate uptrend resumption

AUDCAD: DTL BreakoutDaily Timeframe:
Bullish bar on market open indicates strength
Bullish bar also covering dojis on two previous days
H1 Timeframe:
Price crosses above DTL as first indication of momentum
Price is above crossing above EMA20
EMA20 is also expanding away from EMA60
Price crossing back above EMA60 indicates bearish sentiment is unlikely to hold

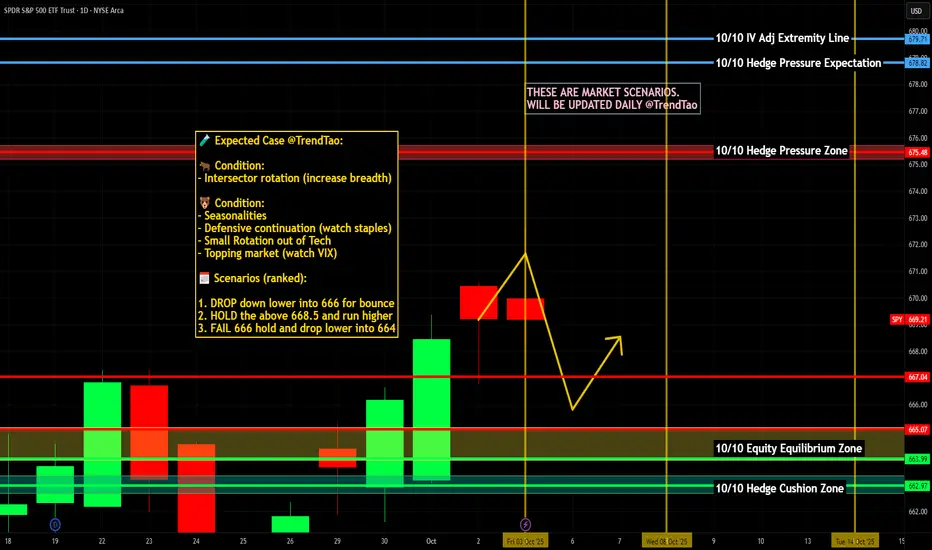
$SPY / $SPX Scenarios — Week of Oct 6 → Oct 10, 2025 🔮 AMEX:SPY / SP:SPX Scenarios — Week of Oct 6 → Oct 10, 2025 🔮
🌍 Market-Moving Headlines
🚩 Shutdown overhang: Some data (Trade, Jobless Claims, Budget) remain at risk of delay; markets lean on Fed tone instead.
📉 Fed-heavy week: Nearly every regional president and governor is on deck — tone from Powell (Thu) + FOMC Minutes (Wed) = the core catalyst.
💻 Earnings prep: Q3 pre-announcements begin — NASDAQ:AAPL NASDAQ:MSFT NASDAQ:NVDA remain leadership barometers.
💵 Rates & positioning: 10Y yields and USD remain key drivers into mid-month CPI/PPI stretch.
📊 Key Data & Events (ET)
Mon 10/6
⏰ 5:00 PM — Jeff Schmid (Kansas City Fed) speech
Tue 10/7
⏰ 🚩 8:30 AM — U.S. Trade Deficit (Aug)
⏰ 3:00 PM — Consumer Credit (Aug)
🗣️ Fed Speakers — Bostic (10:00), Bowman (10:05, 8:35, 8:45), Miran (10:45, 4:05), Kashkari (11:30)
Wed 10/8
⏰ 🚩 2:00 PM — FOMC Minutes (September Meeting)
🗣️ Fed Speakers — Musalem (9:20), Barr (9:30, 5:45), Kashkari (3:15), Goolsbee (7:15)
Thu 10/9
⏰ 🚩 8:30 AM — Initial Jobless Claims (Oct 4)
⏰ 🚩 8:30 AM — Fed Chair Powell remarks (opening keynote)
⏰ 10:00 AM — Wholesale Inventories (Aug)
🗣️ Fed Speakers — Bowman (8:35, 8:45, 3:45), Kashkari + Barr (12:45), Daly (4:10, 9:40 PM)
Fri 10/10
⏰ 🚩 10:00 AM — Consumer Sentiment (Prelim, Oct)
⏰ 2:00 PM — U.S. Federal Budget (Sept)
🗣️ Fed Speakers — Goolsbee (9:45)
⚠️ Disclaimer: Educational/informational only — not financial advice.
📌 #trading #stockmarket #SPY #SPX #Powell #FOMC #Fed #joblessclaims #tradebalance #consumerconfidence #shutdown #bonds #Dollar #megacaps #economy
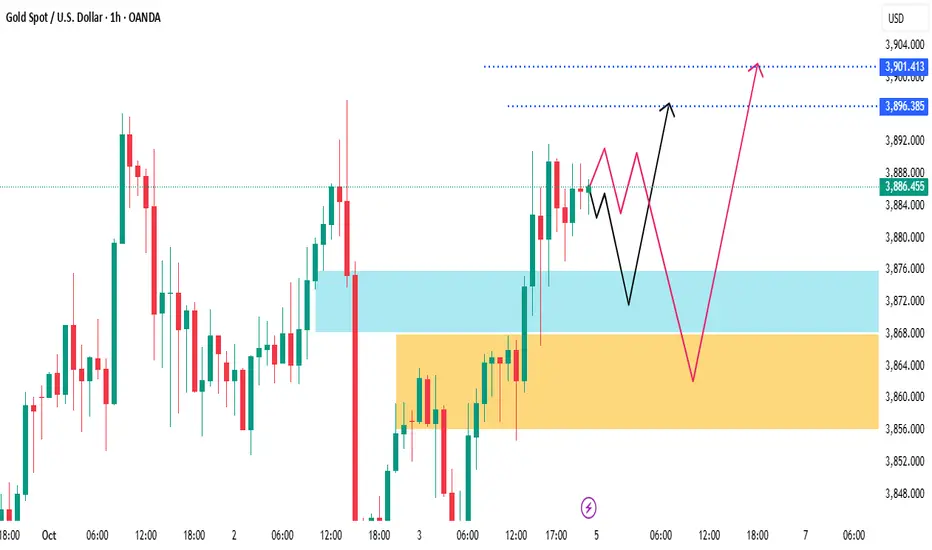
Gold Price Setup: Pullback Before Breakout ?🔎 Key Elements Identified:
Current Price: $3,886.455
Zones:
Blue Zone (~$3,872–$3,880): Minor support zone — recent breakout retest area.
Orange Zone (~$3,856–$3,868): Strong demand zone — deeper retracement area.
Resistance Targets:
$3,896.385: Local resistance.
$3,901.413: Extended upside target.
🛠️ Price Projections:
Black Path (Shallow Pullback):
Small dip into blue zone.
Reversal and break above $3,896 → Target: $3,901.
Red Path (Deeper Pullback):
Deeper drop into orange demand zone (~$3,860).
Strong bullish reversal expected → Same final target: $3,901+.
Gold (XAU/USD) Bullish Reversal Setup with Short-Term ?✅ Trade Setup Summary:
Trade Type: Long (Buy)
Entry: Around $3,860.17
Stop Loss: $3,850.01
Take Profit Levels:
TP1: $3,870.32 (minor resistance)
TP2: $3,872.93 (next significant resistance)
TP3: $3,875.01 (potential breakout target)
TP4 (Extended): $3,880.01 (final target zone)
🔍 Technical Observations:
Reversal Pattern: After a steep drop, the price is showing signs of a bullish reversal with a series of higher lows.
Support Level: The $3,850.01 area acted as a strong support zone.
Bullish Momentum: Green candles dominating the recent session show buyers regaining control.
Resistance Zones: Blue dotted lines indicate key resistance levels where price may face selling pressure.
Risk-Reward Ratio: The current setup offers a favorable risk-reward, especially if price breaks $3,870.
📌 Conclusion:
This is a bullish short-term trade setup in Gold, targeting a move toward the previous resistance levels after a recovery from the $3,850 support zone. Confirmation of bullish momentum above $3,870 could open the door for further upside.

NZDUSD: Sell Stop in Planned DowntrendThis is not an active entry but a planned sell stop entry.
Daily Timeframe:
Price crossed above HTL but quickly formed a doji to indicate weakness
EMA20 is below EMA60 and price is below EMA20 so there's an overall weak downtrend
H1 Timeframe:
Strong ATL is in the process of weakening as price recently failed to make a higher high
When price crossed below ATL, EMA20 should show confluence by crossing below EMA60 and the EMA band should continue expanding
If price makes a clean break lower, there's strong indication that there will be confluence with the daily downtrend

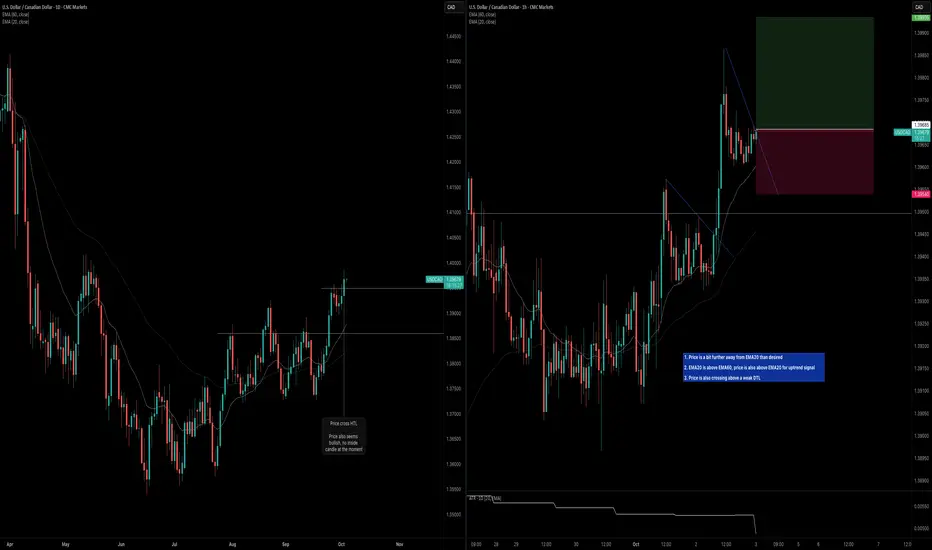
USDCAD: Uptrend ContinuationDaily Timeframe:
Price crosses above HTL and is holding
No inside bar formed yet so unlikely to see loss of momentum over the next day
H1 Timeframe:
Not idea that price is a bit further away from EMA20
Uptrend is indicated by EMA20 being above EMA60 and price being above EMA20
The DTL is also not a strong plot so reducing size