Gold (XAU/USD) Technical Analysis : Structural Analysis + TargetGold is currently trading near $3,292 on the 30-minute timeframe, showing classic signs of accumulation and compression within a well-respected descending channel. The current price action is approaching a critical decision zone, and the market is offering potential clues for both short-term and swing traders.
🔎 Detailed Breakdown of Chart Elements:
🔷 1. Descending Channel & Dynamic Support
Gold has been moving inside a falling channel, with price repeatedly reacting to both the upper and lower boundaries.
The lower boundary of the channel, currently acting as support, has been tested multiple times, suggesting a strong buying interest at this level.
This channel also aligns with the broader downtrend structure, giving sellers confidence while also creating interest for counter-trend buyers looking for reversal setups.
📐 2. Trendline Pressure and Compression
A downward sloping trendline, drawn from the recent swing highs, continues to apply bearish pressure.
Price is squeezing between the channel support and this descending trendline — a tight range compression, which often precedes a volatile breakout.
The analysis notes: “We have to wait for a trendline breakout” – this is a crucial technical signal that will determine the next move.
🚧 3. Break of Structure (BOS) Zones
Two potential bullish BOS (Break of Structure) levels have been identified:
Minor BOS (~$3,300):
A break above this level may signal short-term bullish intent and invalidate minor lower highs.
Early confirmation for buyers to enter with tight risk management.
Major BOS (~$3,310):
This is the key swing high which, if broken, would invalidate the current bearish structure and flip market sentiment bullish.
A strong bullish candle closing above this level could signal the start of a larger upward leg.
📍 4. Next Reversal Zone (Supply Area: $3,320 – $3,330)
This zone represents a strong supply area where previous price action saw heavy selling.
If bulls manage to clear the BOS zones, this area becomes the next target/resistance.
Price reaching this level could lead to a pullback, making it an ideal area for partial take-profits or reassessment of continuation trades.
📈 5. Scenario Planning & Strategy
✅ Bullish Bias (If Breakout Occurs):
Wait for a confirmed breakout above the trendline and Minor BOS with volume.
Ideal long entry would be on the retest of the trendline (now acting as support).
First target: Major BOS, then extend to the Reversal Zone.
Stop-loss can be placed below the channel support or latest swing low.
🚫 Bearish Continuation (If No Breakout):
If price fails to break above the trendline and continues to reject at resistance, sellers may look to short the retest of the trendline.
Targets can be set at the channel's lower boundary or previous lows.
Confirmation: Bearish engulfing patterns, rejection wicks, or divergence.
🧠 Technical Summary & Outlook
Gold is currently in a neutral to slightly bullish consolidation, showing early signs of demand at the bottom of the channel. The market is in "wait-and-watch" mode — traders should focus on the trendline breakout, which will serve as the trigger for directional bias.
The structure is clean, zones are well defined, and potential is high for both scalping and intraday setups. Traders are advised to stay patient and follow price action confirmation before entering trades.
📌 Key Levels to Watch:
Support Zone: $3,280 – $3,285 (Channel Base)
Trendline Resistance: ~$3,294–$3,296
Minor BOS: ~$3,300
Major BOS: ~$3,310
Reversal Zone (Supply): $3,320 – $3,330
Daytrading

(Daytrading) APPL going upH1 chart is respecting the uptrend.
Price has retested the 50 SMA on the H1 timeframe.
Price also touched the Ichimoku Cloud on H1.
→ Based on the risk-to-reward ratio, I’m expecting a Call position.

TSLA (daytrading) break out and retest1. Still watching here (down trend is too strong)
We can see break out patterm
2. And came back to restest. But i worry about that tsla usually doesnt restest like that.
3. Hit sma 200 h1

(Daytring) APPL quickly trade1. Premarket created a support line
2. Sma 200,50 is here
3. Price goes up in the moring just pull back to retest.
=> entry. Take profit whenever i feel good

Gold buying levels Hello everyone today Monday 7 july gold
Support 3330 level the price support this level if you plan for gold buy wait confirmation candle like bullish engulfing etc tp - 3343 sl - 3325 try at least 1:2 trade 1% risk overall captial

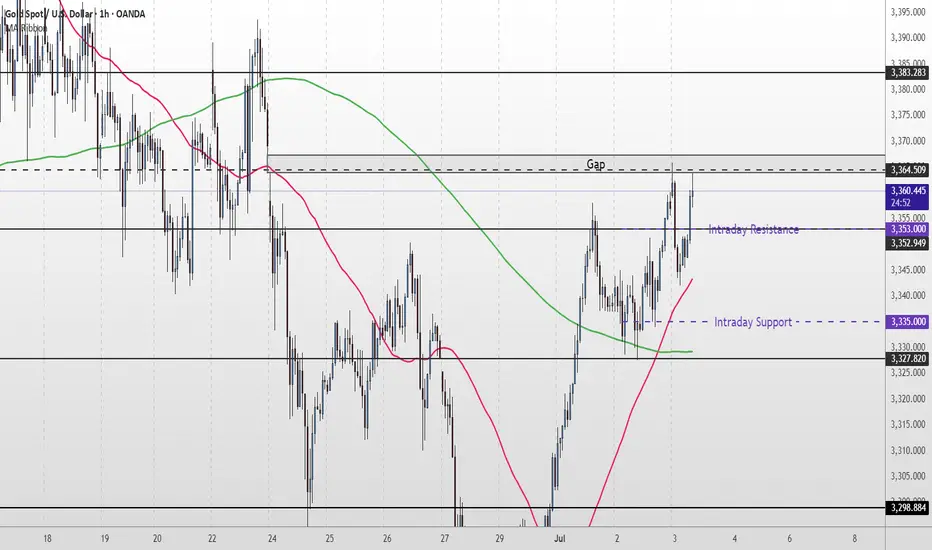
Gold Short Term OutlookYesterday, we highlighted that gold had reclaimed the 200MA and that the $3,327 support level needed to hold for further upside. Since then, price has steadily climbed and is now testing the $3,364 resistance — a level that also aligns with an unfilled gap.
Price action remains bullish for now, with price holding firmly above both the 50MA and 200MA.
If buyers manage to clear and hold above $3,364, we could see further upside toward $3,383 and $3,400, with possible extension into $3,418.
However, if price fails to break above $3,364, we may see a pullback into the $3,335–$3,327 zone. A break below there could open the door for a deeper drop into $3,298 or even $3,270.
📌 Key Levels to Watch:
Resistance:
$3,364 • $3,383 • $3,400 • $3,418
Support:
$3,352 •$3,335 - $3,327 • $3,298 • $3,270
🧠 Fundamental Focus:
📌 ADP Non-Farm Employment Change
📌 Initial Jobless Claims
📌 ISM Services PMI
📌 ISM Non-Manufacturing PMI
⚠️ With multiple red folder events on the calendar, expect elevated intraday volatility. Manage risk accordingly.
GBP/CAD (Two Trade Recaps) EUR/NZD Long and GBP/JPY LongEUR/NZD Long
Minimum entry requirements:
- If tight non-structured 15 min continuation forms, 5 min risk entry within it if the continuation is structured on the 5 min chart or reduced risk entry on the break of it.
- If tight structured 15 min continuation forms, reduced risk entry on the break of it or 15 min risk entry within it.
- If tight non-structured 1H continuation forms, 15 min risk entry within it if the continuation is structured on the 15 min chart or reduced risk entry on the break of it.
- If tight structured 1H continuation forms, 1H risk entry within it or reduced risk entry on the break of it.
GBP/JPY Long
Minimum entry requirements:
- Tap into area of value.
- 1H impulse up above area of value.
- If tight non-structured 15 min continuation follows, 5 min risk entry within it if the continuation is structured on the 5 min chart or reduced risk entry on the break of it.
- If tight structured 15 min continuation follows, reduced risk entry on the break of it or 15 min risk entry within it.

Gold Short Term OutlookGold dipped into the Support Zone but failed to sustain the breakdown below it. After briefly breaking below the zone, price has rebounded and is now attempting a short-term recovery.
However, structure remains bearish, with price trading below both the 50MA and 200MA, signalling continued downside pressure unless momentum shifts.
For bullish momentum to continue, we need to see a clean break and hold above $3,330, which may open the path toward $3,346, then $3,361.
If the move up doesn’t hold, the next reaction is expected near key support.
🔑 Key Levels:
Resistance:
$3,330 • $3,346 • $3,361 • $3,375
Support:
$3,306 • $3,287 • $3,271 • $3,242
📌 Stay patient and wait for confirmation before committing to a direction.

06/24/25 Trade Journal, and ES_F Stock Market analysis EOD accountability report: -717.50
Sleep: 4.5 hours - heat waves in nyc
Overall health: meh
** VX Algo System Signals from (9:30am to 2pm)** 4/4
9:40 AM Market Structure flipped bullish on VX Algo X3! 5 pts
9:42 AM VXAlgo NQ X3 Buy Signal (failed)
11:00 AM Market Structure flipped bullish on VX Algo X3! 20pt
11:58 AM VXAlgo NQ X1 Sell Signal (failed)
What’s one key lesson or takeaway from today?
and What major news or event impacted the market today?
There are days that the algo will lose but you just gotta trust the process and execute accordingly with a stoploss.
What are the critical support levels to watch?
--> Above 6130 = Bullish, Under 6125= Bearish
Video Recaps -->https://www.tradingview.com/u/WallSt007/#published-charts

EUR/AUD Short, EUR/NZD Short, NZD/USD Long and AUD/NZD ShortEUR/AUD Short
Minimum entry requirements:
- If tight non-structured 1H continuation forms, 15 min risk entry within it if the continuation is structured on the 15 min chart or reduced risk entry on the break of it.
- If tight structured 1H continuation forms, 1H risk entry within it or reduced risk entry on the break of it.
EUR/NZD Short
Minimum entry requirements:
- If tight non-structured 1H continuation forms, 15 min risk entry within it if the continuation is structured on the 15 min chart or reduced risk entry on the break of it.
- If tight structured 1H continuation forms, 1H risk entry within it or reduced risk entry on the break of it.
NZD/USD Long
Minimum entry requirements:
- If tight non-structured 1H continuation forms, 15 min risk entry within it if the continuation is structured on the 15 min chart.
- If tight structured 1H continuation forms, 1H risk entry within it.
AUD/NZD Short
Minimum entry requirements:
- If tight non-structured 1H continuation forms, 15 min risk entry within it if the continuation is structured on the 15 min chart.
- If tight structured 1H continuation forms, 1H risk entry within it.

EUR/AUD ShortEUR/AUD Short
Minimum entry requirements:
- 1H impulse down below area of interest.
- If tight non-structured 5 min continuation follows, reduced risk entry on the break of it.
- If tight structured 5 min continuation follows, reduced risk entry on the break of it or 5 min risk entry within it.
- If tight non-structured 15 min continuation follows, 5 min risk entry within it if the continuation is structured on the 5 min chart or reduced risk entry on the break of it.
- If tight structured 15 min continuation follows, reduced risk entry on the break of it or 15 min risk entry within it.

Gold Short Term OutlookGold is currently trading around $3,368, caught between dynamic moving average resistance and an intraday resistance zone.
Price must break and hold above the $3,378 resistance to open the path toward $3,395. A confirmed break above the key $3,395 level could signal the start of the next bullish leg.
However, repeated failure to break above $3,395 — or even $3,378 — may drag gold lower into key support zones.
📌 Key Levels to Watch:
Resistance:
$3,375 • $3,395 • $3,418 • $3,439
Support:
$3,361 • $3,346 • $3,330 / $3,306
$3,287 – Critical demand zone
🧠 Fundamental Insight:
Gold remains supported amid rising geopolitical tensions. Over the weekend, U.S. airstrikes targeted Iranian nuclear sites, escalating concerns over a broader conflict in the Middle East. This has reignited safe-haven demand, with gold catching a bid despite recent technical pullbacks.
Meanwhile, traders are weighing softer U.S. inflation signals against the Fed’s cautious stance. If tensions persist and economic data weakens, gold could benefit from both risk-off flows and increased speculation around potential rate cuts.

Gold Medium Term OutlookGold is currently trending within a rising channel after rejecting the $3,439 resistance zone, which marked a new Higher High (HH). Price is respecting the ascending channel support and is now testing the 50MA. The uptrend remains intact, with a sequence of Higher Lows (HL) and Higher Highs (HH) forming within the channel.
A break and hold above $3,378 could open the path for a re-test of $3,439 and potentially $3,501. However, failure to hold the rising channel support may shift momentum bearish, with $3,303 and $3,226 as the next major downside targets.
📌 Key Levels to Watch This Week:
Resistance: $3,378 • $3,439 • $3,501
Support: $3,303 • $3,226 • $3,171
🧠 Fundamental Insight:
Gold remains supported amid rising geopolitical tensions. Over the weekend, U.S. airstrikes targeted Iranian nuclear sites, escalating concerns over a broader conflict in the Middle East. This has reignited safe-haven demand, with gold catching a bid despite recent technical pullbacks.
Meanwhile, traders are weighing softer U.S. inflation signals against the Fed’s cautious stance. If tensions persist and economic data weakens, gold could benefit from both risk-off flows and increased speculation around potential rate cuts.

Weekly Market Outlook: FOMC, Trade Deals and GeopoliticsIt is a holiday-shortened week, with the majority of markets halting early on Thursday, June 19, 2025, in observance of Juneteenth. See here for holiday trading schedule
Key Themes to Monitor This Week
Geopolitical Risks
Any outside intervention in the ongoing Israel-Iran conflict will likely be seen as a risk-off event by market participants. Despite Friday’s sell-off, markets shrugged off during the Sunday open and overnight sessions.
There are potential risks to trade routes and energy infrastructure, although disruptions seem unlikely at the moment. Amena Bakr at Kpler noted that, so far, there are no signs of disruptions in oil loadings from Iran. Without a supply outage, there is no pressing need for additional barrels to be brought onto the market.
Trade War and Trade Deals
There have been recent developments with the U.S. reaching key trade deal milestones with several countries. The baseline scenario remains optimistic, with expectations for an extension in negotiations and potential reciprocal tariffs for countries failing to reach agreements.
FED Week
This is a key week for U.S. monetary policy, with the FOMC decision, Summary of Economic Projections (SEP), and Chair Powell’s press conference scheduled.
Traders will be closely watching how the Fed’s inflation and growth expectations have evolved, as reflected in the SEP. All eyes will be on the dot plot to note how interest rate expectations have evolved since last quarter. Of note: Will President Trump’s continued calls for rate cuts influence Chair Powell’s tone or guidance?
Expectations for the Week Ahead
NQ futures have continued one-time framing higher, consistently creating higher lows since the week of April 21, 2025. A strong support zone exists below, anchored at the yearly Volume Point of Control (VPOC) and the Anchored VWAP from May 11, 2025, when markets gapped higher.
Key Levels to Watch
• yVAH: 22,690.50
• R2: 22,510
• R1 / Previous Week High: 22,322.50
• May 11 AVWAP: 21,672.25
• yVPOC: 21,660
Scenario 1: Market Grinds Higher but Stays Cautious
Despite several looming risk factors, the market could continue to grind higher. In this scenario, we anticipate a test above the prior week's high, followed by a potential pullback into last week’s range.
Example Trade Idea 1
• Entry: 22,000
• Stop: 21,930
• Target: 22,322
• Risk: 70 pts
• Reward: 322 pts
• Risk-Reward Ratio: 4.6R
Scenario 2: Pullback to Support, Range-Bound Consolidation
If the market pulls back, we expect the yearly VPOC and AVWAP from May 11 to act as key support levels. In this case, price action may remain range-bound within the previous week’s range, forming an inside week.
Example Trade Idea 2
• Entry: 21,672
• Stop: 21,600
• Target: 22,000
• Risk: 72 pts
• Reward: 328 pts
• Risk-Reward Ratio: 4.6R
________________________________________
Glossary
• VPOC: Volume Point of Control
• VA: Value Area
• VAL: Value Area Low
• VAH: Value Area High
• VP: Volume Profile
• AVP: Anchored Volume Profile
• Y: Yearly
• pWk: Previous Week

EUR/USD Short and GBP/USD ShortEUR/USD Short
Minimum entry requirements:
- If tight non-structured 15 min continuation forms, 5 min risk entry within it if the continuation is structured on the 5 min chart or reduced risk entry on the break of it.
- If tight structured 15 min continuation forms, reduced risk entry on the break of it or 15 min risk entry within it.
- If tight non-structured 1H continuation forms, 15 min risk entry within it if the continuation is structured on the 15 min chart or reduced risk entry on the break of it.
- If tight structured 1H continuation forms, 1H risk entry within it or reduced risk entry on the break of it.
GBP/USD Short
Minimum entry requirements:
- If tight non-structured 1H continuation forms, 15 min risk entry within it if the continuation is structured on the 15 min chart.
- If tight structured 1H continuation forms, 1H risk entry within it.

NQ (Nasdaq) Futures Trading Levels [6/11/25]For Day Traders, here's some trading levels for NQ Futures Trading for today. It's CPI day, so we should get some nice swings today. Trade carefully and trade smart!

USD/CHF ShortUSD/CHF Short
Minimum entry requirements:
- Corrective tap into area of value.
- 4H risk entry or 1H risk entry after 2 x 1H rejection candles.
Minimum entry requirements:
- Tap into area of value.
- 1H impulse down below area of value.
- If tight non-structured 5 min continuation follows, reduced risk entry on the break of it.
- If tight structured 5 min continuation follows, reduced risk entry on the break of it or 5 min risk entry within it.
- If tight non-structured 15 min continuation follows, 5 min risk entry within it if the continuation is structured on the 5 min chart or reduced risk entry on the break of it.
- If tight structured 15 min continuation follows, reduced risk entry on the break of it or 15 min risk entry within it.

AUD/JPY Short, EUR/JPY Short, GBP/JPY Short and USD/CHF ShortAUD/JPY Short
Minimum entry requirements:
- 1H impulse down below area of value.
- If tight non-structured 5 min continuation follows, reduced risk entry on the break of it.
- If tight structured 5 min continuation follows, reduced risk entry on the break of it or 5 min risk entry within it.
- If tight non-structured 15 min continuation follows, 5 min risk entry within it if the continuation is structured on the 5 min chart or reduced risk entry on the break of it.
- If tight structured 15 min continuation follows, reduced risk entry on the break of it or 15 min risk entry within it.
EUR/JPY Short
Minimum entry requirements:
- If structured 1H continuation forms, 1H risk entry within it.
GBP/JPY Short
Minimum entry requirements:
- If tight non-structured 1H continuation forms, 15 min risk entry within it if the continuation is structured on the 15 min chart.
- If tight structured 1H continuation forms, 1H risk entry within it.
USD/CHF Short
Minimum entry requirements:
- Corrective tap into area of value.
- 4H risk entry or 1H risk entry after 2 x 1H rejection candles.
Minimum entry requirements:
- Tap into area of value.
- 1H impulse down below area of value.
- If tight non-structured 5 min continuation follows, reduced risk entry on the break of it.
- If tight structured 5 min continuation follows, reduced risk entry on the break of it or 5 min risk entry within it.
- If tight non-structured 15 min continuation follows, 5 min risk entry within it if the continuation is structured on the 5 min chart or reduced risk entry on the break of it.
- If tight structured 15 min continuation follows, reduced risk entry on the break of it or 15 min risk entry within it.

USD/JPY Short, AUD/NZD Short, AUD/JPY Neutral and EUR/USD ShortUSD/JPY Short
Minimum entry requirements:
- If tight non-structured 5 min continuation forms, reduced risk entry on the break of it.
- If tight structured 5 min continuation forms, reduced risk entry on the break of it or 5 min risk entry within it.
- If tight non-structured 15 min continuation forms, 5 min risk entry within it if the continuation is structured on the 5 min chart or reduced risk entry on the break of it.
- If tight structured 15 min continuation forms, reduced risk entry on the break of it or 15 min risk entry within it.
AUD/NZD Short
Minimum entry requirements:
- If tight non-structured 15 min continuation forms, 5 min risk entry within it if the continuation is structured on the 5 min chart or reduced risk entry on the break of it.
- If tight structured 15 min continuation forms, reduced risk entry on the break of it or 15 min risk entry within it.
AUD/JPY Neutral
Minimum entry requirements:
- If structured 1H continuation forms, 1H risk entry within it.
Minimum entry requirements:
- 1H impulse down below area of value.
- If tight non-structured 5 min continuation follows, reduced risk entry on the break of it.
- If tight structured 5 min continuation follows, reduced risk entry on the break of it or 5 min risk entry within it.
- If tight non-structured 15 min continuation follows, 5 min risk entry within it if the continuation is structured on the 5 min chart or reduced risk entry on the break of it.
- If tight structured 15 min continuation follows, reduced risk entry on the break of it or 15 min risk entry within it.
EUR/USD Short
Minimum entry requirements:
- Tap into area of value.
- 1H impulse down below area of value.
- If tight non-structured 15 min continuation follows, 5 min risk entry within it if the continuation is structured on the 5 min chart or reduced risk entry on the break of it.
- If tight structured 15 min continuation follows, reduced risk entry on the break of it or 15 min risk entry within it.

NVDA Support and Resistance Lines Valid from June 1 to 30Overview:
These purple lines act as Support and resistance lines when the price moves into these lines from the bottom or the top direction. Based on the direction of the price movement one can take long or short entries.
Trading Timeframes
I usually use 30min candlesticks to swing trade options by holding 2-3 days max. Anyone can also use 3hr or 4hrs to do 2 weeks max swing trades for massive up or down movements.
I post these 1st week of every month and are valid till the end of the month.

Why Higher Timeframe Analysis Increases Your WIN-RATE!Many traders focus too heavily on lower timeframes, chasing setups without any real context. But what if the secret to improving your consistency was as simple as zooming out?
In this video, we break down why analyzing higher timeframes—and trading in their direction—can significantly increase your win rate across Forex, crypto, stocks, and futures. This isn’t just a theory. It’s a principle used by institutional traders, prop firms, and consistently profitable independent traders.
✅ Here’s what you’ll learn in this deep-dive:
The real purpose of higher timeframe analysis and how it acts like a GPS for your trading decisions.
How to identify structure, liquidity, and key levels on the daily, 4H, and weekly charts
Why trading against the higher timeframe flow often leads to premature stop-outs or fakeouts
The power of multi-timeframe alignment: how to sync HTF bias with LTF entries
How trading with higher timeframe momentum helps filter noise, reduce overtrading, and increase conviction
A walkthrough example showing how to use HTF context to validate a lower timeframe setup
Whether you're trading ICT concepts, Fibs, RSI, VWAP, or your own system—this principle applies. Trading in alignment with the higher timeframe doesn’t just increase your odds, it adds structure, patience, and confidence to your process.
📌 Key takeaway: When you understand what the market is doing on the higher timeframe, you stop guessing and start positioning yourself with the move—not against it.
🛠️ Helpful for traders using:
Smart money concepts (SMC)
ICT-based models (like AMD, OTE, and NDOG)
Supply and demand strategies
Price action or indicator-based systems
PRACTICALLY ANY TYPE OF STRATEGY OR METHODOLOGY
So, I hope the video was insightful for you. Let me know if you apply higher timeframe analysis, and how it has helped you.
- R2F Trading

ES Trade Idea and Upcoming NFP ReportCME_MINI:ES1!
• What has the market done?
ES futures are lagging compared to tech heavy index NQ futures. ES futures are still below yearly open. Yearly open has been a strong area of resistance since the rally of April 6th Lows in futures complex.
• What is it trying to do?
ES futures are in consolidation mode, building value higher. VPOC has shifted higher since the gap up from May 11th open. VPOC and 0.786 fib level provide a base for a continuation higher.
• How good of a job is it doing?
Markets seem to be slowing its rally. After such a strong rebound, participants are wary of any pull-backs. Although a strong trend higher, consolidation or a pullback is not illogical at these levels.
• What is more likely to happen from here?
o Scenario 1: Hold steady and NFP provides needed boost for markets to get across yearly open resistance and climb higher.
o Scenario 2: A mixed NFP report may point towards further consolidation. Key level 5873 as support on move lower before reverting higher.
o Scenario 3: A hawkish NFP report that signals higher for longer rates, may be interpreted by market participants as less monetary stimulus and dwindling rate cut bets for this year. We anticipate a sell-off towards 0.618 fib level in this scenario, moving to the lower edge of micro composite volume profile.
In all the above scenarios, there is a clear LIS at yearly open. Other key levels are defined cleanly on the higher time frame. Important thing for traders to note here is to trade what you see and not what you think. Having an alignment between fundamentals and technicals is sound but the markets do what they do, and price moves where it should. Painting narrative to any move may sound fancy but it gets less important at intraday time frames in our opinion. Hence why we view all this considering auction markets and volume profile.
Glossary:
ES - emini-S&P 500 Futures
NQ - emini-NASDAQ 100 Futures
VPOC - Volume Point of Control: The most traded price by volume in a given range. Represents acceptance or consensus
NFP - Non-Farm Payroll: Released by the US Department of Labor around the 1st Friday of every month. It reports on Unemployment, Productivity and other key metrics. Key economic release
LIS - Line In the Sand: A key zone that might tip buyers or sellers to act to cover risk and might change the overall bias of our analysis

US30 JUNE 2What did the Buffalo say to his son when he left home? Bison...
Anyway, let's get to work. Price is looking very messy. So instead of trading it I'm going to draw a box around the consolidation and wait for price to break and retest the ends of the boxes.
Like always I'll wait for the 1m for price to break and retest before I enter the trade.
NEVER Trade Consolidation, it gets messy quickly.
Anywho... Have fun trading and be patient.
