MANA Ready for a Big Breakout! (4H)📈 MANA Price Analysis | Bullish Structure & Smart Money Perspective
The overall power and primary market direction of MANA (Decentraland) remain clearly bullish, indicating strong underlying demand and positive market sentiment. Recently, the price has experienced a sharp and aggressive corrective move, which is considered a healthy pullback within a larger bullish trend rather than a trend reversal.
It is important to note that buyers are actively waiting at two key demand zones marked on the chart. These levels represent high-probability entry areas, where institutional and smart money participants are likely to step in. Their buying pressure can act as a catalyst to push the price of MANA higher and resume the bullish momentum.
From a market structure and Smart Money Concept (SMC) perspective, we can observe multiple consecutive CH (Change of Character) and BOS (Break of Structure) formations. These signals confirm that the market structure remains bullish and that the recent correction is part of liquidity engineering, allowing the market to collect orders before the next impulsive move.
Additionally, the formation of liquidity pools below and above key levels suggests that the market is preparing for a strong upward displacement. As liquidity gets absorbed, the probability of a bullish jump (impulsive move) to the upside significantly increases.
To manage risk efficiently, two specific entry points have been identified where traders can enter the position using a DCA (Dollar Cost Averaging) strategy. This approach allows for better position management and reduces exposure to short-term volatility while aligning with the dominant bullish trend of MANA.
🎯 Profit targets are clearly marked on the chart, based on key resistance levels, liquidity zones, and previous highs. As long as the price respects the identified bullish structure, these targets remain valid.
🔍 Summary:
Asset: MANA (Decentraland)
Market Bias: Bullish
Structure: CH & BOS confirmation
Strategy: DCA entries at key demand zones
Expectation: Bullish continuation & upward impulse
Targets: Marked on the chart
If you would like us to analyze a coin or altcoin for you, first like this post, then comment the name of your altcoin below.
Decentraland

Decentraland (mana) Decentraland token
Mana usdt daily analysis
Time frame 4hours
Risk rewards ratio >3 👈👌
Target
Mana has unacceptable behaviour in crypto market and couldn't break it's resistance line for months.
I don't like this token but I guess here is a good place to open a position and take a good benefit
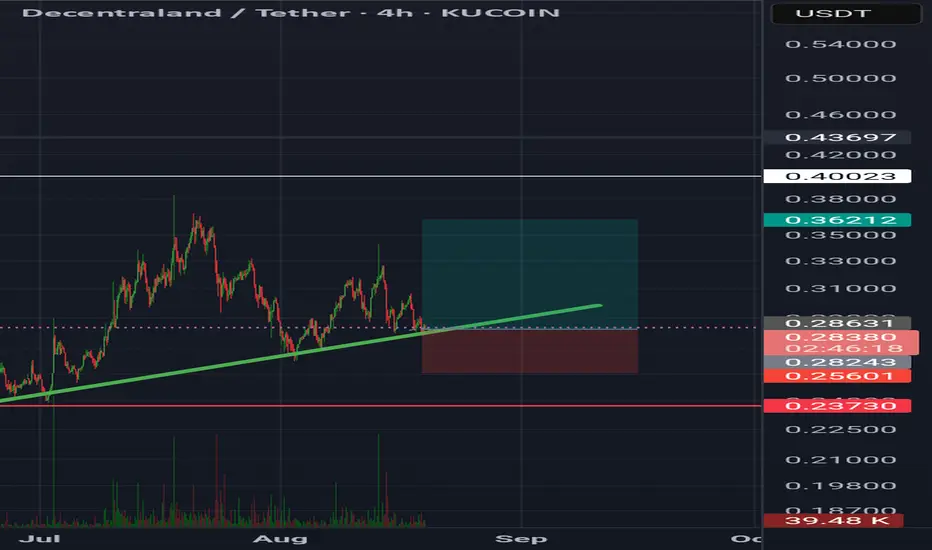
MANA/USDT –> Symmetrical Triangle BreakoutHello guys!
MANA has been consolidating inside a large symmetrical triangle for months, and now it looks like the price is finally breaking out to the upside. This could be the beginning of a strong bullish leg.
Key Points:
The breakout happened with solid momentum, confirming bulls are stepping back in.
The first resistance level is expected to be around $0.50–$0.52, which represents a roughly 50% increase from current levels.
If the price clears that zone, the measured move of the pattern points toward $0.60–$0.62, approximately 70% higher than the breakout.
Bullish Scenario:
As long as the price stays above the breakout level (~$0.26–$0.24), the bias remains bullish. Buyers could look for continuation toward the targets mentioned.
💥 Invalidation:
A drop back inside the triangle below $0.24 would invalidate the breakout and put the bullish setup at risk.
Conclusion:
MANA has finally broken out of its long consolidation. If momentum holds, there’s room for a 50–70% rally in the coming weeks.
MANA Eyes 0.75 After Strong Bounce$MANA/USDT is bouncing from a strong confluence zone, where the support area lines up with the rising trendline. This reaction shows buyers are stepping in to defend the structure.
If momentum continues, price has room to push higher toward the 0.75 level and possibly beyond, as long as it holds above support.
In simple terms: the confluence bounce is a bullish signal, and upside targets remain in play if momentum stays intact.
DYOR, NFA
#PEACE
Stay tuned for more update - follow us on Trading View

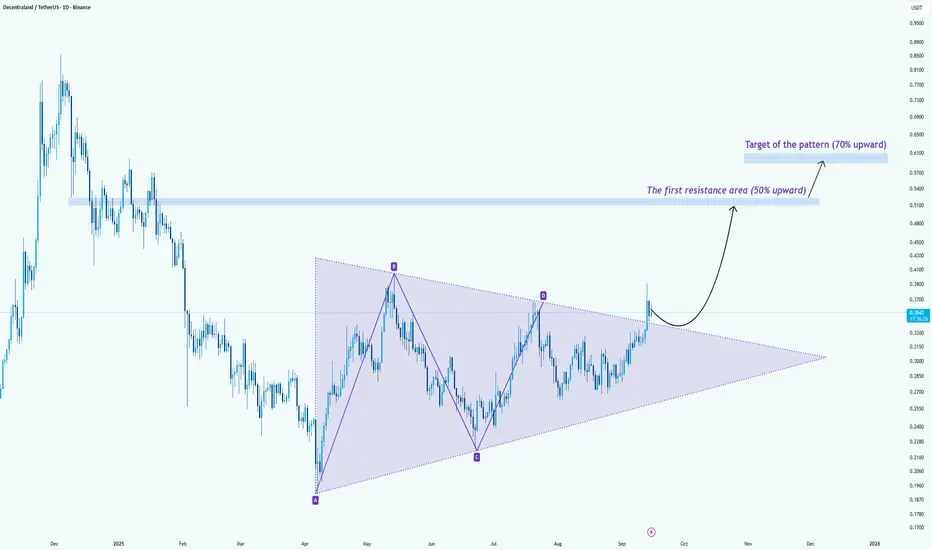
MANA About to Explode? 3-Year Channel Breakout Ahead!MANA has been consolidating inside a large descending channel for over 1100 days, consistently respecting both support and resistance levels. Recently, price formed a triangle pattern near channel support, a setup similar to Nov 2024, when MANA rallied over 150% after a breakout. This suggests a potential strong bullish move if resistance breaks.
Key Points
- Price has traded inside the channel for ~3 years
- Strong resistance around $0.80
- Triangle pattern formed near the channel bottom support
- A previous similar setup led to a sharp rally
- Breakout could open doors for a mid-term bullish trend
Trade Setup
Entry: $0.35
Stop-loss: Below $0.26
Targets:
First target: $0.75
Second target: $1.60
Cheers
Hexa
MANA 1D Analysis | Key Triggers Ahead💀 Hey , how's it going ? Come over here — Satoshi got something for you !
⏰ We’re analyzing MKR on the 1-Day timeframe timeframe .
👀 On the daily timeframe of MANA, we can see that the coin is inside a compression with a triangle pattern. With the daily candle open, it is moving upward, and the reason for this is the clearing of sellers’ orders. MANA currently has a very important resistance at the $0.2995 area, which is considered a major resistance in the multi-timeframe view.
⚙️ Looking at MANA’s volatility, on the daily timeframe it is positioned above the 50 level and has a key resistance at the 54.25 area. If the oscillator crosses this level, MANA can build a higher low compared to its previous lows.
🕯 The number and size of red candles inside this triangle are much greater than the green ones, and to break out of this pattern and compression, we need more green candles in the multi-timeframe, especially on the 4-hour chart. If you zoom in on the chart, the 4-hour candles and patterns will display more clearly.
💰 On the daily timeframe of MANABTC, we can see that in the past 3 days, its trading volume and volatility have increased. A Fibonacci has been drawn from the breakout area to the corrective bottom, and with a breakout of the 0.38 Fib level, it can once again move upward.
🔔 The alert zones we have considered are the $0.274 area and the $0.3015 area. Based on price action in these zones, we can make the best trading decisions. Note that MANA has an important chart compared to Bitcoin, so be sure to check that chart as well.
❤️ Disclaimer : This analysis is purely based on my personal opinion and I only trade if the stated triggers are activated .

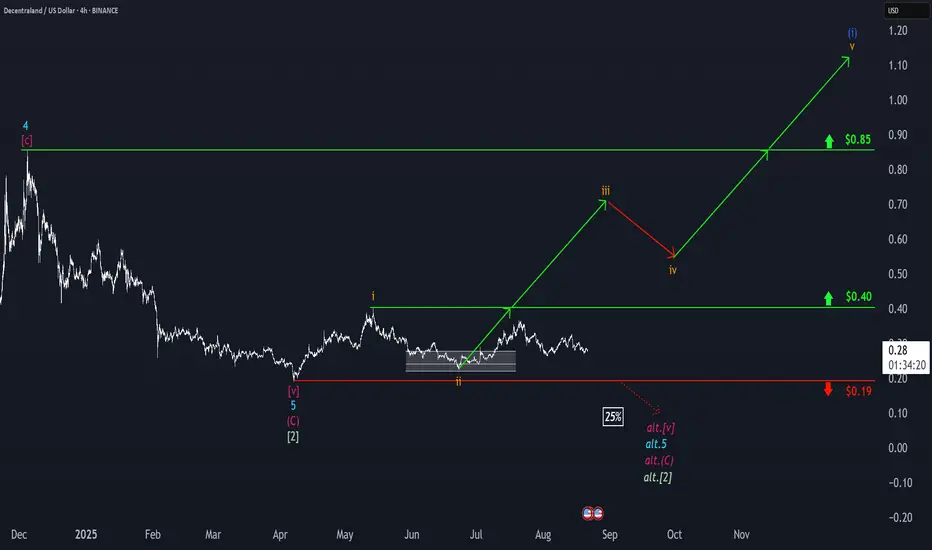
Decentraland: Rally Stalls Below Key ResistanceDecentraland’s MANA is trading between the $0.19 and the $0.40 mark, with downward pressure stalling progress on the upside. As a result, no headway could be made as part of our primary scenario, which calls for prices to break above the $0.85 resistance during an orange five-wave move. Above that level, we anticipate the peak of the larger blue wave (i). Meanwhile, there remains a 25% chance of a new corrective low below the $0.19 mark.
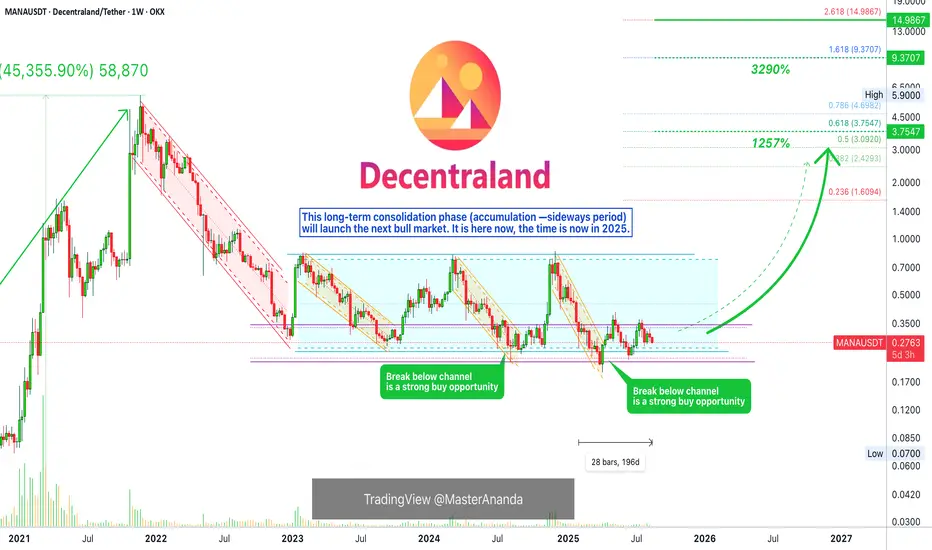
Decentraland · Hold Long-Term & Open 3,000% Profits PotentialYou will agree with me. Decentraland (MANA) is trading within a wide, long-term, sideways accumulation channel—this is the one light blue on the chart. And the action is happening right at the lower end of the channel, near support. This is great, let's get deep into the analysis.
The same support zone where MANAUSDT is trading now in 2025 was activated in 2024. The exact same range, say between 0.2222 and 0.3333—marked with purple lines.
This level was activated in December 2022 and it caused prices to jump. It was a small jump but please bear with me.
Then again between August and October 2023 MANAUSDT consolidated in this range and what followed was a bullish breakout.
Then again in 2024. August—notice the same month. Between July and November 2024 MANA entered the "opportunity buy zone" and responded with a bullish jump.
The zone has been activated again in 2025 since February. This support zone has been active for 196 days. This is the longest stretch ever. This means that the bull market that follows will have strong support, years of consolidation.
We know Decentraland is trading at bottom prices but in a range that tends to support bullish action. We know there is no bearish trend and volume is flat. The market will soon change.
MANAUSDT has strong bullish potential. This is a good hold long-term.
Namaste.
Third-Tier action - MANA weekly update August 9 - 15thDecentraland (MANA) is currently advancing within a strongly aligned Elliott Wave structure. At the Cycle degree, the market is in Wave 1; at the Primary degree, it is in Wave 3; at the Intermediate degree, also in Wave 3; and at the Minor degree, in Wave 1. At the Minute degree, price is in the late stages of Wave 3. This smaller Wave 3 is approaching a bearish Fair Value Gap (FVG), which could act as resistance and mark the short-term top of this wave. Interestingly, the projected target for Wave 5 also aligns with a higher-level bearish FVG, adding structural confluence to the broader setup.
While the overarching wave alignment remains bullish, there are a few elements to monitor closely. Funding rates are positive but leaning slightly toward the negative, suggesting a mild sentiment shift, while open interest continues to rise, indicating stronger market participation. However, the liquidity heatmap reveals a significant concentration of liquidity below the current price, which weighs against the immediate bullish continuation, as such liquidity often attracts short-term sweeps before the trend resumes.
Market psychology could also play a major role in the next move. With Ethereum currently rallying strongly, there is a plausible rotation scenario: once ETH reaches a key resistance level and slows down, capital may rotate into second- and third-tier altcoins like MANA, accelerating their upside moves. Such rotations often coincide with euphoric retail behaviour, which can amplify both gains and volatility.
From a macroeconomic perspective, this setup is further supported by expectations surrounding the upcoming September FOMC meeting. The CME FedWatch Tool currently shows a 88.9% probability of a Federal Reserve rate cut. Markets tend to front-run such events, and this expectation could fuel bullish momentum into Wave 3 moves across the crypto sector. However, with sentiment leaning heavily bullish, there is also the risk of a “sell-the-news” reaction, especially if leveraged longs pile in too aggressively ahead of the announcement.
Institutional positioning appears to have taken place earlier in the cycle, as evidenced by order block formations near the end of prior corrective waves, leaving retail traders to drive the next leg higher. This dynamic often defines the acceleration phase of a third wave.
As long as key support levels hold and the structure remains intact, MANA’s multi-timeframe alignment suggests that the next impulsive rally could be substantial — though traders should remain mindful of the liquidity resting below, which could trigger a temporary shakeout before continuation.
ManaDecentraland token
Mana usdt Daily analysis
Time frame daily
Risk rewards ratio =2 👈👌
Target = 0439 $
0.44$ - 0.46$ is strong resistance for mana
If price can break this resistance it will go to 0.6$

ADA/USDT | BIG Bullish Move Ahead! (READ THE CAPTION)By analyzing the Cardano chart on the 3-day timeframe, we can see that, as expected, the price continued its rally, reaching $0.89 before collecting liquidity above the $0.86 level and then facing a correction. Currently trading around $0.81, we expect the bullish trend to continue after this minor pullback. Key demand zones are at $0.78, $0.69, and $0.61. Based on the previous analysis, the next short- to mid-term bullish targets are $0.93, $1.05, and $1.33.
Please support me with your likes and comments to motivate me to share more analysis with you and share your opinion about the possible trend of this chart with me !
Best Regards , Arman Shaban

TON/USDT : TON at a Key Breakout Level – Will $3 Hold or Break?By analyzing the TON Coin chart on the 3-day timeframe, we can see that after climbing back to the $3 level, this zone has now turned into a key resistance area. The most important condition for further bullish movement is a strong breakout and confirmation above $3. If that scenario plays out, the next potential upside targets are $3.15, $3.63, $4.20, and $4.68.
⚠️ (A deeper and more detailed analysis is recommended for long-term investment considerations.)
Please support me with your likes and comments to motivate me to share more analysis with you and share your opinion about the possible trend of this chart with me !
Best Regards , Arman Shaban

Decentraland: Bottom Confirmed!Decentraland (MANA) has delivered a convincing upward reaction within our orange Target Zone ($0.28 – $0.22), confirming the low of orange wave ii. Under the primary scenario, the token is now advancing in wave iii of the same degree. This leg should propel MANA toward resistance at $0.85, with the full five-wave orange sequence expected to surpass that level before completing blue wave (i). That said, we still assign a 33% probability to the alternative scenario, which would imply one final corrective dip below support at $0.19.
📈 Over 190 precise analyses, clear entry points, and defined Target Zones - that's what we do.

Decantraland: Progress in wave [i]Following the renewed rise last week, we continue to locate the MANA coin at the beginning of the magenta wave . This movement should have the medium- to short-term potential to extend above the resistance levels at $0.59 and $0.85 before a countermovement should pick up again with wave . Nevertheless, there is a 33% chance for our alternative scenario: if weakness emerges in the near future, a new low of the green wave alt. might be reached. Ultimately, however, this would only imply a slight delay.

Decentraland: Your Altcoins Choice (S5)I looked at MANA (Decentraland) recently, two weeks back, and the chart is the same but with the bullish reversal now confirmed.
MANAUSDT produced a major low last month and now is full green. This is the fourth week with growing prices and a bullish bias. A clear recovery. This recovery will lead to a major bullish wave.
The recent low activated the lowest prices since February 2021 and this support level back in 2021 launched the fifth wave of the last bull market. In April 2025, this same level marks the start of the current bullish cycle. We are set to experience maximum growth so lets focus on the targets.
» A very easy target can be found at $1.93 with 505% profits potential. This is a strong target with a very high probability to be hit within the next 3-6 months. A strong target sits at $3.75 and gives 1,076% profits potential or more than 11X.
» Short-term, there is a target at $0.6017 for 88% and this is just too easy, it should be ignored. Aim higher.
If this bull market becomes a really strong one, which I believe will be the case, MANAUSDT can move to hit a new All-Time High. An ATH for 2025 can be $6 just as it can be $9.37. The latter gives 2,837% profits potential or almost 30X from current prices.
This is a good project and has done great in the past. Timing is good now if you focus on the long-term.
The low is in. The correction is over. The bottom is in, higher highs and higher lows next.
A bullish cycle.
Thanks a lot for your continued support.
Namaste.

MANAUSDT Huge Bounce Incoming?MANA is currently testing a long-term descending support trendline on the weekly chart. This level has acted as a reliable bounce zone multiple times in the past (highlighted with arrows).
-Price is holding above a major support level (~$0.21), showing signs of demand.
-Weekly RSI is forming a bullish divergence, with higher lows on RSI vs. lower lows on price — often a precursor to trend reversals.
-Previous touches on this trendline have led to significant rallies.

Conspicuous - MANA / USDTEvening fellow traders,
Every now and then I ride waves on MANA.
This time it won't be different, as I am already in it.
But I'm looking for an extra touch, that outta the box type thing and buying an extra chunk between the prices shown in the chart.
Please take advantage of this if you get the chance, and let's make a big chunk of money together!
Trade thirsty, my friends!

Decentraland: Fake Rally?Decentraland reacted significantly to the low of April 7 and temporarily achieved an increase of over 50%. Still, there is a 33% chance that the current corrective movement is not yet complete, and we will see a final setback to a fresh low of the green wave alt. in the short term. Primarily, however, we assume that a sustainable bullish trend reversal and the start of a magenta uptrend quintet have already succeeded. Via the magenta and the subsequent interim correction of wave , MANA should now gather momentum for the impulsive breakout of the magenta wave above the two resistance levels at $0.59 and $0.85.

TradeCityPro | MANAUSDT Fake Breakout Trigger Activated!👋 Welcome to TradeCityPro Channel!
Let’s dive into the analysis of one of the metaverse coins and quickly check the trigger and the action unfolding on its chart together!
🌐 Overview Bitcoin
Before starting the analysis, I want to remind you again that we moved the Bitcoin analysis section from the analysis section to a separate analysis at your request, so that we can discuss the status of Bitcoin in more detail every day and analyze its charts and dominances together.
This is the general analysis of Bitcoin dominance, which we promised you in the analysis to analyze separately and analyze it for you in longer time frames.
📊 Weekly Timeframe
On the weekly timeframe, MANA is one of those coins still oscillating within its range box. After a rejection from the key ceiling at 0.7679, we moved back toward the lower end and continued to fluctuate within our range box.
The candle from two weeks ago attempted to close below the critical support at 0.2484—and it did close below this box’s floor. However, this didn’t trigger a sharp drop; instead, we saw a fake breakout!
A fake breakout occurs when a support or resistance level is breached, but the next candle reverses back above the support or below the resistance. This is often called a fake breakout, and it typically signals a trend reversal or the start of a new trend.
That’s exactly what happened here. After the break, the next candle closed as a strong green candle, returning MANA to its box. This could mark the start of a new trend. You can take this trigger with a stop loss at 0.1722 and capitalize on the potential move!
📉 Daily Timeframe
In the daily timeframe, MANA has continued to show the aftermath of the fake breakout. After the failed attempt to break below 0.2484, the price quickly recovered, with buyers stepping in to push it back into the range box.
The strong green candle that followed the fake breakout confirms the buying pressure, and the price is now testing the upper boundaries of the box. If we see a break above 0.7679, it could signal a strong bullish move. However, caution is needed—failure to break this resistance could lead to another rejection.
For buying, the fake breakout trigger at 0.2484 is active, and you can enter with a stop loss at 0.1722. Confirmation would come from sustained volume and a push above the 50-day moving average. For selling, if we break below 0.1722, it’s a sign to exit, as the downtrend could resume.
✍️ Final Thoughts
Stay level-headed, trade with precision, and let’s capitalize on the market’s top opportunities!
This is our analysis, not financial advice always do your own research.
What do you think? Share your ideas below and pass this along to friends! ❤️

Decentraland: Success In 2025 & BeyondRemember the linear chart. When the action goes flat and the candles become very small, sometimes almost invisible, it means that the current sideways period is reaching its end.
After a bear market there is a long-term consolidation phase and then the next bull market. The long-term consolidation phase for Decentraland is reaching its end and we are about to enter the 2025 bull market. Expect maximum growth.
Here is the linear chart, it shows a perspective with which we can easily appreciate the fact that MANAUSDT is trading at bottom prices. Truly bottom, very low. The best time to buy; when prices are low.
Then we can consider the logarithmic chart. Decentraland grew 45,300%+ between 2020 and 2021.
With this little exercise we cleared up two things: (1) bottom prices and (2) huge potential for growth. Cryptocurrency is the best financial market in the world.
So this pair is good and recently pierced the sideways channel which is a strong buy opportunity, but this never last long. The action is back above but it is still early, because the action is happening near support.
The rest is up to you. This is a friendly reminder. Great timing. No complexities, an easy trade. Buy and hold. Wait patiently and then comeback to collect your check.
There is no need to try and catch the market within a bullish wave. When one pair starts moving, there is always one that is yet to grow. Instead of chasing the ones that already broke out, look for the ones that are still to make their first move, buy them and hold. This strategy leads to success. If you chase a pair, it means you have no plan and the moment you buy it drops and this will push you to sell at a loss and find another pair.
Since it takes many months for a full bullish wave to develop, there is no need to buy something just because it is going up today. Since it can take years for prices to grow, just look for the ones that look best, with the highest probability of high gains, low risk.
Plan ahead and if you don't know what to do, just follow me.
If you don't know what to choose, read these charts that I share everyday. There is no need to rush. Once you read daily what I have to say, you will get used to the market and your choice will make itself present.
There are many of us and not everybody should buy the same. What works for you might not work for me and vice versa. That's why time is needed, invest in yourself. When you take the time to read and study, you will know exactly which pair to buy and hold. Take your time, opportunities are endless when it comes to Crypto.
Thanks a lot for your continued support.
Take your time but do not become complacent. Read everything, be prepared.
It is a small price to pay. Dedicate some time to the market and the market will bless you, with profits.
Namaste.

The key is whether it can rise after receiving support at 0.2349
Hello, traders.
If you "Follow", you can always get new information quickly.
Please click "Boost" as well.
Have a nice day today.
-------------------------------------
(MANAUSDT 1D chart)
It receives support near 0.2349
1st: 0.2636
2nd: 0.3136
The key is whether it can rise to the 1st and 2nd above.
An important volume profile section is formed in the 0.1066-0.1547 section.
Therefore, from a mid- to long-term perspective, the 0.1066-0.1547 range can be considered the last buying range.
-
In order to continue the upward trend, the price must be maintained above the M-Signal indicator of the 1M chart.
Therefore, a way to increase the number of coins (tokens) corresponding to profits with peace of mind is needed.
-
MANA coins are used for Collectibles & NFTs, Gaming, Play To Earn, and Payments.
In addition, it belongs to the Ethereum Ecosystem, Solana Ecosystem, Polygon Ecosystem, Gnosis Chain Ecosystem, and Fusion Network Ecosystem.
Therefore, it seems that it can be used in various ways.
I don't think the future outlook is that bad, but since it is currently being used for Gaming, I don't think there is much merit in terms of price.
This is because it is not easy for the Gaming business to continue to develop.
I think the business needs to expand a bit more.
-
(30m chart)
- HA-High indicator rises above,
- Trend Cloud indicator is rising,
- Rising near the M-Signal indicator on the 1D chart,
- StochRSI indicator enters the overbought zone,
Under the above conditions, there is a possibility that support will be confirmed near the HA-High indicator again.
Accordingly, the key is whether it will be supported near 0.2349, which is the M-Signal indicator point on the 1D chart.
It cannot be ruled out that it will rise to around 0.2636, but it is judged that there is not enough trading volume for that to happen.
-
Thank you for reading to the end.
I hope you have a successful trade.
--------------------------------------------------
- This is an explanation of the big picture.
I used TradingView's INDEX chart to check the entire range of BTC.
I rewrote the previous chart to update it by touching the Fibonacci ratio range of 1.902 (101875.70) ~ 2 (106275.10).
(Previous BTCUSD 12M chart)
Looking at the big picture, it seems to have been following a pattern since 2015 and has been rising.
In other words, it is a pattern that maintains a 3-year uptrend and faces a 1-year downtrend.
Accordingly, the uptrend is expected to continue until 2025.
-
(Current BTCUSD 12M chart)
Based on the currently written Fibonacci ratio, it shows up to 3.618 (178910.15).
Fibonacci ratio 0.618 (44234.54) is not expected to fall again.
(BTCUSDT 12M chart)
I think it is around 42283.58 when looking at the BTCUSDT chart.
-
I will explain it again with the BTCUSD chart.
The Fibonacci ratio ranges marked in the light green boxes, 1.902 (101875.70) ~ 2 (106275.10) and 3 (151166.97) ~ 3.14 (157451.83), are expected to be important support and resistance ranges.
In other words, it seems likely to act as a volume profile range.
Therefore, in order to break through this section upward, I think the point to watch is whether it can rise with support near the Fibonacci ratios of 1.618 (89126.41) and 2.618 (134018.28).
Therefore, the maximum rising section in 2025 is expected to be the 3 (151166.97) ~ 3.14 (157451.83) section.
To do that, we need to look at whether it can rise with support near 2.618 (134018.28).
If it falls after the bull market in 2025, we don't know how far it will fall, but considering the previous decline, we expect it to fall by about -60% to -70%.
So, if the decline starts near the Fibonacci ratio 3.14 (157451.83), it seems likely that it will fall to around Fibonacci 0.618 (44234.54).
I will explain more details when the downtrend starts.
------------------------------------------------------

I'm Bullish, but... MANA / USDTHi friends,
My latest post about MANA was bullish, and I did buy some of the blood we just had.
But this would be another coin that could drop 25% - 30% giving a great opportunity.
Keep an eye on BTC cause if it dumps, this will happen.
Trade thirsty!

Decentraland: Summer FlashbackWith the recent sell-off, Decentraland's MANA reached its lowest level since early August of last year. The selling pressure should now intensify further to push the price down to the anticipated new bear market low of the green corrective wave . From there, the next magenta five-wave upward sequence is expected to begin and finally break through both resistance levels at $0.59 and $0.85 during wave . However, according to our 33% probable alternative scenario, the price could reverse upward now and directly start the impulse wave alt. . In this case, the precursor wave alt. of the same color would conclude at the current price level.
