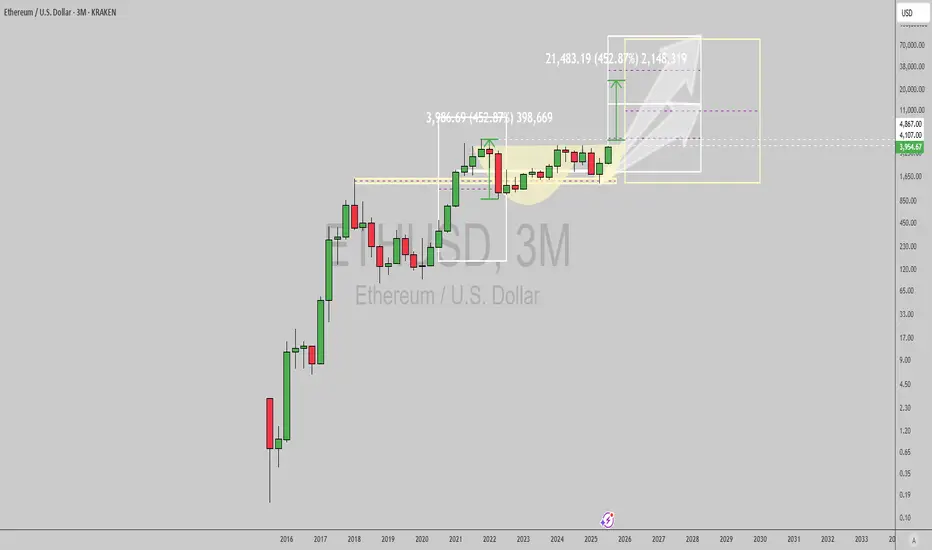
WORLD LIBERTY FINANCE HAS LAUNCHED!Will it kick off this Bull market into hyperdrive?
Here are the Fib extensions based on the Futures price action so far.
Can it break a dollar?
Has it cemented #ETHEREUM as the dominant layer 1 for serious money?
Whilst relegating #SOLANA to gen Z high speed casino?
We shall find out in the coming 6 months.
DEFI

(BTC) bitcoin "years - boxes - overlap"Essentially, the boxes in the chart gives and easy way to see Bitcoin between years correlated by using colored boxes. Using boxes I overlapped each year based on the following year's performance, working backwards. There are two boxes for each year in different colors and only touching the highest point of each year to see the difference overlapped between years and amount of gains or losses with the price of Bitcoin chart. I do not have a bias towards Bitstamp it is the chart with the longest view of BTC at the time of adding BTC to my watchlist some years ago.

(BTC) bitcoin "balancing act"Lines drawn based on indications in an attempt to foresee the direction of bitcoin. Day chart. Yellow Lines are aligned with variable average patterns. Orange lines are more concretely focused on consistent timeframe measurements. The trading psychology right now is not at its peak. Array pressure on the price is high where May 2025 was the last time BTC was at a low array buying pressure. Similarly, Bollinger Band phase is positive with the last negative being around April to May 2025. Bear power is in control right now. Selling pressure chop chai confirms the bear power indicator. Directional momentum does appear to be being taken over by selling also indicated is the strong average gauge to confirm the strength of selling. MA quad gives an indication the price is losing with the losing line in control over the top of the winning line. Triple descending pyramids appeared last week with the last time multiples of those type appeared happened around the start of February 2025. MACD lines have crossed 0 moving in a downward direction.
The balance of the imaginary weighted scale appears to be shifting to the right as in falling until the balance is level. The price of BTC often follows no logical path or makes any sense. This image is not entirely made up and relies on indicators which are unpublished that I drew over to show what is stated in the post.

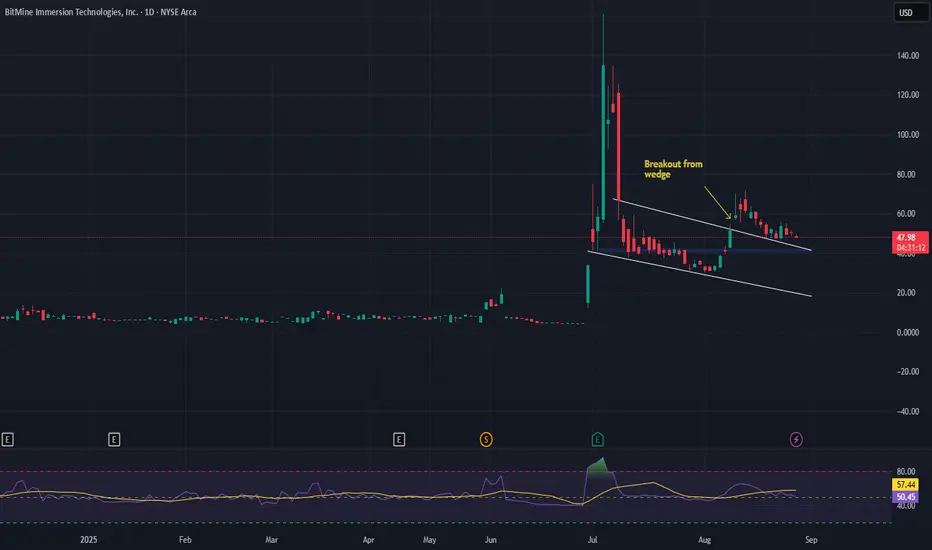
BitMine Immersion Technologies (BMNR) AnalysisCompany Overview:
BitMine Immersion Technologies AMEX:BMNR is a crypto mining innovator leveraging immersion cooling to maximize mining efficiency and lower operational costs. Recently, the firm has pivoted from Bitcoin mining to Ethereum accumulation, positioning itself as a long-term Ethereum value play.
Strategic Drivers:
Ethereum Focus: Building exposure to the fast-growing DeFi, smart contract, and developer ecosystem.
Treasury Growth: Ethereum holdings have surged in value with ETH rising above $4,000 and peaking at $5,200 in 2025, creating significant unrealized gains.
Investor Confidence: Backed by high-profile investors, expanding revenues, and improving liquidity.
Capital Strategy: Launch of a $1B share repurchase program highlights management’s conviction and shareholder-first approach.
Investment Outlook:
Bullish above: $41–$42.
Upside target: $130–$135, supported by Ethereum accumulation, buybacks, and capital efficiency.
📢 BMNR—A high-beta Ethereum proxy with structural tailwinds from DeFi expansion and shareholder-focused capital allocation.
#BMNR #Ethereum #CryptoMining #DeFi #Blockchain #GrowthStocks #Buybacks
TradeCityPro | POL Testing Range Top Amid Bullish Momentum👋 Welcome to TradeCity Pro!
In this analysis I want to review the POL coin for you. One of the so-called Ethereum Killer projects that in the previous bull run was highly hyped to replace Ethereum and now with a market cap of 2.6 billion dollars is ranked 42 on CoinMarketCap.
📅 Daily Timeframe
In the daily timeframe, this coin, like most altcoins, is in a very long-term range box. Now, after significant buying volume, it has reached the Maker Seller zone at the top of the box.
✔️ Since the price has registered a higher low than the 0.1717 bottom, the probability of breaking the zone has greatly increased. On the other hand, buying volume has gradually increased as the price has moved from the bottom of the box to the top, which shows the strength of the bullish trend.
⚡️ Now several daily candles in a row are stuck near this zone, consolidating just below it. If the zone is broken, we can have a long-term long position or even buy this coin in spot.
📊 If the bullish move starts, the resistance levels we can use as targets are 0.3299, 0.4271, and 0.5310. If the bullish trend continues and there are no signs of weakness, each of these levels can act as a new trigger for a long position.
🔍 If the price gets rejected from the resistance zone, with the breakdown of the 0.2315 trigger, the probability of a bearish move toward the 0.1717 bottom also exists, and with the breakdown of 0.2315 we can open a risky short position.
💥 With the breakdown of 0.1717, we also get the main confirmation of the trend change, and if this level is broken, this coin could have a very large drop.
📝 Final Thoughts
Stay calm, trade wisely, and let's capture the market's best opportunities!
This analysis reflects our opinions and is not financial advice.
Share your thoughts in the comments, and don’t forget to share this analysis with your friends! ❤️

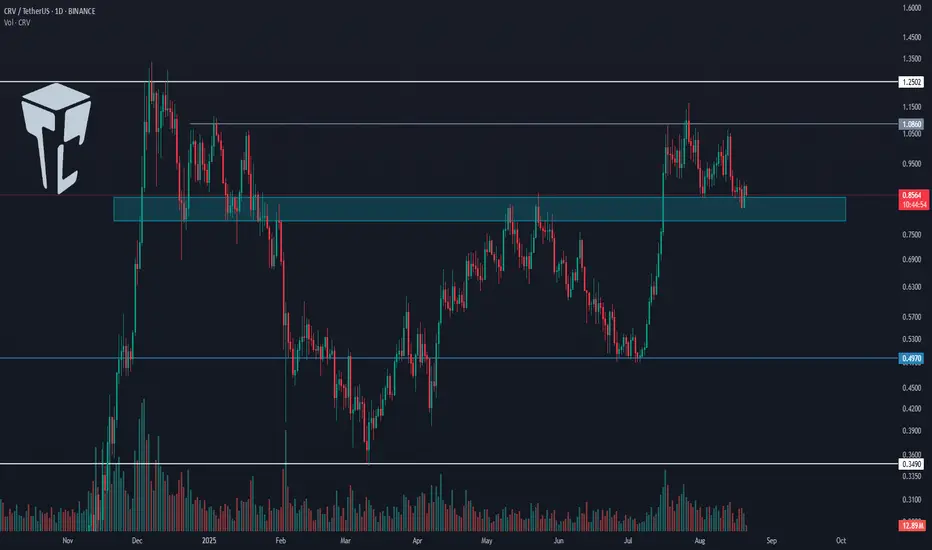
TradeCityPro | CRV: Key Support Test in DeFi Token👋 Welcome to TradeCity Pro!
In this analysis, I want to review the CRV coin for you. It is one of the DeFi projects under Ethereum with a market cap of 1.17 billion dollars, currently ranked 72 on CoinMarketCap.
📅 Daily Timeframe
In the daily timeframe, CRV has a very important support zone, and right now the price is trading near this area.
✔️ The overall trend of CRV can currently be considered bullish because the main highs and lows it has formed are higher highs and higher lows, and at the moment, the price is in the corrective phase of this trend.
⚡️ If the support zone is broken, this corrective phase will deepen, and the price could move toward lower levels. The main supports for this coin in the daily timeframe are 0.497 and 0.349.
💥 Considering the ongoing bullish trend, long positions are currently more logical. If CRV gets supported at this zone, we can look for triggers in lower timeframes to open positions.
📈 The main triggers for long positions on this coin are the breakouts of 1.086 and 1.2502.
📝 Final Thoughts
Stay calm, trade wisely, and let's capture the market's best opportunities!
This analysis reflects our opinions and is not financial advice.
Share your thoughts in the comments, and don’t forget to share this analysis with your friends! ❤️
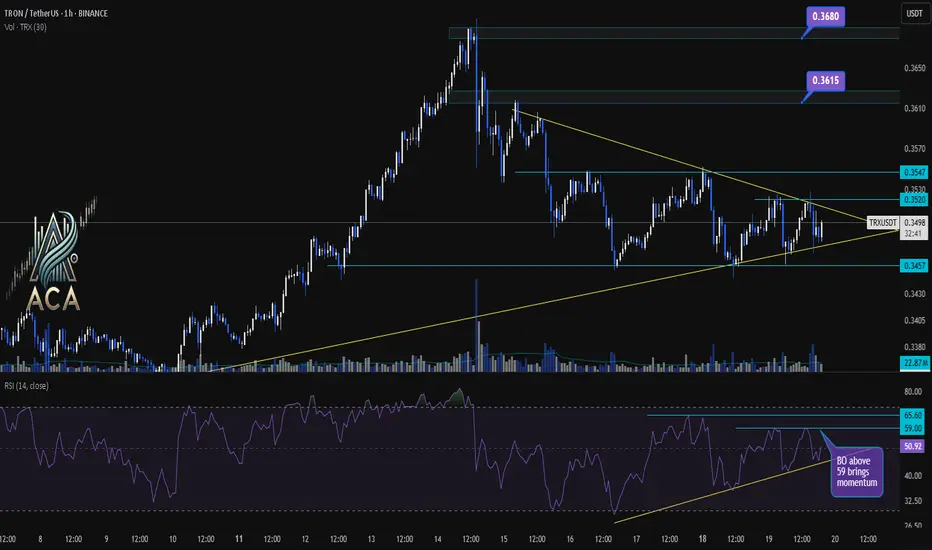
TRXUSDT 1H Chart Analysis | Eyeing the Breakout for MomentumTRXUSDT 1H Chart Analysis | Eyeing the Breakout for Momentum
🔍 Let’s break down TRX/USDT price action and identify setups that could unlock the next move, with a spotlight on RSI dynamics and key breakout levels.
⏳ 1-Hour Overview
The chart is currently forming a tightening symmetrical triangle, signaling a squeeze ahead of an expected breakout. Price action is consolidating between the local support at $0.3457 and resistance near $0.3520–$0.3547.
📈 RSI Insights
- The RSI sits around 48, reflecting short-term indecision and neutral momentum.
- There’s a clear RSI trendline forming higher lows, indicating underlying strength building up.
- Watch closely: An RSI breakout above 59 is flagged as a momentum trigger, historically driving stronger moves.
📊 Key Highlights:
- Chart pattern: Tightening triangle points to an imminent volatility expansion.
- Price structure: Breakout (BO) above $0.3520 or, more convincingly, $0.3547 opens up higher targets.
- Bullish targets: $0.3615 and $0.3680—these mark the next resistance zones if upside momentum takes over.
- RSI dynamics: Trendline support on RSI signals hidden demand; BO above 59 on RSI can fuel upside moves.
🚨 Conclusion:
TRX is at a make-or-break juncture. A decisive breakout above $0.3520 or, even better, $0.3547 could unlock a rally to $0.3615 and $0.3680. Keep a close eye on the RSI—trendline holds and a thrust above 59 can serve as early confirmation of buyer strength.
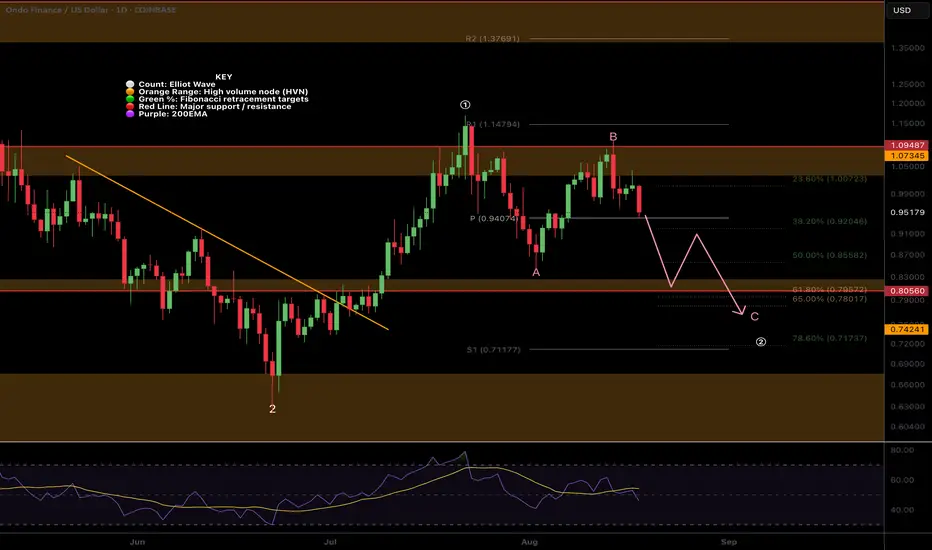
$ONDO ABC Correction in Wave 2?LSE:ONDO wave (c) of 2 appears to be underway after the failure to reach a new local high. However there is strong support just below of the daily pivot and 200EMA.
Failure to hold this level brings up the High Volume Node support and golden pocket at $0.79. RSI has room to fall and the alt-coin golden pocket, Fibonacci 0.786 sits at the S1 daily pivot.
Analysis is invalidated above wave B.
Safe trading
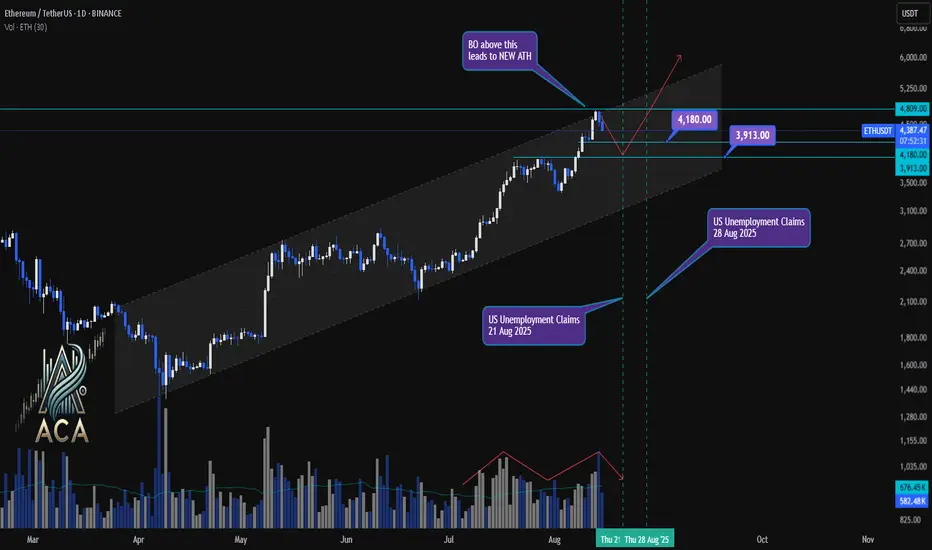
ETHUSDT 1D Chart Update | Channel Structure, Economic EventsETHUSDT 1D Chart Update | Channel Structure, Economic Events & ATH in Focus
🔍 Here’s the latest breakdown of ETH/USDT price action on the daily chart—channel dynamics, correction levels, and upcoming catalysts.
⏳ Daily Overview
Ethereum is trending strongly within an ascending channel, respecting both mid-level and upper resistance. After a local correction, price is rebounding with sturdy volume participation—signaling renewed interest from buyers.
📉 Correction Levels & Volume
- Recent correction found support at the $3,913 zone, with the $4,180 mark now acting as next key level.
- Volume has picked up on bullish candles, confirming the strength of this bounce.
- Correction appears healthy: price stayed within the channel, higher lows maintained.
📊 Channel, Economic Events & Breakout Setup
- ETH continues trading inside the established channel, posting higher highs and higher lows.
- Two major US economic events ahead—Unemployment Claims releases on Aug 21 and Aug 28, 2025—that could trigger volatility.
- Watch for a breakout (BO) above $4,809: crossing this sets the stage for a new all-time high (ATH).
🎯 Key Levels & Scenario
- $3,913: Correction support zone; ideal spot for high RR (risk/reward) long entries if retested.
- $4,180: Immediate resistance; flipping this could attract trend-following bulls.
- $4,809: Channel top and major breakout threshold. If price closes above, expect acceleration toward new ATH territory.
🚨 Conclusion:
ETH is pushing firmly inside its channel, with correction and volume patterns favoring bullish continuation. Key economic events may provide the volatility needed for a breakout move. Above $4,809, watch for new ATHs; dips to $3,913–$4,180 offer attractive re-entry zones for aggressive traders. Stay adaptive as August catalysts unfold.
HYPEUSDT.P 4H Chart Analysis | Volume Surges...HYPEUSDT.P 4H Chart Analysis | Volume Surges As Price Approaches ATH
🔍 Let’s break down the HYPE/USDT perpetual contract and scope out bullish momentum alongside key technical catalysts.
⏳ 4-Hour Overview
The 4-hour chart confirms an upward trend, reinforced by strong candle structure and sustained volume inflows. Price is approaching its all-time high (ATH) around $49.618, making this level crucial for the next directional move.
📊 Key Highlights:
- Volume: Noticeable volume convergence during the latest upward leg, demonstrating strong buyer interest as price accelerates toward ATH.
- 3SMA Trend: Moving averages (7, 25, 99) currently support the bullish structure, with price action maintaining strength above these key levels at $47.224, $45.752, and $41.744, respectively.
- Upward Trend: Higher lows and consistent higher highs define strong momentum, while the chart illustrates bullish continuation potential after consolidation.
- ATH Test: A breakout and hold above all-time high could open the door for further rallies, especially if volume continues to expand in sync with price.
🌐 DeFi Momentum
- Total Value Locked (TVL): DeFi markets are surging with $2.237B TVL across top protocols, underscoring broader sector confidence.
- Top 10: HYPEUSDT's movement mirrors strength seen among top DeFi assets, hinting at sector-wide bullish alignment.
🚨 Conclusion:
HYPEUSDT is building bullish energy as it tests the ATH with volume backing the move. Keep a close eye on price action near resistance—if buyers sustain momentum, next targets could materialize quickly. Support rests on 3SMA levels, with DeFi sector trends providing further tailwinds.

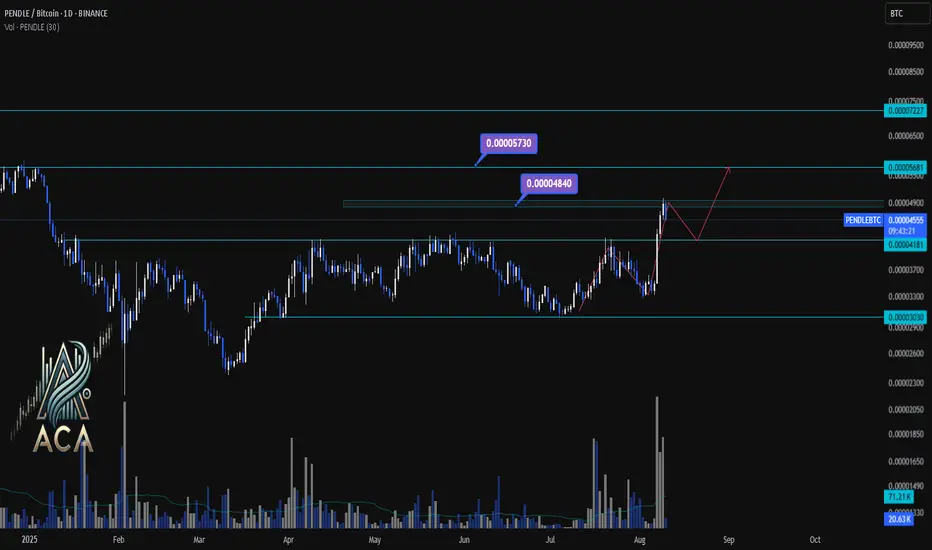
PENDLE/BTC Daily Chart Analysis | Momentum Building for the NextPENDLE/BTC Daily Chart Analysis | Momentum Building for the Next Move
🔍 Let’s dive into PENDLE/BTC and highlight the current technical landscape with key areas to watch for traders.
⏳ Daily Chart Overview
PENDLE/BTC recently broke above a multi-month resistance near 0.00004500, confirming strong bullish momentum on the daily timeframe. Volume surges are supporting this upward move, indicating increased market participation and renewed interest from buyers.
🔺 Bullish Scenario:
If the uptrend continues, look for a push toward the first target:
- 0.00004840 (major supply/target zone)
- On further strength, 0.00005730 is in sight as the next resistance.
Expect short-term consolidation or minor pullbacks before any strong breakout.
🔻 Bearish/Consolidation Scenario:
If sellers step in or the rally loses steam, support is found at:
- 0.00004181 (immediate level)
- If this breaks, look for deeper retracement toward 0.00003300 (structural support).
📊 Key Highlights:
- Daily breakout from a consolidation range signals bullish continuation potential.
- Volume spikes confirm genuine buyer interest at current levels.
- Major upside targets: 0.00004840 and 0.00005730.
- Critical downside supports: 0.00004181 and 0.00003300.
- Price action may oscillate (range/consolidate) between the support and resistance before a major move.
🚨 Conclusion:
Momentum favors bulls as long as price holds above 0.00004181. Watch for a confirmed breakout above 0.00004840 for additional upside. Stay nimble—volatility will likely provide both breakout and pullback opportunities.
Keep an eye on PENDLE/BTC and PENDLE/USDT📈📊
Venus (XVS) After a 98% Drop | Is It Time to Fly Again?💀 Hey , how's it going ? Come over here — Satoshi got something for you !
⏰ We’re analyzing XVS on the 1-Week timeframe .
This is one of my personal favorite coins, which, after setting its all-time high, experienced a massive 98% drop in price. Despite that, it has managed to hold its position at rank 369 on CoinMarketCap.
👀 After forming a strong ATH around $140, Venus faced a rejection and entered a very deep correction. A downtrend channel has been drawn—serving purely to illustrate the slope and scale of the correction.
⚙️ Our key RSI level is 54.25; breaking above this level will likely trigger stronger long positions for Venus.
✏️ A curve line has been plotted to visualize the time–price path, making price action easier to interpret. In most cases, a curve line reaction or breakout tends to push the price toward the next key support or resistance level.
⚡ An important resistance has formed at $7.13. If this resistance breaks, a spot position with a tight stop-loss could be considered for the portfolio.
🎮 A Fibonacci retracement has been drawn to map important zones. On the multi-timeframe view, the weekly area appears to be in a range. The 0.236 level is acting as the ceiling—breaking this level (at $7.37) could be a trigger for opening positions.
🟢 Venus’s trading volume is decreasing, which is actually a positive sign; the lower the volume before a breakout, the easier and cleaner the breakout can be—similar to price escaping a consolidation box and surging upward.
🔍 Project fundamentals: Venus operates in the DeFi lending sector, built on the BSC network. It uses a governance token model where collateral supply can be adjusted by the supplier. By staking this coin, you can also mint the VAI stablecoin.
🔔 Alert zone: Set an alert at $7.737 and monitor price action on multiple timeframes when it’s reached. If it aligns with the above confirmations, you can open your position. This alert has been preset in the TradingView team setup.
🖥 Summary: On the weekly chart, Venus is facing a key resistance level. A breakout above it could significantly increase capital inflows and allow the coin to test higher price levels.
⏰ We’re analyzing XVS on the 1-Day timeframe .
👀 I’ve already provided the full project details above. On the daily timeframe, this coin is moving within an upward channel with a healthy slope and has maintained this structure well. A breakout above the channel’s upper boundary coincides with the zone we identified on the weekly timeframe, intersecting with the $7.26 resistance. The more we zoom out in multi-timeframe analysis, the more precise the resistance price zones become, allowing us to shift the alert zone to this key level.
⚙️ Our critical swing level is at 62.85. Breaking above this level will likely increase trading volatility, potentially pushing Venus into overbought territory again and driving it toward higher resistance levels.
🟢 Venus’s trading volume is decreasing, and we have a very strong daily box that essentially highlights the heavy $7.26 resistance.
🖥 Summary: If Venus breaks the identified zone, triggers the alert level, and confirms its reaction around $7.26, it could provide us with a long position. With proper profit-taking or closing the position, we could then consider buying Venus in spot.
❤️ Disclaimer: This analysis is purely based on my personal opinion and I only trade if the stated triggers are activated.

TradeCityPro | OP Eyes Breakout in Prolonged Altseason Range 👋 Welcome to TradeCity Pro!
In this analysis, I want to review the OP coin for you — one of the Layer 2 projects whose token currently holds a market cap of $1.39 billion and is ranked 68th on CoinMarketCap.
📅 Daily Timeframe
On the daily timeframe, OP is moving within a range box between 0.521 and 0.920, which formed after a downtrend, and the price has been fluctuating in this box for several months.
🔑 One key resistance on this coin is 0.816, which can be used as a trigger for a long position.
📈 This trigger can also be used for spot buying, but given its Bitcoin pair, I prefer to take the position in futures and reserve spot buys for future triggers.
💥 For momentum confirmation of this position, we can use RSI’s entry into the Overbought zone, since RSI is currently near this area, and if it enters, it could support a strong upward move.
📊 The next long trigger is the breakout of 0.920. However, this trigger is not valid at the moment because the price hasn’t reacted to it for a long time, and in the future, if it does react, the level will likely change. In that case, I’ll update the analysis and give you the new trigger.
✔️ If OP declines, the first important support we have is 0.626. A close below this level could allow for a risky short position, but for shorts, I’ll personally wait for a break below 0.521.
📝 Final Thoughts
Stay calm, trade wisely, and let's capture the market's best opportunities!
This analysis reflects our opinions and is not financial advice.
Share your thoughts in the comments, and don’t forget to share this analysis with your friends! ❤️

$ETHUSD: Long term trend and cup and handle pattern...Ethereum is finally very close to breaking out into a new 52wk high following a long term basing pattern that looks like a classic cup and handle. Timemode signals warned us of its bullishness earlier, as the daily, weekly, monthly and now quarterly trends turned bullish one after the other since April this year.
If you're sidelined or short, join the bulls and go long ASAP. Risk is a drop under $1715 for the long term patterns at play here, projected targets range from 10k to 95k long term. Fundamentals as you probably know favor a massive bullish trend as ETH transaction count breaks ATH, institutions race to acquire more ETH day to day, ETF flows are steadily bullish and regulations have become favorable for the growth of defi via stablecoin and RWA adoption, as well as potential for new defi primitives and existing ones to gain traction with widespread use.
Ethereum defi now is secure and solid enough, and can handle the required throughput, and the wheels are in motion for a spectacular move from here.
Best of luck!
Cheers,
Ivan Labrie.
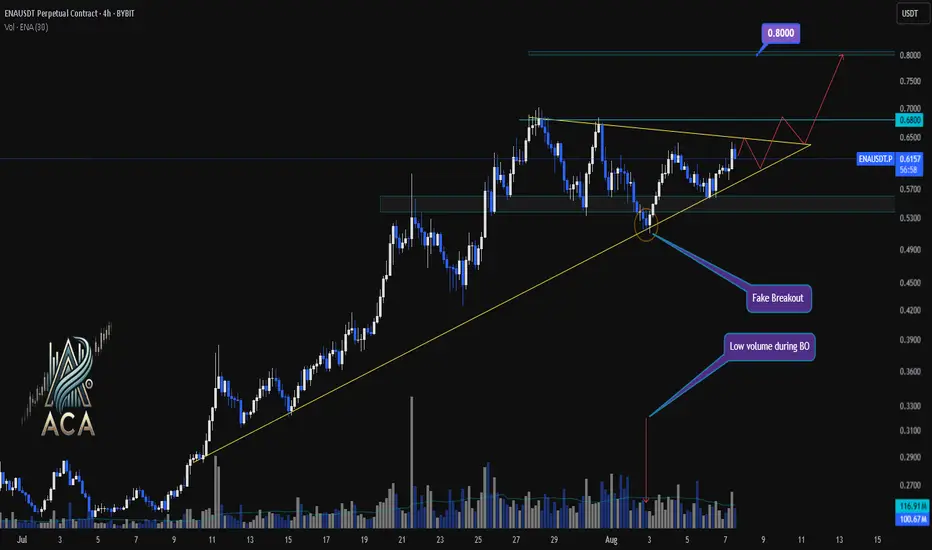
ENAUSDT 4H Chart Analysis | Bullish Breakout Setup in FocusENAUSDT 4H Chart Analysis | Bullish Breakout Setup in Focus
🔍 Let’s dive into the ENAUSDT perpetual contract and analyze the recent price action, spotlighting key technical signals and a potential breakout scenario.
⏳ 4-Hour Overview
The 4-hour chart shows ENAUSDT consolidating above a critical ascending trendline, with price action tightening into a symmetrical triangle formation. Multiple attempts to break down have resulted in a fake breakout, as indicated by low volume during the breakdown — a classic sign of seller exhaustion.
🔺 Bullish Breakout Setup:
On the upside, a confirmed breakout above the $0.6800 resistance could pave the way for a bullish continuation towards the $0.8000 target zone. The structure suggests increasing buying pressure as long as price holds above the trendline and key support ($0.6050).
📊 Key Highlights:
- Price retested the ascending trendline; buyers defended it aggressively.
- A fake breakout with low volume suggests trap for bears and quick recovery by bulls.
- The next major resistance comes at $0.6800, with a projected target at $0.8000 upon breakout.
- Short-term support sits at $0.6050. Price action above this level remains constructive.
🚨 Conclusion:
Watch for a decisive move beyond triangle resistance. A high-volume breakout above $0.6800 could trigger a sharp move toward $0.8000. Bulls are building momentum — keep an eye on volume to confirm breakout strength.
You've Already Lost: The Bitcoin Delusion of FOMO and False HopeLet’s get one thing straight: if you’re staring at Bitcoin, squinting past the red flags, and convincing yourself it’s not a Ponzi scheme because of that one shiny feature that screams “legit,” you’re not investing—you’re auditioning for the role of “next victim.” And if your motivation is the fear of missing out (FOMO) or the fantasy of getting rich quick, well... congratulations. You’ve already lost.
The 99%: Red Flags Waving Like It’s a Parade
Let’s talk about the indicators—the ones that make Bitcoin look suspiciously like a Ponzi scheme. No, it’s not technically one, but the resemblance is uncanny:
- No intrinsic value: Bitcoin isn’t backed by assets, cash flow, or a government. It’s worth what the next person is willing to pay. That’s not investing. That’s speculative hot potato.
- Early adopters profit from new entrants: The people who got in early? They’re cashing out while newcomers buy in at inflated prices. That’s the classic Ponzi dynamic: old money out, new money in.
- Hype over utility: Bitcoin’s actual use as a currency is minimal. It’s slow, expensive to transact, and volatile. But hey, who needs functionality when you’ve got memes and moon emojis?
- Opaque influencers: From anonymous creators (hello, Satoshi) to crypto bros promising Lambos, the ecosystem thrives on charisma, not accountability.
- Scam magnet: Bitcoin has been the currency of choice for over 1,700 Ponzi schemes and scams, according to a University of New Mexico study cs.unm.edu . That’s not a coincidence. That’s a pattern.
The 1%: The “But It’s Decentralized!” Defense
Ah yes, the one redeeming quality that Bitcoin evangelists cling to like a life raft: decentralization. No central authority! No government control! It’s the financial revolution!
Except… decentralization doesn’t magically make something a good investment. It just means no one’s in charge when things go wrong. And when the market crashes (again), you can’t call customer service. You can tweet into the void, though.
FOMO: The Real Engine Behind the Madness
Let’s be honest. Most people aren’t buying Bitcoin because they believe in the tech. They’re buying because they saw someone on TikTok turn $500 into a Tesla. FOMO is the fuel, and social media is the match.
Bitcoin’s meteoric rises are often driven by hype cycles, not fundamentals. Tesla buys in? Price spikes. El Salvador adopts it? Price spikes. Your cousin’s dog walker says it’s going to $1 million? Price spikes. Then it crashes. Rinse, repeat.
This isn’t investing. It’s gambling with a tech-savvy twist.
The Punchline: You’ve Already Lost
If you’re ignoring the overwhelming signs of speculative mania and clinging to the one feature that makes you feel better about your decision, you’re not ahead of the curve—you’re the mark. And if your motivation is “I don’t want to miss out,” you already have. You’ve missed out on rational thinking, due diligence, and the ability to distinguish between innovation and illusion.
Bitcoin might not be a Ponzi scheme in the legal sense. But if it walks like one, talks like one, and makes early adopters rich at the expense of latecomers… maybe it’s time to stop pretending it’s something else.
INDEX:BTCUSD NYSE:CRCL NASDAQ:HOOD TVC:DXY NASDAQ:MSTR TVC:SILVER TVC:GOLD NASDAQ:TSLA NASDAQ:COIN NASDAQ:MARA

[Deep Dive] SUSHI – Edition 3: Accumulate. Anticipate. Accelerat🧠 Cycle Anatomy: What the Chart Is Telling Us
📉 Phase 1: Markdown
The bears dominated, slicing price downward into key historical support around the $0.50 mark — the same level that anchored the previous accumulation zone.
📦 Phase 2: Accumulation
Both accumulation phases (mid-2023 and Q2 2025) occurred near identical support zones, with rounded bases and sideways chop — signaling strong hands quietly absorbing supply.
📈 Phase 3: Markup Incoming?
Following breakout point “1” and retest point “2,” the current structure aligns remarkably well with the previous markup phase — which propelled SUSHI from ~$0.50 to over $3 in just weeks. While past performance isn’t a guarantee, this fractal deserves attention.
🔥 Why Fundamentals May Support This Move
- SushiSwap v3 continues rolling out on multiple chains, optimizing capital efficiency and fee structure for LPs.
- Governance has stabilized after the rough patches of 2022–2023, with more transparent treasury and development direction.
- Cross-chain expansion and integrations with major aggregators (like 1inch, Matcha, and DeBank) are boosting SUSHI’s visibility in the broader DeFi flow.
Additionally, a surge in TVL and DEX activity on low-fee chains could redirect volume back to SushiSwap — a platform known for its cross-chain capabilities.
📍 What to Watch Next
- A confirmed breakout above $1.00 would validate the “markup” thesis.
- A dip toward the $0.65–$0.70 zone could offer a high-risk/reward entry aligned with point “2.”
- Failure to hold the $0.50 level would invalidate the structure.
For now, the rhythm is clear: markdown → accumulation → markup. And if the pattern holds, SUSHI might just be preparing for its third vertical.
💬 Do you think this is just another fakeout — or is SUSHI gearing up for a DeFi comeback?
🔔 Disclaimer: This post is for educational and informational purposes only. It does not constitute financial advice. Always do your own research and manage risk carefully.
📚 Always follow your trading plan => including entry, risk management, and trade execution.
Good luck!
All strategies are good, if managed properly.
~ Richard Nasr

DeFi’s Make-or-Break MomentThe spotlight today is on TOTALDEFI, an index that could become one of the most exciting charts in the crypto market.
While many altcoins look heavy under selling pressure, TOTALDEFI is holding firmly at the 61.8% Fibonacci support near 116B. This zone is often a turning point where strong reversals begin. If the level continues to hold, we might see a 20% move to the upside, signaling renewed strength in the DeFi sector.
This price action could be a sign that decentralized finance projects are ready to lead the next market phase.

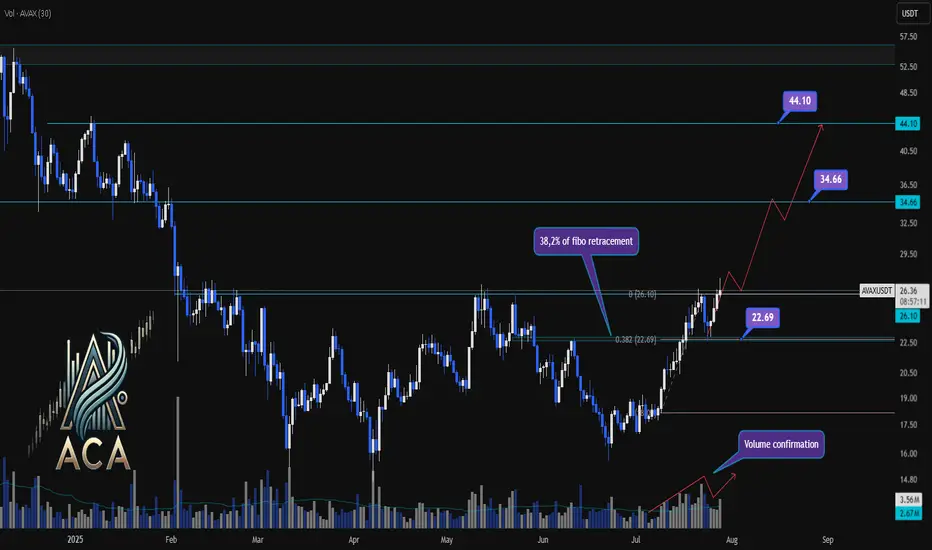
AVAXUSDT Trend Analysis | Will Volume Confirm the Next Big Move?AVAXUSDT Trend Analysis | Will Volume Confirm the Next Big Move?
🔍 Let’s break down the AVAX/USDT setup, examining its technical structure and mapping out key opportunities as it gears up for a decisive move.
⏳ Daily Overview
AVAXUSDT has been exhibiting a bullish structure, recently reacting to the 0.382 Fibonacci retracement level (around 22.69USDT) where price paused for a correction. This correction was technically healthy, as it occurred with declining volume, while upward impulses were marked by notable volume surges—signaling strong bullish participation and confirming accumulation phases.
🔺 Bullish Scenario:
The next area to watch is the resistance at 26.10USDT, which has acted as a major barrier in recent trading sessions. A decisive daily close above this level—preferably supported by a clear uptick in volume—would confirm breakout momentum and set the stage for further advances.
Upon confirmation, the chart points to medium- and long-term targets at 34.66USDT and eventually 44.10USDT. These levels are derived from key Fibonacci extensions and historic price reactions, offering logical take-profit zones for trend-following strategies.
📊 Key Highlights:
- 0.382 Fibonacci level (22.69USDT) acted as a reaction zone and healthy correction point.
- Volume profile validates trend: increased buying volume during upswings, decreased volume on dips.
- 26.10USDT is the next crucial resistance for confirmation.
- Breakout (with volume) opens path to 34.66USDT and 44.10USDT targets.
- Failure to clear 26.10USDT could result in consolidation or another retest lower.
🚨 Conclusion:
All eyes are on the 26.10USDT resistance. Wait for a clear daily close and volume confirmation before considering entries. A breakout above this level could propel AVAXUSDT towards higher Fibonacci targets, while a rejection may prompt another retest of prior supports or consolidation.
Stay sharp and plan your trades with discipline!
INJUSDT Daily Chart Analysis | Uptrend Brewing at Crucial LevelINJUSDT Daily Chart Analysis | Uptrend Brewing at Crucial Resistance
🔍 Let’s break down the INJ/USDT setup, examining its technical structure and mapping out key opportunities as it gears up for a decisive move.
⏳ Daily Overview
The INJUSDT pair is forming a solid bullish structure, supported by a clear ascending triangle pattern on the daily timeframe. Notably, the 3SMA (7, 25, 99) are crossing to the upside, signaling the early stage of a potential upward trend. This momentum is reinforced by the ascending triangle’s rising trendline, showing steady accumulation and higher lows.
🔺 Bullish Scenario:
Price is consolidating just below the critical resistance at $15.340—a key zone highlighted by multiple rejections in recent months. A confirmed breakout above this level, especially if backed by a surge in volume, would not only trigger a triangle breakout but also complete the weekly candle formation as a bullish hammer, strengthening the bullish case.
If this breakout sustains, short-term targets line up at $20.290, with the long-term roadmap pointing toward $33.970.
📊 Key Highlights:
- 3SMA (7, 25, 99) MA cross signals the beginning of an upward trend.
- Daily ascending triangle points to persistent bullish pressure.
- $15.340 remains a crucial resistance; price has tested and failed here twice before.
- Breakout confirmation (with volume) could ignite a rapid move to $20.290.
- Failure to break may result in another retest of the triangle’s trendline support.
🚨 Conclusion:
All eyes are on the $15.340 resistance. Wait for clear daily close and volume confirmation before entering. A successful breakout aligns with a bullish weekly hammer and could trigger the next phase higher. Beware of fakeouts, as rejection at resistance could send INJUSDT to retest lower trendline zones.
Stay sharp and plan your entries wisely!

TradeCityPro | JUP Eyes Breakout as Altseason Momentum Builds👋 Welcome to TradeCity Pro!
In this analysis, I want to review the JUP coin for you. It’s one of the projects in the Solana ecosystem, currently ranked 59 on CoinMarketCap with a market cap of $1.65 billion.
📅 Daily Timeframe
On the daily timeframe, this coin is currently sitting below a very important resistance zone at 0.6312. This is a strong resistance area and serves as the main trigger for a trend reversal in this coin.
✔️ The main support floor for JUP is located at 0.3409, a level price has tested twice before. Now it has returned to 0.6312, and we can see increased market volume at this level, which indicates tension between buyers and sellers.
✨ A breakout of 0.6312 would be a good trigger for a long position, and I plan to open a long if this level breaks. This could potentially be a long-term position with a high risk-to-reward ratio.
🔔 The next major resistance zones are at 0.7858 and 1.1435, which we can use as targets for this position.
🔽 If the price gets rejected from the top and moves down, breaking 0.4186 and 0.3409, we can look to open a short position.
🧩 The break of 0.3409 would confirm the start of a downtrend, and it's one of the key zones where I’ll definitely look to hold a short position if it breaks.
📝 Final Thoughts
This analysis reflects our opinions and is not financial advice.
Share your thoughts in the comments, and don’t forget to share this analysis with your friends! ❤️

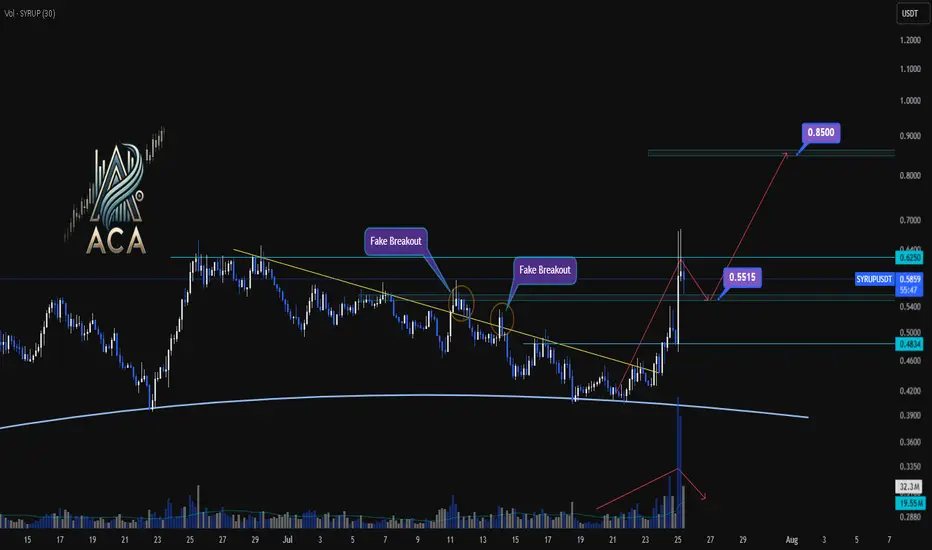
SYRUPUSDT 4H Chart Analysis | Trendline Breakout & Next MovesSYRUPUSDT 4H Chart Analysis | Trendline Breakout & Next Moves
🔍 Let’s break down the latest action on the SYRUP/USDT 4H chart and pinpoint what comes next as trend and momentum cues line up for traders.
⏳ 4-Hour Overview
- The recent breakout above the key trendline was backed by a surge in volume, providing clear momentum confirmation and pushing price toward resistance.
- Price has already reached 1.5R of the initial breakout target, a strong sign the trend is in motion.
- Upon touching the $0.6250 resistance, momentum cooled, with volatility decreasing — a classic consolidation phase after a high-energy move.
🔻 Correction & Structure
- With volume subsiding and momentum slowing post-$0.6250, we’re now expecting a corrective move down toward $0.5515.
- This retracement zone will be critical to watch for higher low formation – a bullish structural signal if supported by volume confirmation.
🔺 Long Setup:
- Should SYRUP reclaim and break above $0.6250 after setting a higher low at $0.5515, and with renewed volume, we could see another strong leg higher.
- The next major resistance sits around $0.85 — this aligns as a logical upside target based on the range extension.
📊 Key Highlights:
- Trendline breakout with sharp volume spike = momentum confirmation.
- 1.5R reached before first deep pullback; structure remains bullish above $0.5515.
- Watch for a higher low and subsequent break of $0.6250 with volume to confirm the next move to $0.85.
🚨 Conclusion:
SYRUP’s chart is at a pivotal juncture: a constructive pullback to $0.5515 could set up the next wave higher if supported by volume. A confirmed breakout above $0.6250 targets $0.85 — stay patient and wait for volume signals at key levels.
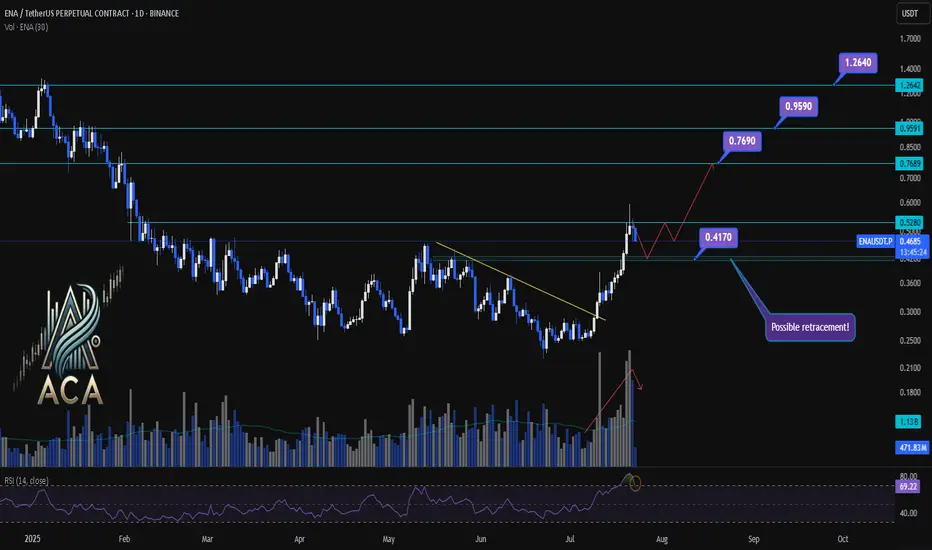
ENA/USDT Chart Analysis | Volatility Signals & Bullish TriggersENA/USDT Chart Analysis | Volatility Signals & Bullish Triggers
🔍 Let’s dive into the ENA/USDT perpetual contract and analyze recent price action, focusing on momentum shifts and key breakout scenarios.
⏳ Daily Overview
The daily chart shows that ENA recently reentered the overbought zone on the RSI, which can serve as a potential trigger for traders watching momentum shifts. Earlier, price action broke decisively above a long-standing descending trendline, resulting in a rapid, nearly 100% surge, a classic RR2 move off the trendline. This breakout coincided with a visible uptick in trading volume, confirming strong demand behind the move.
Now, during the ensuing rest or correction phase, trading volume is decreasing—often a constructive sign suggesting either profit-taking or a healthy pullback rather than panic selling.
🔺 Bullish Trigger & Setup:
- RSI Signal: Reentry into the RSI overbought zone is a potential long trigger, especially if confirmed by price action.
- Confirmation Level: A daily close with strong volume above $0.528 would add conviction to a bullish setup.
- Trendline Reference: The break above the recent trendline fueled the rapid advance, showing the importance of watching such key resistance levels.
📊 Key Targets (on further bullish confirmation):
- $0.769 — First upside resistance.
- $0.959 — Next bullish target.
- $1.264 — Extension target if momentum continues and broader market sentiment remains supportive.
🚨 Conclusion:
Eyes are on the $0.528 level—closing above it with volume, especially while RSI holds in the overbought zone, could provide the next strong entry signal. Current declining volume during pullbacks suggests this is likely a profit-taking phase or standard correction, not bearish capitulation. Keep monitoring RSI, volume profile, and price closes for the next actionable opportunity.