$BYND: How a 'Special Salmon' Navigates a SqueezeThe Technical Landscape
The NASDAQ:BYND chart is speaking, and it is screaming.
What we are witnessing is a classic, high-velocity short squeeze—a market event driven by pure, raw emotion and mechanical positioning, not by a sudden, fundamental shift in the company's core health. This is a firestorm of short-seller capitulation and retail FOMO. The RSI, our measure of the market's breath, is hyperventilating at a reading above 95. The volume is climactic.
This is the fire. A limitless trader does not chase the fire. We observe it, we respect it, and we wait for it to reveal a new structure.
The Philosophy (The 'Special Salmon' Trap)
The current price action is the classic 'salmon' trap. Traders see the price rocketing and feel the biological, primal urge to swim upstream. They chase the move, fearing they will miss out. But they are swimming directly into the mouths of the bears and early longs who are ecstatic to sell their shares at a 1,000% profit.
That does not mean these waters are prohibited.
It simply means that your traditional salmon has a very low probability of completing their journey here. These rivers are patrolled by special bears. To navigate this, you must be a very self-aware, "special salmon."
This means: You understand this is not a value investment. You understand this is a high-risk, frenzy-driven, price-action gamble. You understand that position sizing is your only true defense. This is a trade for an exceptionally light, almost trivial, amount of capital—an amount you are fully prepared to lose.
An Illustrative Setup (The Patient Plan)
This is a plan of patience. It is not a call to action, but a map for a potential "what if" scenario. We are waiting for the fire to die down and for the price to return to a logical, structural zone of interest. We do not chase; we let the price come to us.
This plan is a high-risk, asymmetric bet on volatility, with a timeframe of days to weeks.
The Entry Zone: We are watching for a deep pullback to the ~ $2.28 zone. This is the area of interest, a potential structural support base. This is where we might consider entering the water. The Risk-Management Zone: The plan's "I am wrong" point is a "fuzzy" zone around ~ $0.43. This is our line in the sand. If this level breaks, the idea is invalid. The Profit Zone: The target is an ambitious, long-term zone around ~ $19.39, representing a recapture of a massive, old structural level and the full potential of this squeeze.
This setup defines the trade: a potential R:R of approximately 9.25.
This is about turning '$10 into approximately $100,' while keeping in mind that the '$10 could easily turn into $0.30.' This is a single piece of the puzzle, an exercise in risk-defined, patient speculation.
Disclaimer: This is not financial advice. It is for educational and informational purposes only. Please conduct your own research and manage your risk accordingly.
Degen

Plug - Hear me outProposing a trade on a shit-co like plug may earn some laughs but hear me out for a second.
In the right light and with enough alcohol, she could pass for a strong six. I'd do her.
Jokes, aside, due to the frantic rush to solve AI datacenter energy problem, power companies have been getting a lot of play lately, some have real growth potential, while others may be the speculative dream of degenerates like myself.
A 25 year old company, about to hit the figurative wall (DiCapiro joke...slaps knee), has suddenly seen an influx of buying activity and what looks to be increasing volume following a look below and fail of a weekly box.
According to box rules, I can't ignore this trade. Plug has been in an area of consolidation for years. It's completed atleast two look above and look below and fails of the larger boxed range.
I'm not saying that this stock is going to the moon, but if It can reclaim the top of the mini weekly box and hold the midpoint of the larger box then $8 seems like a realistic target to me.
Now, this stock would easily revert back to the volume point of control (VPOC) around $2 or lbaf again or simply fail miserably below the boxes...then all you degens will be living in boxes.
If we do see 2.50 - $2 again, I'd love to take an entry there (a lbaf of vpoc would be nice too). Otherwise, I'll be monitor this name for the mentioned trades.
My posts are for shits and giggles. I'm just a guy with an interest and a celcius addiction.
~The Villain


$DEGEN - Long Trade IdeaBYBIT:DEGENUSDT | 4h
Price deviated from its swing point at 0.0038 and has now retested it on the lower timeframes.
If this retest holds, we want to see price maintain support at 0.0040
Holding this level opens up a potential liquidity sweep around 0.0050–0.0054
If momentum continues and Bitcoin holds above 104,000, next target is 0.0058–0.0060

$DEGEN - Long SetupBYBIT:DEGENUSDT | 1D
Potential S/R flip here, hold this level I'm expecting it to run .009 to .012 (initial) to .016 to .020
Local support is around .005 to .0035

DEGEN Testing Red Resistance – Breakout Potential!🚀 DEGEN Testing Red Resistance – Breakout Potential! 📈
DEGEN has formed a red resistance zone, where we’re seeing some sellers stepping in. If the price breaks through, the trend could continue with the first target at the green line level! 📊
Let’s watch for that breakout together! 💼💸

$DEGEN - Long Trade IdeaBYBIT:DEGENUSDT | 1D
I'd be looking to long this if we can hold .0032 to .0030
Stoploss: just below .0024
Targets:
.0040-.0044
.0050-.0054
.0057-.0062

DEGEN Roadmap | A Strategic Look Ahead (1D)After a bullish move, DEGEN's correction has started.
Wave A formed a symmetrical pattern, Wave B was a diametric, and Wave C is also unfolding as a symmetrical. We are currently in the middle of Wave C.
It is expected that DEGEN will drop to the green zone in the coming period, where Wave C is likely to complete.
From the green zone, DEGEN could potentially move toward the red box area.
The targets are clearly marked on the chart.
A daily candle closing below the invalidation level would invalidate this analysis.
For risk management, please don't forget stop loss and capital management
Comment if you have any questions
Thank You

DEGEN/USDT Technical Analysis✅Key Support Zone: $0.0058 - $0.0062
✅ Major Resistance Levels:
First Target: $0.0154
Second Target: $0.0220 - $0.0228
Final Target: $0.0256
📉 Market Structure:
The price is currently testing a strong historical support zone around $0.0060, which has previously acted as a demand level.
A potential double bottom formation could be developing, signaling a possible trend reversal.
If the price holds above the white support zone, we might see a bullish bounce towards the next resistance levels.
📈 Bullish Scenario:
A breakout above $0.0075 and a successful retest would confirm bullish momentum.
If the price sustains the higher low structure, it could target $0.0154, then $0.0228 in the mid-term.
🔻 Bearish Risk:
A breakdown below $0.0058 could invalidate this setup, leading to further downside.
Watch for volume confirmation before taking any trade.
⚠️ Trading Strategy:
🔹 Long Entry: After confirmation of a bounce from support.
🔹 Stop Loss: Below $0.0055 to manage risk.
🔹 Take Profit Targets: $0.0154, $0.0228, and $0.0256.

Deceptive market at the beginning of the yearThe first week of the new year is coming to an end, I want to review the market situation. The year for ether and bitcoin opened in the 90-95k and 3250-3500 flat zones. Due to this, the new annual candle is swinging quite calmly. However, in my opinion, this lull is deceptive. The current wave of purchases is so far only a retest of the key 100k level for bitcoin, from where the probability of a bear attack is high. For many altcoins that have shown growth to date, this is also only a retest of the last resistance.
The foreign exchange market also closed the first week extremely negatively, with a steady rise in the dollar. In my opinion, from the current pullback in the crypt, there is a high probability of a resumption of sales, which we observed at the end of the year, with an attempt to continue the trend in bitcoin in order to work out a retest of 75-85k. In this case, today or tomorrow, the crypto market may align with the currency, with significant sales, up to the turning point of the week for individual coins.
In an optimistic scenario, ether will hold 3500 and open a new week higher, by increasing the gap in the eth/btc pair, due to the opening of the year above 0.0035. In this case, with smooth stable sales of bitcoin, altcoins will have opportunities for growth and a further 15% increase in the altcoin index. In my opinion, the probability of this scenario still prevails.
In a more negative scenario, sales of bitcoin and ether will be more aggressive. In this case, bitcoin can show a sharp increase in dominance and money from the market will be used to smooth out the fall of bitcoin. At the same time, the altcoin index may drop down to a 9% retest, which will lead to fractures for most coins.
With the current picture and the threat of a 75k hike in bitcoin, I still recommend carefully weighing money management and reducing positions for those who did not do so in the wake of growth before the new year. Next week, it will be possible to weigh the activity of sellers and make more confident forecasts.
As I expected, there was another manipulation of binance tags this week. It was not for nothing that before the change of year I recommended sales for troy with a likely hike to 0.0025, even then it became obvious that there was no working out of higher goals and a reversal to retest loyalties. After assigning the tag, a test of 0.0015-25 is likely.
As I wrote in the last article, if there is no assignment of the monitoring tag, vib becomes the most interesting tool in the current market. If binance did not consider the dynamics of the token too weak, there is a high probability of continued growth to reverse the medium-term bullish trend with an exit to 0.25+ and the addition of futures. There has already been a successful cancellation of year-end sales and an attempt to return to the trend. With an optimistic scenario and an exit above 0.00000100 for vib/btc, there is a possibility of a powerful impulse to break last week and pair with udt. In the current overbought market, vib remains the most oversold token on binance, which retains a high growth potential. There has also been a rise in vib against bitcoin more than once, creating a gap in vib/btc. A similar pattern could happen again this week. In case of a successful breakdown of vib, vite can also show pleasant dynamics, which also remains the most oversold on binance, having very high technical targets for retest. But because of the monitoring tag, vite growth attempts most often occur last before the week closes.
On average, for most altcoins, I still expect synchronous movement with the altcoin index, before determining further dynamics in the tops in the new week. In my opinion, the probability of fashionable breakouts or steady growth ahead of the altcoin index in the new week is rather weak.

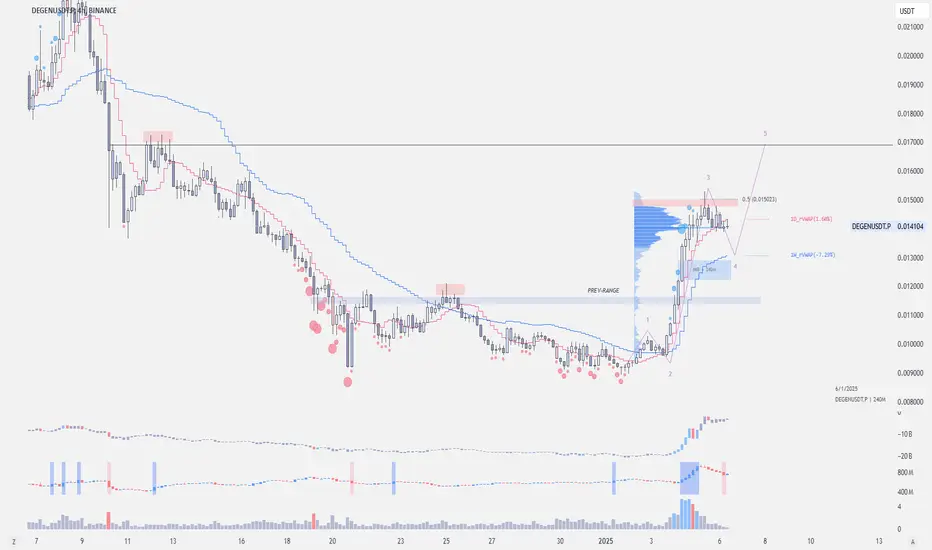
$DEGEN - Potential Retracement Level$DEGEN has reached its immediate supply zone and is now retesting the .015 resistance level.
If it fails to break through .015, the price might decline to the range between .0135 and .0128, where there's a Fair Value Gap (FVG).
Despite this, there's an expectation for another upward movement towards .016 to .017 in the coming days.
Degen Spartan AI: A Bullish Breakout You Can’t IgnoreDegen Spartan AI ($DEGENAI) has captured the attention of the crypto community with its remarkable rise. Despite being a Solana-based memecoin and trading solely on decentralized exchanges (DEXs) like Raydium and Jupiter, it boasts an astonishing market cap exceeding $80 million. This surge is unprecedented for a Solana memecoin without a centralized exchange (CEX) listing, making it a phenomenon worth exploring.
Technical Analysis
The chart for $DEGENAI reveals a bullish symmetrical triangle pattern, a classic indicator of potential upward momentum. The token recently broke through the resistance trendline, signaling a strong continuation of its bullish trend. With the Relative Strength Index (RSI) at 67, $DEGENAI is not yet in overbought territory, leaving room for further upward movement.
Key levels to watch include:
- Support Zones: A minor support level at the 38.2% Fibonacci retracement level and a major support zone at the 61.8% Fibonacci level, which traders might consider a buy zone in case of a correction.
- Price Target: We are eyeing $0.50 as a potential target, particularly with anticipation of a CEX listing.
Project Overview
Degen Spartan AI is an innovative AI agent trained on the tweets and knowledge graph of the former crypto influencer Degen Spartan. By leveraging the cutting-edge ai16z/eliza stack, this project stands out as a pioneer in the burgeoning AI-agent space.
Unprecedented Market Performance
Degen Spartan AI’s market activity has been extraordinary:
- Daily Trading Volume: $16.7 million in the last 24 hours, a 318.30% increase, showcasing heightened interest.
- All-Time High: Recently reached $0.09359, just 7.97% below its current price.
- All-Time Low: A staggering 2,791.76% increase from its low of $0.002979 recorded in November 2024.
Community and Market Sentiment
Despite lacking listings on major CEXs like Binance, KuCoin, or Bybit, $DEGENAI has cultivated a robust community. Its trading volume on Raydium and Jupiter underscores the power of decentralized platforms. The anticipation of a CEX listing could propel the token’s price further, as traders and investors position themselves for potential gains.
Conclusion
Degen Spartan AI exemplifies the fusion of AI technology with the memecoin phenomenon. Its technical indicators and market fundamentals point to a promising trajectory. While risks like corrections remain, its support levels and community-driven momentum provide a solid foundation for continued growth. For those seeking innovation in the crypto space, $DEGENAI is a compelling prospect.

$DEGEN is gearing up for its next move!$DEGEN is currently sitting on a strong support with a double-bottom formation, testing its 4-hour demand zone after a long decline.
A break of .010 resistance could hit its swing point at .014, in confluence with m_rvwap
I think it's a good idea to keep the $DEGEN chart on your radar to see the overall meme sentiment on Base
I am inclined to think that we might be nearing the bottom in terms of both price and sentiment.
It's evident that the focus is now shifting towards the Virtuals ecosystem, reminiscent of the vibe in Q1 2024.


Degen $degen #degen In the bigger picture like on HTF as in 1-day charts i think we are still grinding down and dealing with distribution/consolidation after this big move up last week.
I think we might even go back down and retest the $0.0143 levels over the next several days or even as much as couple weeks.
However, in the more near term like on a 4hr. time frame i think it looks like it might want to flush some shorts and go back up and retest some of these levels marked out up above.
This could give great near-term opportunity to make some $ with clear current invalidation levels/SL etc.
I think IMO that all of the top coins with community on the Base system will end up really shining at some point by the end of this cycle and if this is one that you are wanting to be in. Then this IMO is also a great place to begin to DCA into a spot long and HOPE for these dips I speak of to load up more.
Remember that may not even happen and that we could end up with Eth running NOW/before you know it and this will be the LOW you want.

DEGEN Price Soars on Binance Announcement: What’s Next? Exciting news for DEGEN investors! On Friday, Binance announced the futures listing for $DEGEN, resulting in an impressive 43% price surge. But what does this mean for the future of the token? Let’s dive in.
Key Highlights
- Binance Futures Listing: Binance, a leading crypto exchange, revealed it would list a DEGENUSDT (USD-Margined) perpetual contract. This allows users to trade the asset with up to 75x leverage, significantly boosting potential gains.
- Enhanced Trading Features: Binance will support Multi-Assets Mode for DEGEN, providing traders with more flexibility and improved risk management. A capped funding rate at +2.00% / -2.00% was announced, but changes could occur based on market conditions.
- Market Reaction: Following the announcement, DEGEN’s trading volume skyrocketed over 100%. This bullish momentum, combined with investor interest, suggests potential for further gains.
DEGEN’s Impressive Rally
As of now, $DEGEN has surged 46%, trading at $0.02981. The token’s intraday trading volume reached $411.77 million, marking a 137% increase. This upward trend corresponds with the Binance announcement, indicating strong market confidence.
Moreover, the token's futures open interest (OI) rose 43% to $37.58 million, while derivatives volume saw a 153% boost to $125.94 million. This data highlights a growing investor interest in DEGEN.
Technical Outlook
Currently, $DEGEN is up 10%, trading within a consolidating zone of $0.028. It’s attempting to overcome a bearish reversal to break past previous highs. The RSI is stable at 54, and there’s immediate support at $0.025. A breach below this could trigger a bearish trend.
However, with the positive performance of BTC and similar assets, $DEGEN might break past its recent highs.
What’s Next?
Will DEGEN continue its upward trajectory, or will market corrections slow it down? As always, investors should stay informed and make decisions based on comprehensive analysis.
Stay tuned for more updates as the market evolves!

DEGEN TO ALL TIME HIGH!I think degen is now on the wave 3 move the wave 2 is shallow so expect the wave 4 to be sharp on correction, we can adjust the count if the pump exceed to the given fibonacci level.

DEGEN Flat correctionWave 3 has finished, and we are now in a complex correction phase for Wave 4. There's a chance that a flat correction could develop, meaning the market may consolidate before the next big move.
To support this correction we have also identified a bearish divergence.

RATSUSDT.P
Hello dear friends,
Another degen SHORT is coming your way! This time, it’s 1000RATS on the 30-minute timeframe. This one is extra degen due to the volatility of this meme coin.
Two things on the chart make me bearish: first, the price is at resistance, and second, there's a bearish divergence in volume.
This is not financial advice by any means! Stay safe, and keep that SL tight!

SOLUSDT.P
Hello friends,
Here’s the next degen SHORT in this series! We have SOL, one of the giants of crypto. We’re looking at two oscillators, RSI and CMF, both of which are bearish on the 30-minute timeframe. That’s why I'm shorting SOL—but, of course, this is not financial advice in any way!
Stay safe, and keep that SL tight!

BTCUSDT.P
I'm trying to short the king of crypto, BTC. This is more of a degen trade, so proceed with caution! Momentum and RSI are losing ground, which could be bearish. Keep in mind that both are momentum oscillators, so they behave similarly.
Keep that SL tight and stay safe. This is not financial advice in any form.
Stay safe!

DOGEUSDT.P
We are looking at DOGE on the 30-minute timeframe. Yesterday's short was liquidated as the stop-loss (SL) got hit. Today, we're trying again on the 30-minute timeframe with a tighter SL. At the moment, the price is below the 20 EMA, but that's the only bearish signal. This is more of a revenge trade, so exercise caution, and of course, this is not financial advice!
See you later, and stay safe!

DOGEUSDT.P
Hello, dear traders! Hope you’re doing well this Monday.
I’m watching DOGE on the 1H time frame because it’s best showing the bearish divergence between price and volume from the previous high to the current high. Volume is missing on this pump, creating a strong bearish divergence. In my opinion, the price is likely to fall.
Stay safe and stay tuned for updated information!
