#DEGO/USDT – Bullish Breakout Setup | 1H Chart Analys#DEGO
The price is moving in a descending channel on the 1-hour timeframe. It has reached the lower boundary and is heading towards breaking above it, with a retest of the upper boundary expected.
We have a downtrend on the RSI indicator, which has reached near the lower boundary, and an upward rebound is expected.
There is a key support zone in green at 0.1250. The price has bounced from this zone multiple times and is expected to bounce again.
We have a trend towards consolidation above the 100-period moving average, as we are moving close to it, which supports the upward movement.
Entry price: 0.1265
First target: 0.1285
Second target: 0.13100
Third target: 0.13471
Don't forget a simple principle: money management.
Place your stop-loss order below the support zone in green.
For any questions, please leave a comment.
Thank you.
Degofinance

#DEGO/USDT – Bullish Breakout Setup | 1H Chart Analys#DEGO
The price is moving in a descending channel on the 1-hour timeframe. It has reached the lower boundary and is heading towards a breakout, with a retest of the upper boundary expected.
We are seeing a bearish bias in the Relative Strength Index (RSI), which has reached near the lower boundary, and an upward bounce is expected.
There is a key support zone in green at 0.480, and the price has bounced from this level several times. Another bounce is expected.
We are seeing a trend towards stabilizing above the 100-period moving average, which we are approaching, supporting the upward trend.
Entry Price: 0.484
First Target: 0.491
Second Target: 0.499
Third Target: 0.509
Remember a simple principle: Money Management.
Place your stop-loss order below the green support zone.
For any questions, please leave a comment.
Thank you.

#DEGO/USDT – Bullish Breakout Setup | 1H Chart Analys#DEGO
The price is moving in a descending channel on the 1-hour timeframe. It has reached the lower boundary and is heading towards breaking above it, with a retest of the upper boundary expected.
We have a downtrend on the RSI indicator, which has reached near the lower boundary, and an upward rebound is expected.
There is a key support zone in green at 0.515. The price has bounced from this zone multiple times and is expected to bounce again.
We have a trend towards consolidation above the 100-period moving average, as we are moving close to it, which supports the upward movement.
Entry price: 0.515
First target: 0.527
Second target: 0.536
Third target: 0.548
Don't forget a simple principle: money management.
Place your stop-loss below the green support zone.
For any questions, please leave a comment.
Thank you.

#DEGO/USDT – Bullish Breakout Setup | 1H Chart Analys#DEGO
The price is moving in a descending channel on the 1-hour timeframe. It has reached the lower boundary and is heading towards breaking above it, with a retest of the upper boundary expected.
We have a downtrend on the RSI indicator, which has reached near the lower boundary, and an upward rebound is expected.
There is a key support zone in green at 0.440. The price has bounced from this zone multiple times and is expected to bounce again.
We have a trend towards consolidation above the 100-period moving average, as we are moving close to it, which supports the upward movement.
Entry price: 0.477
First target: 0.455
Second target: 0.464
Third target: 0.478
Don't forget a simple principle: money management.
Place your stop-loss order below the green support zone.
For any questions, please leave a comment.
Thank you.

#DEGO/USDT – Bullish Breakout Setup | 1H Chart Analys#DEGO
The price is moving in a descending channel on the 1-hour timeframe. It has reached the lower boundary and is heading towards breaking above it, with a retest of the upper boundary expected.
We have a downtrend on the RSI indicator, which has reached near the lower boundary, and an upward rebound is expected.
There is a key support zone in green at 0.455. The price has bounced from this zone multiple times and is expected to bounce again.
We have a trend towards stability above the 100-period moving average, as we are moving close to it, which supports the upward movement.
Entry price: 0.464
First target: 0.470
Second target: 0.478
Third target: 0.489
Don't forget a simple principle: money management.
Place your stop-loss order below the support zone in green.
For any questions, please leave a comment.
Thank you.

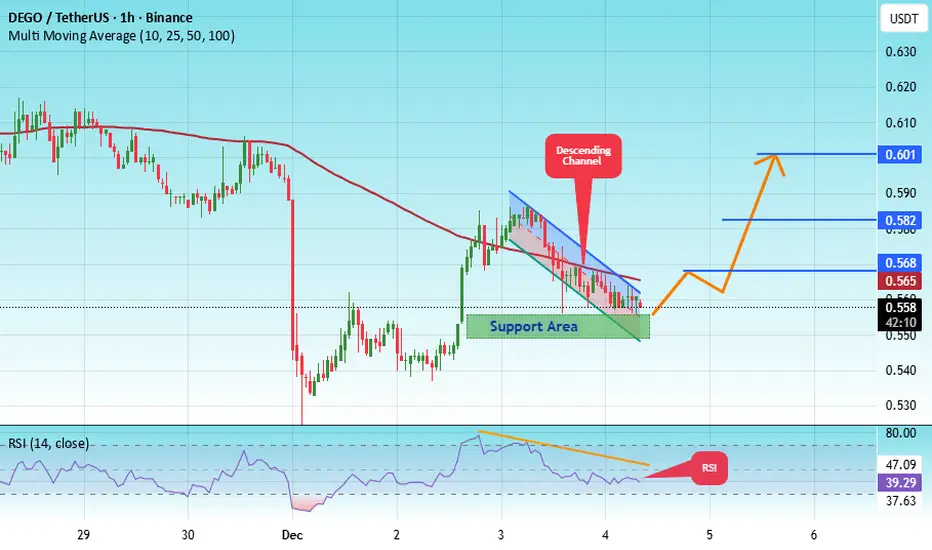
#DEGO/USDT – Bullish Breakout Setup | 1H Chart Analys#DEGO
The price is moving in a descending channel on the 1-hour timeframe. It has reached the lower boundary and is heading towards breaking above it, with a retest of the upper boundary expected.
We have a downtrend on the RSI indicator, which has reached near the lower boundary, and an upward rebound is expected.
There is a key support zone in green at 0.550. The price has bounced from this zone multiple times and is expected to bounce again.
We have a trend towards stability above the 100-period moving average, as we are moving close to it, which supports the upward movement.
Entry price: 0.558
First target: 0.568
Second target: 0.582
Third target: 0.601
Don't forget a simple principle: money management.
Place your stop-loss below the support zone in green.
For any questions, please leave a comment.
Thank you.
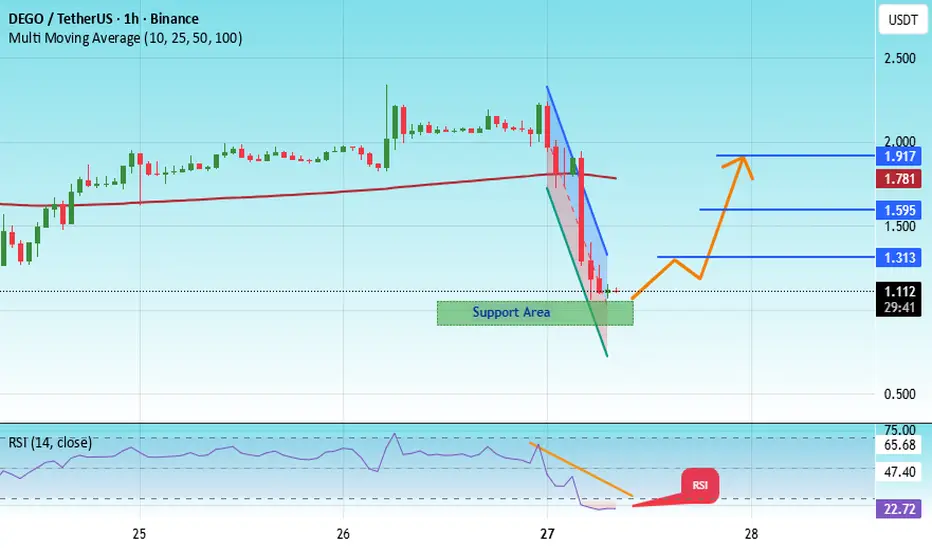
#DEGO/USDT Forming Bullish Wave#DEGO
The price is moving within an ascending channel on the 1-hour timeframe and is adhering to it well. It is poised to break out strongly and retest the channel.
We have a downtrend line on the RSI indicator that is about to break and retest, which supports the upward move.
There is a key support zone in green at the price of 0.618, representing a strong support point.
We have a trend of consolidation above the 100-period moving average.
Entry price: 0.645
First target: 0.657
Second target: 0.680
Third target: 0.705
Don't forget a simple money management rule:
Place your stop-loss order below the green support zone.
Once the first target is reached, save some money and then change your stop-loss order to an entry order.
For any questions, please leave a comment.
Thank you.
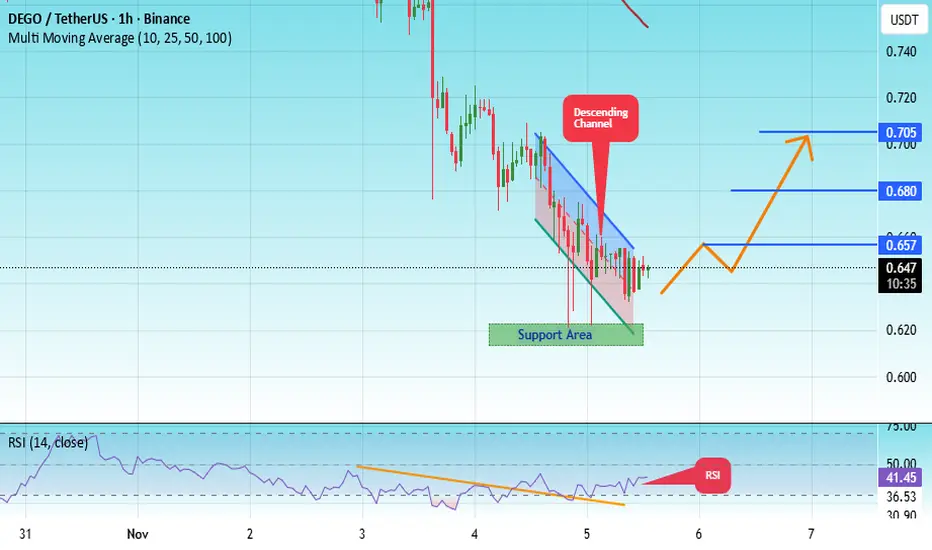
#DEGO/USDT Forming Bullish Wave#DEGO
The price is moving in an ascending channel on the 1-hour frame, adhering well to it, and heading for a strong breakout and retest.
We have a bearish trend on the RSI indicator that is about to be broken and retested, which supports the upward breakout.
There is a major support area in green at 0.985, representing a strong support point.
We are heading for consolidation above the 100 moving average.
Entry price: 1.12.
First target: 1.313.
Second target: 1.595.
Third target: 1.917.
Don't forget a simple matter: capital management.
When you reach the first target, save some money and then change your stop-loss order to an entry order.
For inquiries, please leave a comment.
Thank you.
#DEGO/USDT Forming Bullish Wave
#DEGO
The price is moving within a descending channel on the 1-hour frame, adhering well to it, and heading for a strong breakout and retest.
We have a bearish trend on the RSI indicator that is about to be broken and retested, which supports the upward breakout.
There is a major support area in green at 1.030, representing a strong support point.
We are heading for consolidation above the 100 moving average.
Entry price: 1.10.
First target: 1.137.
Second target: 1.18.
Third target: 1.240.
Don't forget a simple matter: capital management.
When you reach the first target, save some money and then change your stop-loss order to an entry order.
For inquiries, please leave a comment.
Thank you.
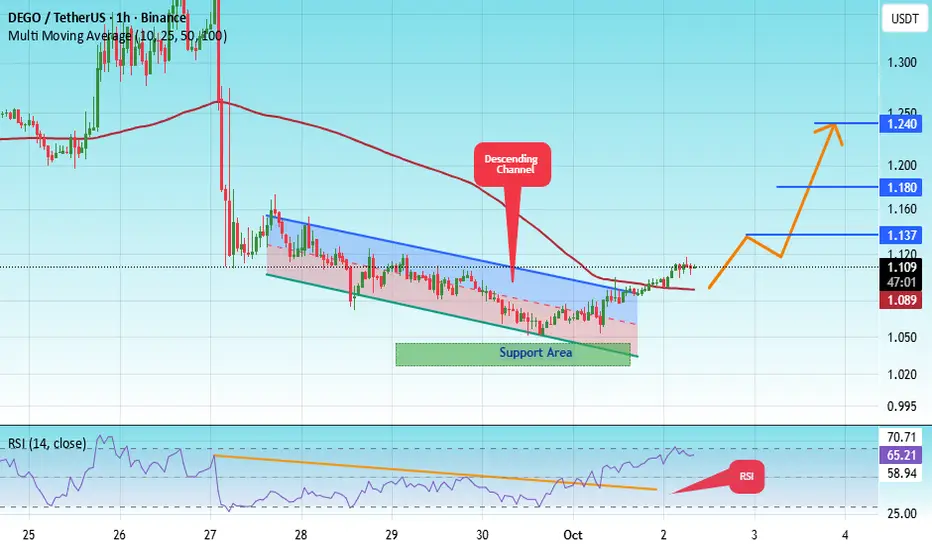
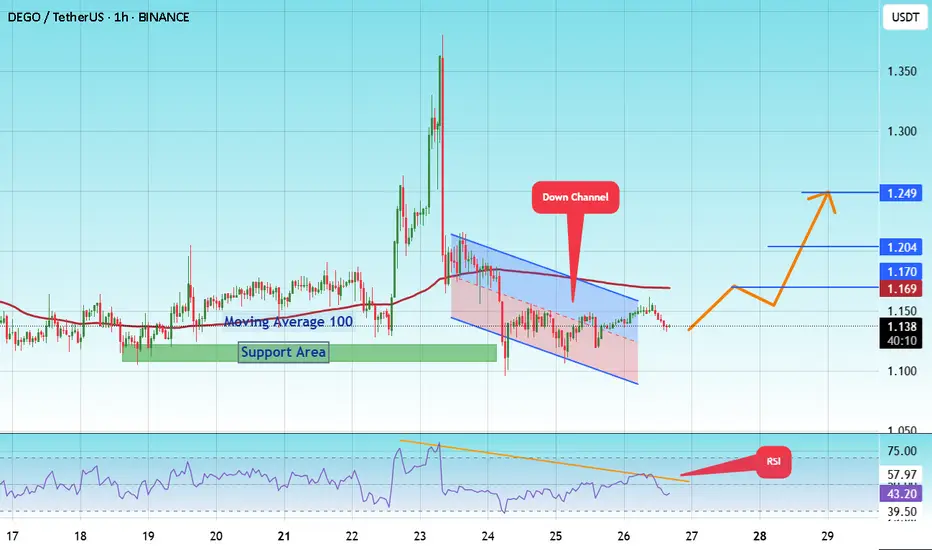
#DEGO/USDT Forming Bullish Wave#DEGO
The price is moving within a descending channel on the 1-hour frame and is expected to break and continue upward.
We have a trend to stabilize above the 100 moving average once again.
We have a downtrend on the RSI indicator that supports the upward break.
We have a support area at the lower boundary of the channel at 1.10, acting as strong support from which the price can rebound.
We have a major support area in green that pushed the price higher at 1.10.
Entry price: 1.13
First target: 1.17
Second target: 1.20
Third target: 1.25
To manage risk, don't forget stop loss and capital management.
When you reach the first target, save some profits and then change the stop order to an entry order.
For inquiries, please comment.
Thank you.
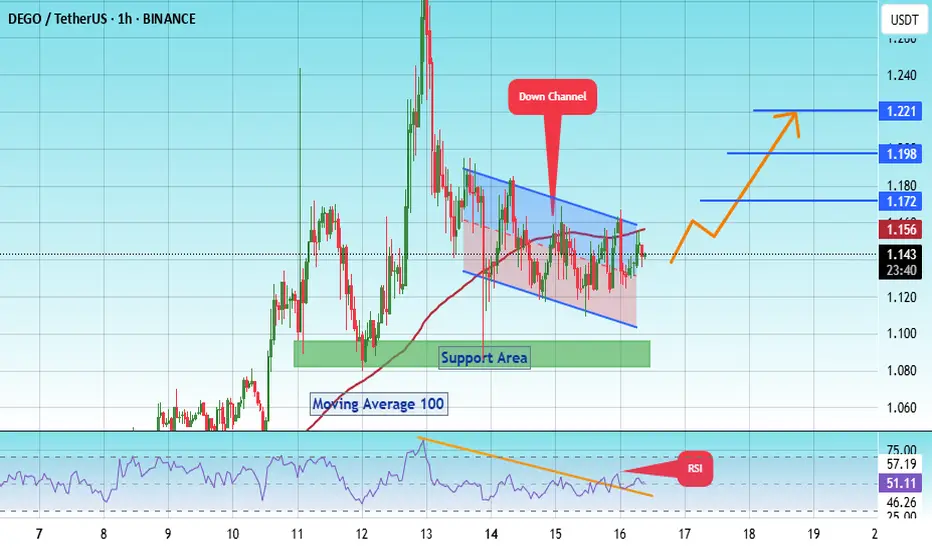
#DEGO/USDT – Bullish Breakout Setup | 1H Chart Analys#DEGO
The price is moving within a descending channel on the 1-hour frame, adhering well to it, and is heading for a strong breakout and retest.
We are experiencing a bounce from the lower boundary of the descending channel. This support is at 1.10.
We have a downtrend on the RSI indicator that is about to be broken and retested, supporting the upside.
There is a major support area in green at 1.08, which represents a strong basis for the upside.
Don't forget a simple thing: ease and capital.
When you reach the first target, save some money and then change your stop-loss order to an entry order.
For inquiries, please leave a comment.
We are in a consolidation trend above the 100 Moving Average.
Entry price: 1.14.
First target: 1.17.
Second target: 1.20.
Third target: 1.22.
Don't forget a simple thing: ease and capital.
When you reach the first target, save some money and then change your stop-loss order to an entry order.
For inquiries, please leave a comment.
Thank you.
#DEGO/USDT#DEGO
The price is moving within a descending channel on the 1-hour frame, adhering well to it, and is heading toward a strong breakout and retest.
We are experiencing a rebound from the lower boundary of the descending channel, which is support at 1.23.
We are experiencing a downtrend on the RSI indicator that is about to break and retest, supporting the upward trend.
We are heading toward stability above the 100 Moving Average.
Entry price: 1.24
First target: 1.25
Second target: 1.26
Third target: 1.80

#DEGO/USDT#DEGO
The price is moving within a descending channel on the 1-hour frame, adhering well to it, and is heading towards a strong breakout and retest.
We are experiencing a rebound from the lower boundary of the descending channel, which is support at 1.04.
We are experiencing a downtrend on the RSI indicator that is about to be broken and retested, supporting the upward trend.
We are heading for stability above the 100 Moving Average.
Entry price: 1.050
First target: 1.076
Second target: 1.097
Third target: 1.12

#DEGO/USDT#DEGO
The price is moving within a descending channel on the 1-hour frame and is expected to break and continue upward.
We have a trend to stabilize above the 100 moving average once again.
We have a downtrend on the RSI indicator that supports the upward move with a breakout.
We have a support area at the lower boundary of the channel at 1.94, which acts as strong support from which the price can rebound.
Entry price: 1.98
First target: 2.02
Second target: 2.07
Third target: 2.13

#DEGO/USDT#DEGO
The price is moving within a descending channel on the 1-hour frame, adhering well to it, and is heading for a strong breakout and retest.
We are experiencing a rebound from the lower boundary of the descending channel, which is support at 1.76.
We are experiencing a downtrend on the RSI indicator that is about to be broken and retested, supporting the upward trend.
We are looking for stability above the 100 Moving Average.
Entry price: 1.79
First target: 1.83
Second target: 1.92
Third target: 2.02

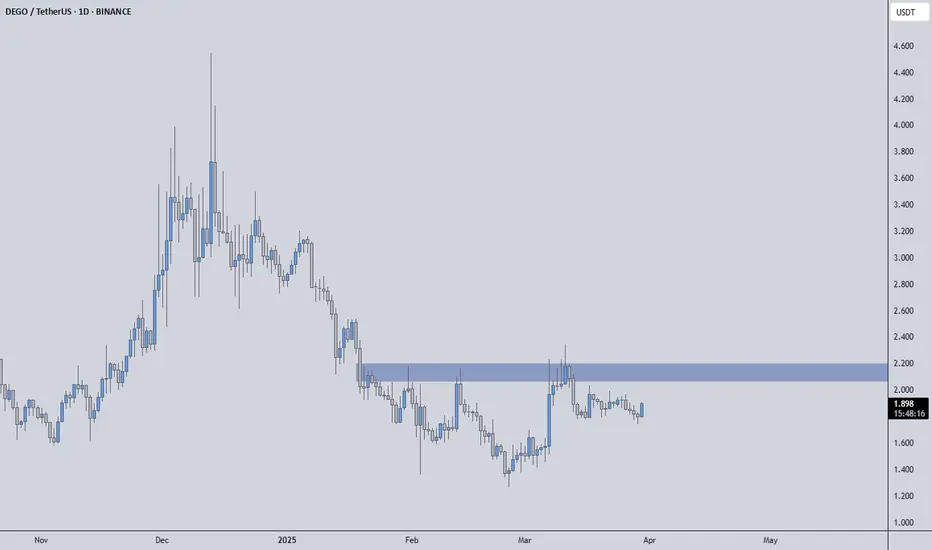
Dego Finance New 2025 All-Time High Confirmed (4,400% PP)The volume gives it away, truly. Dego-finance produced the highest volume ever in March 2025, even higher than in early 2021 before the major bull market rise. A rise that ended with more than 7,000% total gains.
Highest volume ever and long-term higher lows. It seems DEGOUSDT is getting ready for a new All-Time High in the coming months. This pair and chart seen pretty strong.
Let's skip the TA because this one is just too say. Since it is too easy and fully confirmed, let's map the potential ATH price.
» Two targets: $55 (~2,700% Profits Potential) and $89 (~4,400% PP). Pick one.
Namaste.

DEGOUSDT 1DDEGO ~ 1D Analysis
#DEGO This trade is very high risk. Buy when successfully penetrating this resistant line with a short -term target of at least 10%+.

DEGOUSDT - HUGE VOLUME SPIKE NOW WHAT TO DO!Alright, let's sprinkle in some charm and make this analysis even more engaging! 😄
Alright, buckle up traders, because we're about to dissect DEGOUSDT and map out a potential path to profits. 💰 Forget the noise; we're focusing on precision and probabilities, guided by cold, hard data and a disciplined approach. I've identified a key area on the DEGOUSDT chart, marked by the blue box you see there. 🟦 This isn't just some arbitrary zone; it represents a potential resistance level, an area where sellers might step in and halt any upward momentum. 🤔
Now, let's be crystal clear. Simply seeing a blue box isn't a signal to blindly short. 🙅♀️ This is where the art and science of trading intertwine, and where your disciplined approach, informed by my analysis, will set you apart from the herd. The key here is patience, a virtue often overlooked but absolutely essential for consistently profitable trading. 🧘♀️
We need to see how the price action reacts when it approaches this blue zone. Are we seeing an increase in volume as the price tests this level? 📈 Is the Cumulative Delta Volume (CDV) confirming that sellers are indeed stepping in and pushing the price back down? 🐻 These are the critical clues we need to validate our short idea. Don't jump the gun! Trading without confirmation is a dangerous game, a gamble where the odds are stacked against you. 🎲 Let the market tell you what it wants to do, and then react accordingly. 👂
But remember, the market is a dynamic beast, constantly evolving. 🌍 That’s why I have a core principle, a bedrock belief that anchors my trading: "I will not insist on my short idea. If the levels suddenly break upwards and do not give a downward break in the low time frame, I will not evaluate it. If they break upwards with volume and give a retest, I will look long." This isn't just a rule; it's a mindset, a commitment to adapting to the market's signals rather than clinging to a preconceived notion. 🧠
Therefore, pay attention to the lower time frames (LTF). This is where the real magic happens. ✨ If the price breaks above the blue box with significant volume and then retests it, turning what was once resistance into support, we have a completely different scenario. 🐂 We'd then be looking for long opportunities, capitalizing on the newfound bullish momentum. The retest is the critical confirmation. It shows that buyers are willing to defend this level, solidifying its new role as support. 💪
Listen closely. 👂 Ignoring these confirmations and simply hoping your initial bias is correct is a recipe for disaster. 😩 You need a clear plan, a set of rules, and the discipline to execute them flawlessly. That’s what I strive to provide with every analysis, but you need to follow me closely to see it through. 👀 This isn't about getting lucky; it's about consistently applying a proven methodology to identify high-probability trading setups. 🎯
The market doesn't care about your opinions or your hopes and dreams. It only responds to price action, volume, and liquidity. Master these elements, and you'll master the market. 👑 Fail to do so, and you'll become just another statistic. 💔 So, stay tuned, stay patient, and let's navigate these treacherous waters together. 🤝 By following my guidance, you'll gain the edge you need to thrive in this competitive arena. Don't be left behind while others are profiting. This is your chance to elevate your trading game. Don't miss out!
📌I keep my charts clean and simple because I believe clarity leads to better decisions.
📌My approach is built on years of experience and a solid track record. I don’t claim to know it all but I’m confident in my ability to spot high-probability setups.
📌If you would like to learn how to use the heatmap, cumulative volume delta and volume footprint techniques that I use below to determine very accurate demand regions, you can send me a private message. I help anyone who wants it completely free of charge.
🔑I have a long list of my proven technique below:
🎯 ZENUSDT.P: Patience & Profitability | %230 Reaction from the Sniper Entry
🐶 DOGEUSDT.P: Next Move
🎨 RENDERUSDT.P: Opportunity of the Month
💎 ETHUSDT.P: Where to Retrace
🟢 BNBUSDT.P: Potential Surge
📊 BTC Dominance: Reaction Zone
🌊 WAVESUSDT.P: Demand Zone Potential
🟣 UNIUSDT.P: Long-Term Trade
🔵 XRPUSDT.P: Entry Zones
🔗 LINKUSDT.P: Follow The River
📈 BTCUSDT.P: Two Key Demand Zones
🟩 POLUSDT: Bullish Momentum
🌟 PENDLEUSDT.P: Where Opportunity Meets Precision
🔥 BTCUSDT.P: Liquidation of Highly Leveraged Longs
🌊 SOLUSDT.P: SOL's Dip - Your Opportunity
🐸 1000PEPEUSDT.P: Prime Bounce Zone Unlocked
🚀 ETHUSDT.P: Set to Explode - Don't Miss This Game Changer
🤖 IQUSDT: Smart Plan
⚡️ PONDUSDT: A Trade Not Taken Is Better Than a Losing One
💼 STMXUSDT: 2 Buying Areas
🐢 TURBOUSDT: Buy Zones and Buyer Presence
🌍 ICPUSDT.P: Massive Upside Potential | Check the Trade Update For Seeing Results
🟠 IDEXUSDT: Spot Buy Area | %26 Profit if You Trade with MSB
📌 USUALUSDT: Buyers Are Active + %70 Profit in Total
🌟 FORTHUSDT: Sniper Entry +%26 Reaction
🐳 QKCUSDT: Sniper Entry +%57 Reaction
📊 BTC.D: Retest of Key Area Highly Likely
📊 XNOUSDT %80 Reaction with a Simple Blue Box!
📊 BELUSDT Amazing %120 Reaction!
I stopped adding to the list because it's kinda tiring to add 5-10 charts in every move but you can check my profile and see that it goes on..
#DEGO/USDT#DEGO
The price is moving in a descending channel on the 1-hour frame and is adhering to it well and is heading to break it upwards strongly and retest it
We have a bounce from the lower limit of the descending channel, this support is at a price of 1.75
We have a downtrend on the RSI indicator that is about to break and retest, which supports the rise
We have a trend to stabilize above the moving average 100
Entry price 1.86
First target 1.90
Second target 2.00
Third target 2.10

#DEGO/USDT#DEGO
The price is moving in a descending channel on the 1-hour frame and is expected to continue upwards
We have a trend to stabilize above the moving average 100 again
We have a descending trend on the RSI indicator that supports the rise by breaking it upwards
We have a support area at the lower limit of the channel at a price of 2.10
Entry price 2.28
First target 2.47
Second target 2.65
Third target 2.85

DEGOUSDT IDEABINANCE:DEGOUSDT
DEGO USDT 1Day timeframe clearly a falling wedge, I can see some targets that i can share,
2.6
3.3
3.8
4.2
NOT A FINANCIAL ADVISE DYOR ALSO!

#DEGO/USDT#DEGO
The price is moving in a downward channel on a 4-hour frame and is adhering to it well, and the price has rebounded from the green zone. It is expected after the correction.
After rebounding from a significant decline, the downside gap is expected to be filled
We have a tendency to stabilize above the Moving Average 100
We have a downtrend on the RSI indicator that is expected to break higher to support the rise
Entry price is 2.20
The first goal is 2.54
Second goal 2.76
Third goal 3.00

#DEGO/USDT#DEGO
The price is moving in a head and shoulders pattern on a 4-hour frame, and the right shoulder has been completed
We have a strong upward trend in the RSI indicator, and the price sticks to the price
It is expected to rise at 3 levels. Entry price: 3.79
First goal 3.84
Second goal 4.09
The third goal is 4.32
the stop below the right shoulder
