DELL Price Action ⁞ Bullish TMA Structure Offering Clean Entries🎯 DELL Technologies: The "Gentleman Thief" Swing Trade Setup 💼🔓
📊 Market Overview
💰 DELL Technologies Inc. (NYSE: DELL)
Current Price: $138.91
📈52-Week Range: $66.25 - $168.08
Market Cap: $93.10B
Analyst Rating: Strong Buy (18 analysts recommend buying)
Average Price Target: $163.30
🎭 The "Gentleman Thief" Trade Plan
Welcome to the most sophisticated heist in tech stocks! 🎩💼 We're going after DELL with the precision of a master strategist and the charm of a smooth operator. This isn't just a trade—it's an art form.
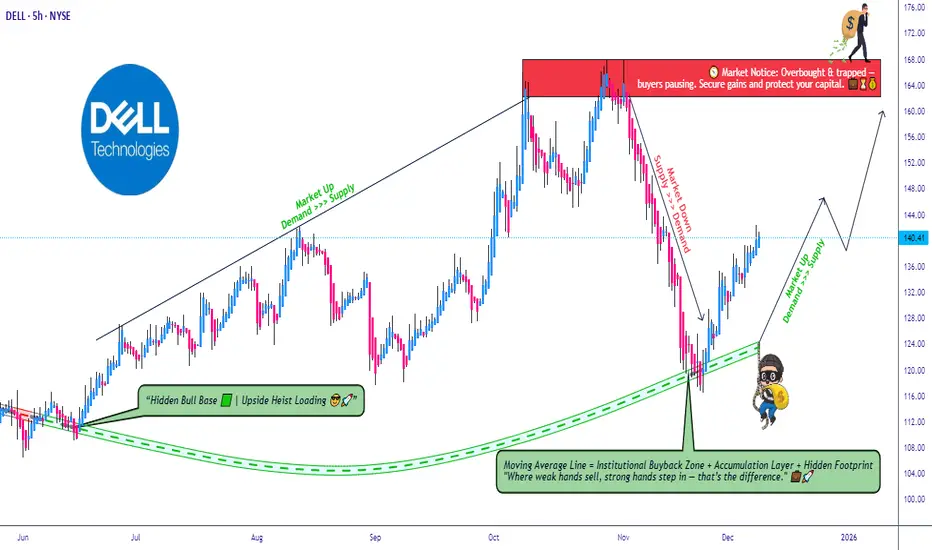
📐 Technical Setup: Triangular Moving Average Pullback ✅
The bulls have confirmed their presence! 🐂 DELL is showing a classic triangular moving average pullback pattern, which historically signals strong upward momentum continuation. We're looking at a textbook setup where price consolidation meets buyer accumulation.
Key Technical Indicators:
✅ Bullish trend confirmation
✅ TMA crossover bullish
✅ Volume accumulation zone active
✅ Support level respected at $135-$138 zone
💼 The "Layering Strategy" Entry Method
This is where we separate the amateurs from the professionals! 🎯 Instead of going all-in at one price (rookie mistake!), we're deploying a multi-layer limit order strategy—think of it as spreading your net wide to catch the best fish.
🎯 Entry Zones (Pick Your Poison):
🥷 Option 1: The Aggressive Thief Approach
Layer 1: $120.00 (Deep value zone - if we get lucky) 💎
Layer 2: $125.00 (Sweet accumulation level) 🍬
Layer 3: $130.00 (Support retest zone) 🛡️
Layer 4: $135.00 (Current structure support) 📊
🎩 Option 2: The Current Price Entry
Jump in at any price between $138-$141 if you believe the momentum is too strong to wait! Sometimes the train leaves the station and you gotta hop on! 🚂
Pro Tip: Scale into your position! Don't blow your entire load at once. Add 25% of your position at each layer, or customize based on your risk appetite and account size.
🛑 Stop Loss: The Emergency Exit
Thief Stop Loss @ $115.00 🚨
⚠️ IMPORTANT DISCLAIMER: Listen up, Thief OG's! 👂 This is MY stop loss based on MY risk tolerance. You're the captain of your own ship! 🚢 Set your stop loss based on YOUR own risk management rules. Maybe you're more conservative (SL @ $125), or maybe you're riding or dying (SL @ $110). Your money, your rules! Just don't be reckless—protect your capital like it's the crown jewels! 👑
Risk Management Math:
Entry Range: $120-$135
Stop Loss: $115
Max Risk per Layer: $5-$20/share depending on entry
Always risk only 1-2% of your total capital per trade!
🎯 Take Profit Target: The Grand Escape
Police Station Alert @ $165.00 🚔🚨
Alright, here's the deal—the "police force" (resistance level) is waiting for us at $165! This is where:
🔴 Strong resistance zone meets overbought conditions
📊 Historical rejection level (check the chart!)
💰 Profit-taking zone where smart money exits
⚠️ Trap territory where FOMO buyers get caught
Exit Strategy Options:
The Clean Exit: Sell 100% at $165 and walk away clean 🎩
The Scaling Exit: Take 50% off at $155, 30% at $165, let 20% ride with trailing stop
The Greedy Approach: Move stop to breakeven at $155, let it run to $170+ (risky!)
⚠️ ANOTHER DISCLAIMER: This is MY target, not a crystal ball prediction! 🔮 You might want to take profits earlier ($150, $155, $160) or hold longer. The market doesn't care about our plans—it does what it wants! Be flexible, be smart, and take money when you MAKE money! 💵
📊 Related Pairs to Watch (Correlation Analysis)
Smart traders don't trade in a vacuum! 🧠 Here are the key tickers that move with or against DELL:
💻 Direct Competitors & Sector Plays:
NYSE:HPE (Hewlett Packard Enterprise) - Direct infrastructure competitor, 85% correlation 🔄
NYSE:HPQ (HP Inc.) - PC market competitor, 70% correlation
NASDAQ:SMCI (Super Micro Computer) - AI server play, 80% correlation 🤖
NASDAQ:NTAP (NetApp) - Storage solutions, 75% correlation
🔥 AI Infrastructure Ecosystem:
NASDAQ:NVDA (NVIDIA) - GPU supplier, 65% correlation—when NVDA pumps, DELL follows! 🚀
NASDAQ:AVGO (Broadcom) - Networking chips, 60% correlation
NASDAQ:CSCO (Cisco Systems) - Networking infrastructure, 70% correlation
📈 Market Sentiment Indicators:
NASDAQ:QQQ (Nasdaq ETF) - Tech sector health, 75% correlation
AMEX:XLK (Technology Sector SPDR) - Broader tech sentiment, 80% correlation
NASDAQ:SOXX (Semiconductor ETF) - Chip sector strength indicator
Key Insight: If NASDAQ:NVDA is rallying on AI demand and NASDAQ:QQQ is showing strength, DELL typically follows with a 1-2 day lag. Use these for confirmation! ✅
🧠 Why This Trade Makes Sense (Fundamental Backup)
Don't just trade the chart—understand the story! 📖
🤖 AI Infrastructure Boom: DELL's AI server backlog hit a record $18.4 billion Morningstar, signaling massive enterprise demand
💰 Strong Financials: Revenue growth of 11% year-over-year, with non-GAAP diluted EPS up 17% Morningstar
🎯 Analyst Confidence: Average 12-month price target of $163.30, with high estimate at $200 Investing.com
📊 Technical Confluence: Support levels holding + bullish moving averages + increasing volume
🏢 Recent Catalyst: Michael Dell's recent high-profile donation demonstrates leadership confidence
⚙️ Trade Execution Checklist ✅
Before you hit that buy button, make sure:
You've sized your position correctly (max 5-10% of portfolio)
You've set your layered limit orders
You've placed your stop loss order
You've marked your take-profit levels
You've checked NASDAQ:NVDA and NASDAQ:QQQ for confirmation
You're emotionally prepared to stick to your plan
You've accepted that this is a SWING TRADE (hold time: 2-8 weeks) ⏰
🎬 The Bottom Line
This DELL trade is a high-probability setup combining:
✅ Strong technical pattern (TMA pullback)
✅ Solid fundamentals (AI server demand)
✅ Favorable risk/reward (1:2+ ratio)
✅ Multiple entry opportunities (layering strategy)
✅ Clear exit plan (no guessing games!)
Remember: The market is a patient wealth transfer from the impatient to the patient. We're playing chess while others play checkers! ♟️
🎭 Final Word from Your Favorite Trading Thief
Look, I'm not your financial advisor, I'm not FINRA-approved, and I'm definitely not responsible for your trades! 🤷♂️ This is the "Thief Style Trading Strategy"—a tongue-in-cheek approach to swing trading that emphasizes layered entries and disciplined exits. It's educational, it's entertaining, but it's NOT personalized financial advice!
Trade smart, not hard. Protect your capital, respect the market, and always have an exit plan! 🎯
✨ If you find value in my analysis, a 👍 and 🚀 boost is much appreciated — it helps me share more setups with the community!
⚖️ Legal Disclaimer & Risk Warning
🚨 READ THIS CAREFULLY:
This analysis is for educational and entertainment purposes only. The "Thief Style Trading Strategy" is a playful nickname for a legitimate technical trading approach, NOT an endorsement of illegal activity!
Risk Disclosure:
📉 Stock trading involves substantial risk of loss
💸 Past performance does not guarantee future results
🎲 You can lose more than your initial investment
🧠 This is NOT personalized financial advice
👨⚖️ Consult a licensed financial advisor before making investment decisions
📊 All price targets and technical analysis are subjective opinions
⚠️ I am not a registered financial advisor or broker-dealer
By reading this analysis, you acknowledge that:
You are solely responsible for your trading decisions
You understand the risks involved in stock trading
You will not hold the author liable for any losses
You will do your own due diligence before investing
Trade responsibly. Never invest money you can't afford to lose. Always use proper position sizing and risk management!
#DELL #DellTechnologies #NYSE #SwingTrading #TechnicalAnalysis #StockMarket #TradingSetup #AIStocks #TechStocks #BullishSetup #MovingAverages #LayeringStrategy #RiskManagement #TradingEducation #StockTrading #MarketAnalysis #InfrastructurePlays #ChipStocks #TechSector #ThiefStyle #TradingCommunity #StockTips #DayTrading #InvestSmart #FinancialFreedom
🎩 Happy Trading, Thief OG's! May your stops be tight and your profits be massive! 💰🚀
Dell
Top winners in the stock marketRecently, the shares of Marvell Technology Inc (#Marvel), Dell Technologies Inc (#Dell), Uber Technologies Inc (#Uber), Coinbase Global Inc (#Coinbase) , and Palantir Technologies Inc (#Palantir) have risen amid increasing demand for products essential to artificial intelligence — chips, servers, and software.
Key triggers:
1. Strong industry news: companies producing chips and servers reported results above expectations and signaled further growth.
2. Uber’s launch of robotaxi services.
3. A surge in crypto activity at the end of November.
Five Growth Drivers :
#Marvel (+21.2%) — a surge following earnings and the acquisition of Celestial AI (developer of optical solutions for AI) for ~$3.25 billion, paired with an optimistic outlook for next year.
#Dell (+12.9%) — raised its guidance thanks to soaring demand for AI servers and a record number of confirmed orders.
#Uber (+8.5%) — shares gained after the launch of robotaxi services in Dallas in partnership with Avride, signaling a new stage of autonomous ride scaling.
#Coinbase (+7.1%) — a rebound in late November driven by increased crypto volatility and trading volumes (Coinbase profits from trading activity).
#Palantir (+7.2%) — supported by a strong Q4 outlook and continued demand for its AI platform; enthusiasm in the AI sector fueled additional momentum.
Strong fundamental drivers for #Marvel / #Dell (AI infrastructure) and #Palantir (contracts + commercial AI) create solid ground for the trend to continue. #Uber gains fresh momentum from robotaxi expansion, and #Coinbase stands to benefit further if elevated crypto activity and higher trading volumes persist.
FreshForex analysts see continued growth potential for #Marvel, #Dell, #Uber, #Coinbase, and #Palantir , supported by rising demand for AI solutions and digital infrastructure.
As long as no concrete industry issues arise (such as delays or cancellations of major AI-hardware orders, or chip supply disruptions), these stocks retain strong upward prospects.

Dell Remains Bullish, Expands AI Reach With New D&H PartnershipDell Technologies continues to strengthen its position in the accelerating enterprise AI cycle, supported by new distribution partnerships and major AI-infrastructure contracts. Last week, D&H Canada announced a new agreement authorizing it to distribute Dell’s endpoint devices and PowerEdge servers, while also giving partners access to Dell’s professional services for digital-transformation projects.
While this partnership broadens Dell’s channel reach, the deeper story remains the company’s rapidly expanding AI-server footprint. Demand for Dell’s AI-optimized infrastructure continues to outpace supply, contributing to a growing order backlog and reinforcing the company’s emerging leadership in enterprise AI deployment. The standout catalyst is Dell’s newly secured US$5.8 billion AI server contract, a deal that directly addresses near-term revenue visibility and signals sustained institutional demand.
However, to be a Dell shareholder today, investors must accept that AI growth needs to compensate for ongoing softness in traditional server and PC segments. The rapid expansion in AI-infrastructure orders can temporarily compress margins, especially as Dell scales production and delivery. Still, these pressures are likely cyclical rather than structural, with higher-value enterprise solutions expected to re-expand margins over time.
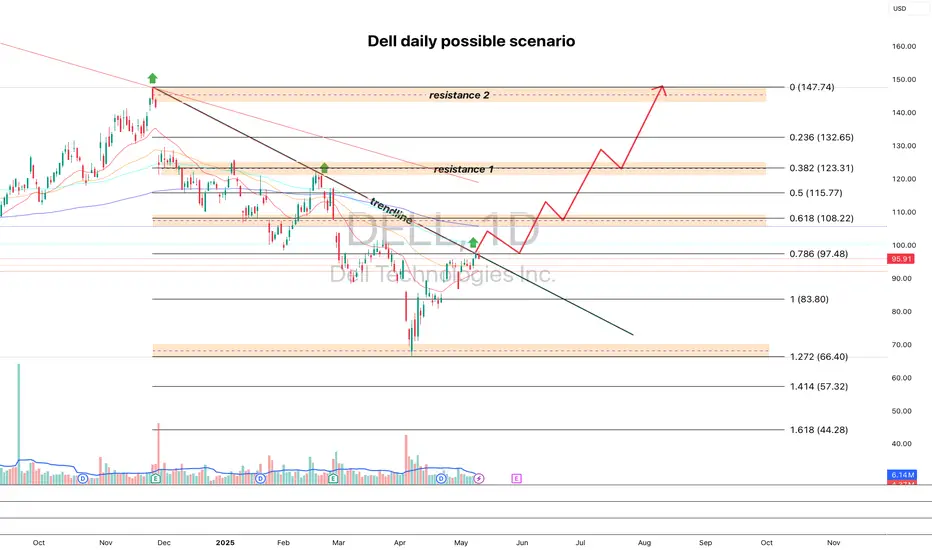
Technical Outlook
The chart shows Dell pulling back sharply from the $168 zone and retesting a long-term ascending trendline — a key technical support level that has historically triggered strong rebounds. Price is now hovering around the $134 region, aligning with the dotted trendline that has supported multi-quarter rallies.
If this level holds, DELL could set up a bullish reversal back toward the $168 recent high and beyond, with a broader extension to $180+ over the next cycle. A breakdown, however, exposes the stock to lower support zones.
Overall, Dell remains one of the most leveraged large-cap plays on enterprise AI infrastructure, with strong catalysts and constructive long-term technicals.

DELL - Inverted H&S An example of an inverted H&S pattern on the daily timeframe for DELL
As we are approaching the end of the right shoulder (a bullish phase), I expect price to continue up
I expect this scenario over resistance at the green line that price is currently testing.

DELL | Multi-Timeframe Expansion SetupThe Market Flow | Oct 23, 2025
Technical Overview
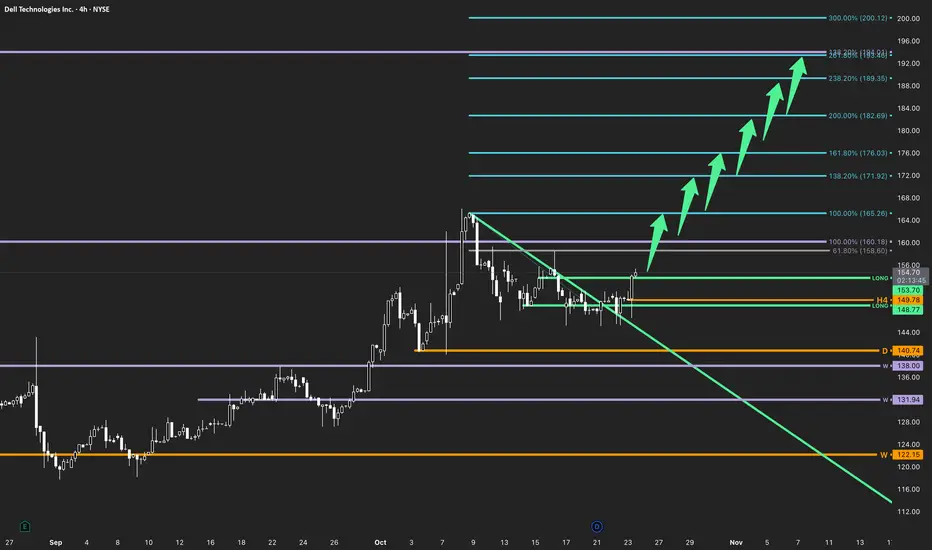
Weekly: Structure remains bullish, with price holding above the active pivot at 138.00 . Weekly Fibonacci 138.2% extension aligns with the medium-term upside path toward 192.84 .
Daily: The daily countertrend originating from the recent weekly high has been broken, confirming early structural reversal within a corrective phase. Momentum is shifting back into alignment with the higher timeframe trend.
H4: Countertrend break above descending structure and trigger zone at 153.70 establishes the start of a new expansion phase. Clean Fibonacci projection targets stand at 165.26 , 171.92 , 176.03 , 182.69 , 189.35 , and 193.46 .
Trade Structure & Levels
• Bias: Long above 140.74 (active Daily pivot)
• Trigger = 153.70 (H4 breakout)
• Primary Invalidation = 149.78 (H4 pivot)
• Secondary Invalidation = 140.74 (Daily pivot)
• Path → 165.26 → 171.92 → 176.03 → 182.69 → 189.35 → 193.46
• Phase: Countertrend Break → Early Expansion
Risk & Event Context
• Next earnings report due early December.
• Broader tech sector resilience may support momentum continuation into Q4.
• Watch volatility around 160.00–165.00 where overlapping Fibonacci zones may cause short-term pauses.
Conclusion
All active timeframes confirm bullish alignment, with a confirmed countertrend break on H4 signaling early expansion. Maintaining above the daily pivot at 140.74 sustains the long bias toward higher Fibonacci extensions.
Disclaimer
This analysis is for informational purposes only and does not constitute investment advice, an offer, or a recommendation. Market conditions and price behavior may change without notice. Past performance is not indicative of future results. Always conduct your own research or consult a licensed financial advisor before making investment decisions.
DELL | New All Time Highs Incoming | LONGDell Technologies, Inc. is a technology company, providing customers with a broad and innovative solution portfolio to help customers modernize their information technology (IT) infrastructure, address workforce transformation, and offer critical solutions that keep people and organizations connected. It operates through the following segments: Infrastructure Solutions Group (ISG) and Client Solutions Group (CSG). The ISG segment includes servers, networking, and storage, as well as services and third-party software and peripherals that are closely tied to the sale of ISG hardware. The CSG segment includes designs for commercial and consumer customers of desktops, thin client products, and notebooks. The company was founded by Michael Saul Dell in 1984 and is headquartered in Round Rock, TX.

Dell Stock Idea – Bullish Outlook With Layered Entries💰 Dell Technologies INC: The Great Stock Market Heist Plan (Swing/Day Trade) 💰
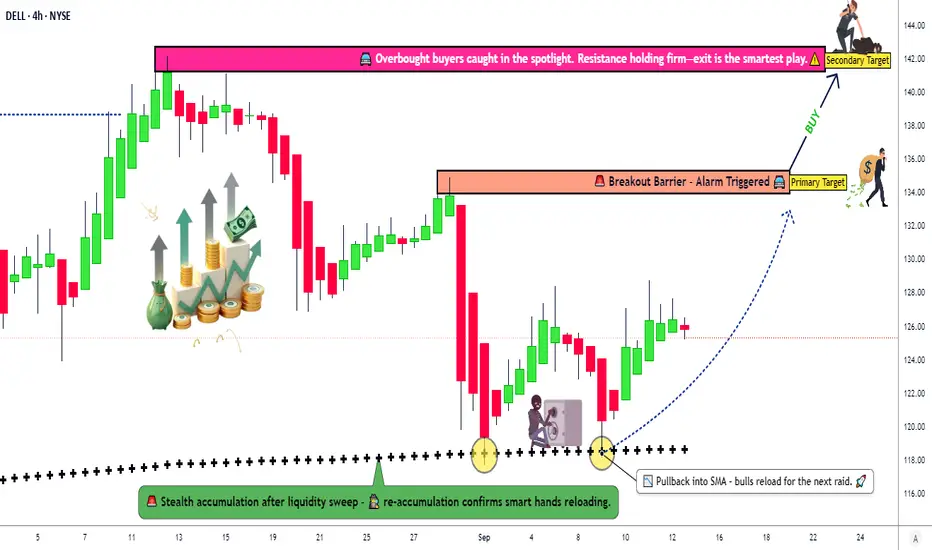
🎯 Asset: Dell Technologies INC (DELL)🎭 Vibe: Bullish Bandits on the Move! The Simple Moving Average (SMA) is flashing green, confirming a buy trend, and the big institutional players are piling in. Time to join the heist with the market's heavy hitters! 🚀
📜 The Heist Plan: Bullish Breakout with a Thief’s Flair
🔍 Why DELL?The SMA is screaming "BUY," and institutional buyers are sneaking in like pros. We’re tailing the big players with a slick Thief Layering Strategy to maximize our loot. Here’s how we execute this caper:
Entry: 🕵️♂️ Thief Layering StrategyDeploy multiple buy limit orders to stack the deck in your favor:
🎯 $120.00
🎯 $122.00
🎯 $124.00
🎯 $126.00
Pro Tip: Add more layers based on your risk appetite and market conditions. Be the sneakiest thief in the game! 😎
Stop Loss (SL): 🚨 $118.00Set this SL after the breakout at the mentioned price levels to protect your stash. Dear Ladies & Gentlemen (Thief OGs), adjust your SL based on your strategy and risk tolerance. This isn’t a one-size-fits-all heist—own your escape plan! 🏃♂️
Targets: 🤑 Police Barricade Ahead!Watch out for strong resistance and overbought zones where traps lurk. Escape with your profits at:
Primary Target: $134.00
Secondary Target: $142.00Note: Dear Thief OGs, these are suggested targets. Grab your loot when it feels right—your heist, your rules! 💸
⚠️ Thief’s Code of Honor
Dear Ladies & Gentlemen (Thief OGs), I’m not here to dictate your SL or TP. This is your heist—make your moves and take your profits at your own risk. Stay sharp, stay safe, and don’t get caught! 😜
🔗 Related Pairs to Watch
To make this heist even smoother, keep an eye on these correlated assets (all in USD):
HP Inc. ( NYSE:HPQ ): Moves in tandem with DELL as a tech hardware peer. If HPQ is pumping, it’s a good sign for DELL’s bullish run.
NVIDIA ( NASDAQ:NVDA ): Tech giant with strong correlation to DELL due to AI and data center trends.
NVDA’s strength could fuel DELL’s breakout.
S&P 500 Index ( AMEX:SPY ): DELL often rides the broader market wave. If SPY is bullish, it’s a tailwind for our heist.
Key Correlation Insight: DELL’s performance is tied to tech sector momentum and institutional buying in AI/data center stocks. Watch NVDA and HPQ for confirmation of DELL’s bullish trend, and keep SPY on your radar for market sentiment.
🛠️ Why This Setup Works
✅ Technical Confirmation: The SMA signals a clear bullish trend, giving us the green light.
✅ Institutional Backup: Big players are entering, so we’re riding their coattails.
✅ Layered Entries: Multiple limit orders reduce risk and increase flexibility.
✅ Defined Escape Plan: Clear SL and TP levels keep us ahead of the market’s “police.”
📝 Disclaimer
This is just a fun vibe and not financial advice! Trading is risky, and you should always do your own research and consult with a professional before making any moves. Stay sharp, Thief OGs! 😎
✨ If you find value in my analysis, a 👍 and 🚀 boost is much appreciated — it helps me share more setups with the community!
#TradingView #DELL #StockMarket #SwingTrading #DayTrading #Bullish #ThiefStrategy #TechnicalAnalysis
DELL looks good for pump dailyI'm watching DELL for a breakout of the trendline and a cross above the 100 MA — targeting a move toward 108.22, followed by a retest of the breakout and further upside targets at 123.31 and 147.74.
Fundamentally, the company looks strong, and the next earnings report is expected on May 29.
If you like the analysis, hit that rocket 🚀
DELL Stock Price Analysis Ahead of Earnings ReleaseDELL Stock Price Analysis Ahead of Earnings Release
In addition to Nvidia’s (NVDA) quarterly report, this week financial market participants are also closely watching Dell Technologies’ (DELL) earnings release, scheduled for Thursday, 29 May, after the close of the trading session.
According to analysts cited by the media:
→ the company’s revenue is expected to come in at $23.18 billion (compared to $22.24 billion in the same period last year, and $23.9 billion in the previous quarter);
→ particular attention will be paid to Dell’s business segment focused on manufacturing servers for AI applications.
Notably, DELL’s price chart shares several similarities with the NVDA chart we analysed yesterday.
Technical Analysis of DELL’s Share Price
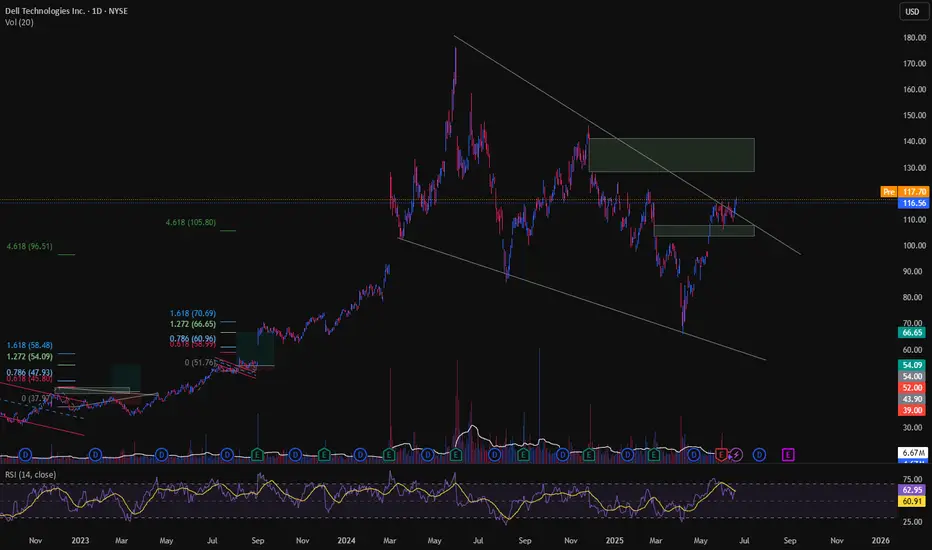
Price movements have formed a downward channel (shown in red) that has remained valid since 2024. In a broader context, it resembles a bullish flag pattern, which typically signals the potential continuation of an uptrend — a scenario that seems increasingly likely given the following:
→ the DELL’s price is currently near the upper boundary of the channel;
→ the May price rally suggests strong demand for DELL shares. Note the confident breakout above the psychologically significant $100 level (highlighted by the arrow), accompanied by a bullish gap and a series of rising candlesticks.
It is possible that the upcoming earnings report will act as a catalyst, enabling the bulls to gather momentum and attempt a breakout from the prevailing downward channel.
This article represents the opinion of the Companies operating under the FXOpen brand only. It is not to be construed as an offer, solicitation, or recommendation with respect to products and services provided by the Companies operating under the FXOpen brand, nor is it to be considered financial advice.

DELL Technologies Options Ahead of EarningsIf you haven`t bought the recent dip:
Now analyzing the options chain and the chart patterns of DELL Technologies prior to the earnings report this week,
I would consider purchasing the 110usd strike price Puts with
an expiration date of 2025-9-19,
for a premium of approximately $8.90.
If these options prove to be profitable prior to the earnings release, I would sell at least half of them.
I`m bullish long term on DELL though.
Disclosure: I am part of Trade Nation's Influencer program and receive a monthly fee for using their TradingView charts in my analysis.

Dell Technologies (NYSE: $DELL) Stock Gains on Tariff ReliefDell Technologies Inc. (NYSE: NYSE:DELL ) rose sharply on Monday following the Trump administration’s temporary suspension of tariffs on smartphones, computers, and other electronics. The updated guidance from U.S. Customs and Border Protection late Friday excluded these items from the latest round of reciprocal tariffs, which had raised concerns among tech manufacturers.
Dell shares gained 4%, closing at $85.19, up $3.26 on the day, with a trading volume of 12.35 million shares. The stock had opened at $89.29 and reached a low of $84.01 during the session. The tariff pause, though potentially temporary, has eased pressure on companies that heavily rely on global supply chains. Dell, which produces most of its hardware outside the United States, stands to benefit significantly from the exemption.
JPMorgan analysts commented that the exemption highlights the strategic importance of electronics to American consumers and the economic weight of companies like Dell and Apple. While Apple is accelerating its manufacturing diversification into countries like India and Vietnam, Dell continues to leverage international production capacity to maintain its competitiveness.
Technical Analysis
From a technical perspective, DELL is currently trading within a descending channel that started from its all-time high of $179.70. The recent bounce from a support zone indicates potential short-term support. The price action suggests two likely scenarios: a continued climb toward the upper boundary of the channel near $110, or a pullback to test lower levels around $42, aligned with the bottom of the channel.
The 200-day moving average (86.18) and 100-day (116.72)currently sit above the price, indicating a bearish medium-term trend. However, if DELL holds support around $85.11 and gains momentum, it could challenge the mid-channel resistance and eventually attempt a breakout.

DELL: Expecting Strong Forecasts for 2025Key arguments supporting the idea
Attractive Multiples and Technical Outlook
Growth Across All Business Segments
Dell Rapidly Expanding Market Share in AI Server Segment
Dell Technologies develops, manufactures, and sells a wide range of integrated solutions, products, and services. The company operates through two segments: Infrastructure Solutions Group (ISG) and Client Solutions Group (CSG). The ISG segment provides solutions for customers’ digital transformation, including artificial intelligence (AI), machine learning, data analytics, as well as modern and traditional data storage. The CSG segment offers branded personal computers, including laptops, desktops, workstations, and peripherals such as monitors, keyboards, and webcams.
Investment Thesis
Positive Technical Outlook and Low Multiples. After releasing financial results for Q3 FY2025, Dell’s stock entered a correction phase, reaching three-month lows. However, the stock subsequently resumed an upward trajectory. Currently, the RSI technical indicator remains below the overbought zone, signaling further upside potential. Dell’s market multiples appear highly attractive. The forward P/E ratio of 14 is slightly above the company’s historical levels but remains significantly lower than the sector average (24) and the S&P 500 index (23). The forward P/S ratio of 0.8 is considerably below the sector average (3.28), reinforcing the view that Dell is currently undervalued.
2025 Expected to Mark the Start of a New PC Upgrade Cycle. Following the COVID-19-driven surge in PC sales, many of these devices are reaching the end of their typical 3-4 year lifecycle. Despite initial analyst expectations for significant market growth, real growth in 2024 was just 1% YoY. According to updated IDC forecasts, 2025 is expected to be the year of PC market recovery. Key growth drivers include: massive device aging from previous years’ purchases, end of support for Windows 10 in October 2025 and increased demand for AI-integrated computers IDC projects 4.3% PC market growth in 2025, which should positively impact Dell’s largest segment – CSG.
AI Infrastructure to be the Strongest Growth Driver for ISG. Dell maintains a leading position in data center supply, alongside HP and SMCI, making it a key player in AI training infrastructure. For the first nine months of FY2025, Dell’s revenue from servers and networking equipment (part of ISG) grew 60% YoY. According to Bloomberg’s consensus, ISG revenue is expected to grow by 30% YoY in FY2025 and by another 15% in FY2026. This growth is driven by rising demand for AI servers, fueled by NVIDIA GB200 chip shipments and U.S. government AI support programs. An additional growth factor could be the shift of market share from SMCI to Dell due to suspicions of SMCI violating U.S. sanctions, which erodes customer trust and encourages migration to a more stable partner.
We maintain a Buy rating on DELL stock with a price target of $135. A stop-loss order is recommended at $90.

Bullish swing on DELL?🔉Sound on!🔉
📣Make sure to watch fullscreen!📣
Thank you as always for watching my videos. I hope that you learned something very educational! Please feel free to like, share, and comment on this post. Remember only risk what you are willing to lose. Trading is very risky but it can change your life!

Dell Stock Under Pressure as AI Costs Weigh on MarginsShares of Dell Technologies (NYSE:DELL) slipped in premarket trading following the company’s latest earnings report, which signaled potential margin compression in its fiscal 2026 outlook. The decline comes despite robust AI server growth projections, highlighting a complex landscape of opportunities and challenges for the tech giant.
Margin Compression and Tariff Uncertainty Weigh on Sentiment
Dell's financial outlook raised investor concerns as the company forecasted a 100 basis-point decline in adjusted gross margins for fiscal year 2026. This pressure stems largely from rising costs associated with AI server expansion and soft PC demand, which continues to be a headwind.
AI Growth Provides a Silver Lining
Despite the margin headwinds, Dell remains a major player in the AI infrastructure space, forecasting an impressive 53% year-over-year surge in AI server shipments to $15 billion.
Earnings Beat But Revenue Miss
For the fourth quarter, Dell reported:
- Adjusted EPS of $2.68, exceeding estimates of $2.53 per share.
- Revenue of $23.93 billion, slightly below the expected $24.56 billion.
- Forecasted Q1 adjusted EPS of $1.65, below analyst estimates of $1.83.
- Projected revenue between $22.5 billion and $23.5 billion, missing expectations of $23.72 billion.
- Full-year 2026 adjusted EPS expected to be $9.30**, slightly above consensus at $9.29.
Technical Outlook
NYSE:DELL stock closed down 6.26% in Thursday’s session and extended losses in Friday’s premarket trading, currently down 2.23%. The Relative Strength Index (RSI) sits at 41.16, reflecting a weak technical setup.
If the post-earnings sentiment worsens, Dell’s 1-month low could serve as a critical support pivot. Conversely, a break above the 38.2% Fibonacci retracement level could signal a bullish reversal, paving the way for a potential rebound.

$DELL call verticalI think NYSE:DELL is in the bottom area, and I don't think the market
will tank before Christmas.
NYSE:DELL will rebound.
Bought Dec. 20th $124/$130 call vertical for $2.5.
The profit will be 140% is the stock is above $130 by expiration.
Let's see!

DELL - Large Double TopA clear Double Top on this Weekly timeframe, a good time to sell into the bearish movement.
I expect price to move down towards the upward trend line in green and recover from there.
Bearish

DELL a chart earnings **Technical Analysis of Dell Technologies Inc. (DELL) - Daily Chart**
**Overview:**
The daily chart of Dell Technologies Inc. (DELL) reveals several key technical insights that can guide potential trading strategies.
**Trend Analysis:**
1. **Uptrend:** The stock has been following a well-defined uptrend since early 2023, marked by higher highs and higher lows. This trend is represented by a series of ascending trend lines.
2. **Trendline Break:** Recently, the stock has broken above another trendline, indicating a potential acceleration in the uptrend. This breakout suggests strong bullish momentum.
**Support and Resistance Levels:**
1. **Support Levels:**
- **$138.35:** This level has acted as a support zone where the stock has previously found a base before moving higher.
- **$63.34:** Another significant support level, which was tested and held in mid-2024.
- **$26.55:** A longer-term support level from a previous consolidation phase.
2. **Resistance Levels:**
- **$193.37:** This is the current resistance level where the stock has faced selling pressure.
- **$169.31:** An intermediate resistance level that the stock may test before a potential breakout.
**Volume Analysis:**
- **Volume Spike:** There was a noticeable increase in volume during the recent price movements, particularly around the breakout levels. This volume surge confirms the strength of the current trend.
**Technical Indicators:**
1. **RSI (Relative Strength Index):** The RSI is currently near the top of its range, indicating that the stock might be overbought in the short term. This could suggest a potential pullback or consolidation before further upward movement.
2. **ECE Pattern:** The chart shows a series of ECE (Earnings Call Effect) labels, which might indicate that the stock experiences volatility around earnings announcements. Traders should be aware of these events for potential trading opportunities or risks.
**Key Observations:**
- The stock has shown resilience by holding above key support levels and breaking through resistance levels, indicating strong buying interest.
- The breakout above the trendline and resistance levels, coupled with increased volume, suggests a continuation of the uptrend.
**Trading Strategy:**
- **Long Position:** Consider entering a long position if the stock successfully breaks above $193.37 with strong volume. Set a stop loss below the recent support level at $169.31 to manage risk.
- **Short Position:** If the stock shows signs of overbought conditions (RSI nearing or above 70) and fails to break $193.37, a short position could be considered with a stop loss above this level.
**Conclusion:**
Dell Technologies Inc. (DELL) is currently in a strong uptrend with recent breakouts confirming bullish momentum. However, traders should monitor the RSI for potential overbought conditions and watch for volume patterns around key support and resistance levels. Always consider broader market conditions and news events that might impact stock performance.

Can a Tech Giant Redefine the Future of Enterprise Computing?In an era where technology companies rise and fall with stunning rapidity, Dell Technologies has orchestrated a remarkable transformation that challenges conventional wisdom about legacy tech companies. The company's strategic positioning in the hybrid cloud market, coupled with recent market disruptions affecting competitors like Super Micro Computer, has created an unprecedented opportunity for Dell to reshape the enterprise computing landscape.
Dell's masterful execution of its hybrid cloud strategy, particularly through its groundbreaking partnership with Nutanix, demonstrates the power of strategic evolution. The integration of PowerFlex software-defined storage and the introduction of the XC Plus appliance represent more than mere product innovations—they exemplify a deeper understanding of how enterprise computing needs are fundamentally changing. This transformation is particularly evident in regions like Saudi Arabia, where Dell's two-decade presence has evolved into a catalyst for technological advancement and digital transformation.
The financial markets have begun to recognize this shifting dynamic, as reflected in Dell's impressive 38% year-over-year growth in infrastructure solutions revenue. However, the true significance lies not in the numbers alone, but in what they represent: a traditional hardware company successfully pivoting to meet the complex demands of the AI era while maintaining its core strengths in enterprise computing. For investors and industry observers alike, Dell's journey presents a compelling case study in how established tech giants can not only survive but thrive in an era of rapid technological change.

Shorts Trapped Into Insider Selling | DELL I've been actively trading DELL with my private community members and I believe the company is gearing up for another positive run. Despite the news about Michael Dell selling more shares, which may have trapped some short-sellers, DELL is making strategic moves such as reducing costs, rejoining the S&P500, and aiming to capture market share from SMCI.
With this in mind, I see two potential entry points:
a. Enter the trade above $121.50, aiming for $127.
b. Enter the trade once it breaks $127, targeting $138.
Personally, I prefer the second option. DM me with any questions!

DELL strong bounce backLong anywhere here, the train started already.
Target 1 - 140
Target 2 - 149
Stop loss - 99

DELL 122.18 target On 24HR timeframe DELL breaks 116.00 Look for continuation to the upside. Targets 122.18 to 136.00!
110 breaks then more downside.

Dell Triumphant Return to the S&P 500: What’s Driving the Rally?Dell Technologies (NYSE: NYSE:DELL ) has made headlines with its upcoming re-inclusion in the S&P 500 Index, effective September 23. This marks a significant milestone for the tech giant, which was previously part of the S&P 500 from 1996 until 2013 before going private. The announcement has sent Dell’s stock price soaring, with shares jumping 6.1% in premarket trading on Monday. The re-entry into the S&P 500 is more than just symbolic; it represents renewed market confidence and a bright outlook for the company’s future.
Strong Market Position and Growth Drivers
Dell’s re-inclusion in the S&P 500 is not just about index rebalancing; it signals a broader positive trajectory fueled by several key factors. According to analysts at Citi Research, Dell’s fundamentals are strong, and the company is positioned to capitalize on multiple growth levers, making it a compelling buy.
1. Recovery in Enterprise Infrastructure Demand: Dell’s enterprise hardware products, including servers and storage solutions, are expected to benefit as businesses reinvest in critical infrastructure. After a period of constrained IT spending, Dell stands ready to capture significant market share as economic conditions improve.
2. PC Refresh Cycle: Dell is poised to gain from an upcoming global PC refresh cycle, expected to drive demand into 2025. As businesses and households upgrade aging PC systems, Dell’s personal computing segment is set to experience substantial sales growth. This cycle represents a critical growth driver for Dell’s core business.
3. AI Momentum: Dell’s focus on AI solutions positions it as a key player in the rapidly expanding AI market. As companies increasingly adopt AI workloads that require robust compute and storage resources, Dell’s expanding AI product portfolio could lead to significant revenue growth. The company’s expertise in providing the necessary hardware for AI applications aligns perfectly with emerging market needs.
4. Capital Returns and Valuation: Citi has set a target price of $160 for Dell, based on a 9.8x EV/EBITDA multiple applied to projected earnings over the next 24 months. This valuation reflects the company’s ability to execute and capitalize on growth opportunities. Compared to peers in the large enterprise hardware sector, Dell’s valuation strikes a balance that reflects both potential upside and inherent risks.
5. Challenges to Watch: While the outlook is positive, Dell faces challenges, including competition from hyperscalers and cloud computing solutions that pressure traditional enterprise hardware demand. The evolving landscape of cloud-enabled infrastructure and potential delays in the PC refresh cycle could impact Dell’s near-term growth prospects. Additionally, there is uncertainty around the pace at which Dell’s AI backlog will convert into tangible revenue.
Technical Outlook
Currently, Dell stock is up 4.48%, trading with a moderate Relative Strength Index (RSI) of 4.83%, which suggests room for further growth.
1. Bullish Flag Pattern: Dell’s daily price chart shows a bullish flag pattern, a continuation formation that signals a potential upward breakout. If the stock price reaches the $150 pivot point, it would confirm a bullish reversal, setting the stage for a sustained rally.
2. Support and Resistance Levels: Dell is trading just below its 200-day moving average, a key resistance level. A decisive break above this level would reinforce the bullish trend and attract further buying interest.
3. Volume and Momentum Indicators: Increased trading volume accompanying the recent price surge adds conviction to the bullish outlook. Momentum indicators suggest that Dell is on the cusp of a significant move higher, particularly with the backdrop of strong fundamentals and market sentiment.
Looking Ahead
Dell’s upcoming S&P 500 re-inclusion, combined with its strategic positioning in key growth areas, presents a compelling case for investors. The company’s ability to navigate the complexities of the evolving enterprise hardware market while capitalizing on the AI boom and PC upgrade cycle underpins its long-term growth potential.
While challenges remain, Dell’s re-entry into the S&P 500 is a testament to its resilience and strategic execution. With strong fundamentals, technical momentum, and multiple growth levers at play, Dell is well-positioned for continued success in the coming years. For investors, the current setup presents a unique opportunity to participate in the resurgence of a tech powerhouse.
