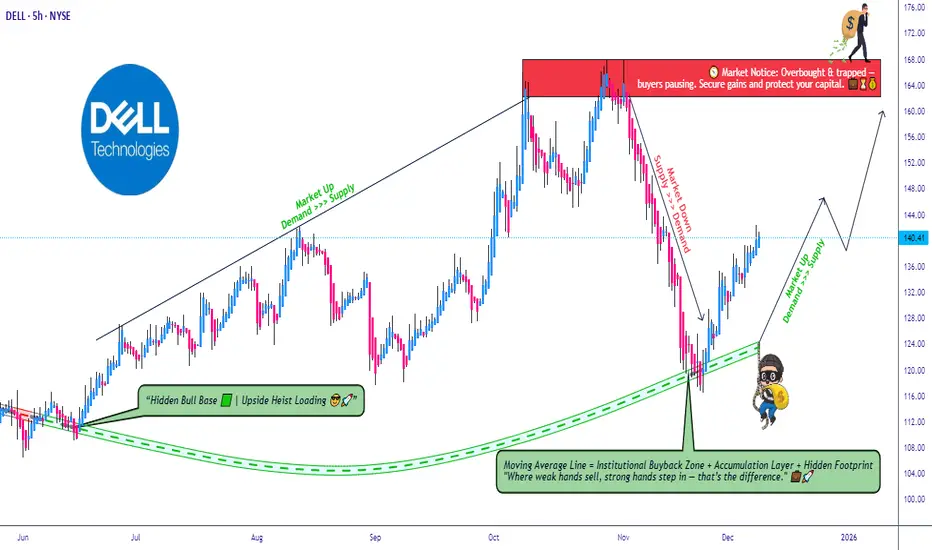
DELL Price Action ⁞ Bullish TMA Structure Offering Clean Entries🎯 DELL Technologies: The "Gentleman Thief" Swing Trade Setup 💼🔓
📊 Market Overview
💰 DELL Technologies Inc. (NYSE: DELL)
Current Price: $138.91
📈52-Week Range: $66.25 - $168.08
Market Cap: $93.10B
Analyst Rating: Strong Buy (18 analysts recommend buying)
Average Price Target: $163.30
🎭 The "Gentleman Thief" Trade Plan
Welcome to the most sophisticated heist in tech stocks! 🎩💼 We're going after DELL with the precision of a master strategist and the charm of a smooth operator. This isn't just a trade—it's an art form.
📐 Technical Setup: Triangular Moving Average Pullback ✅
The bulls have confirmed their presence! 🐂 DELL is showing a classic triangular moving average pullback pattern, which historically signals strong upward momentum continuation. We're looking at a textbook setup where price consolidation meets buyer accumulation.
Key Technical Indicators:
✅ Bullish trend confirmation
✅ TMA crossover bullish
✅ Volume accumulation zone active
✅ Support level respected at $135-$138 zone
💼 The "Layering Strategy" Entry Method
This is where we separate the amateurs from the professionals! 🎯 Instead of going all-in at one price (rookie mistake!), we're deploying a multi-layer limit order strategy—think of it as spreading your net wide to catch the best fish.
🎯 Entry Zones (Pick Your Poison):
🥷 Option 1: The Aggressive Thief Approach
Layer 1: $120.00 (Deep value zone - if we get lucky) 💎
Layer 2: $125.00 (Sweet accumulation level) 🍬
Layer 3: $130.00 (Support retest zone) 🛡️
Layer 4: $135.00 (Current structure support) 📊
🎩 Option 2: The Current Price Entry
Jump in at any price between $138-$141 if you believe the momentum is too strong to wait! Sometimes the train leaves the station and you gotta hop on! 🚂
Pro Tip: Scale into your position! Don't blow your entire load at once. Add 25% of your position at each layer, or customize based on your risk appetite and account size.
🛑 Stop Loss: The Emergency Exit
Thief Stop Loss @ $115.00 🚨
⚠️ IMPORTANT DISCLAIMER: Listen up, Thief OG's! 👂 This is MY stop loss based on MY risk tolerance. You're the captain of your own ship! 🚢 Set your stop loss based on YOUR own risk management rules. Maybe you're more conservative (SL @ $125), or maybe you're riding or dying (SL @ $110). Your money, your rules! Just don't be reckless—protect your capital like it's the crown jewels! 👑
Risk Management Math:
Entry Range: $120-$135
Stop Loss: $115
Max Risk per Layer: $5-$20/share depending on entry
Always risk only 1-2% of your total capital per trade!
🎯 Take Profit Target: The Grand Escape
Police Station Alert @ $165.00 🚔🚨
Alright, here's the deal—the "police force" (resistance level) is waiting for us at $165! This is where:
🔴 Strong resistance zone meets overbought conditions
📊 Historical rejection level (check the chart!)
💰 Profit-taking zone where smart money exits
⚠️ Trap territory where FOMO buyers get caught
Exit Strategy Options:
The Clean Exit: Sell 100% at $165 and walk away clean 🎩
The Scaling Exit: Take 50% off at $155, 30% at $165, let 20% ride with trailing stop
The Greedy Approach: Move stop to breakeven at $155, let it run to $170+ (risky!)
⚠️ ANOTHER DISCLAIMER: This is MY target, not a crystal ball prediction! 🔮 You might want to take profits earlier ($150, $155, $160) or hold longer. The market doesn't care about our plans—it does what it wants! Be flexible, be smart, and take money when you MAKE money! 💵
📊 Related Pairs to Watch (Correlation Analysis)
Smart traders don't trade in a vacuum! 🧠 Here are the key tickers that move with or against DELL:
💻 Direct Competitors & Sector Plays:
NYSE:HPE (Hewlett Packard Enterprise) - Direct infrastructure competitor, 85% correlation 🔄
NYSE:HPQ (HP Inc.) - PC market competitor, 70% correlation
NASDAQ:SMCI (Super Micro Computer) - AI server play, 80% correlation 🤖
NASDAQ:NTAP (NetApp) - Storage solutions, 75% correlation
🔥 AI Infrastructure Ecosystem:
NASDAQ:NVDA (NVIDIA) - GPU supplier, 65% correlation—when NVDA pumps, DELL follows! 🚀
NASDAQ:AVGO (Broadcom) - Networking chips, 60% correlation
NASDAQ:CSCO (Cisco Systems) - Networking infrastructure, 70% correlation
📈 Market Sentiment Indicators:
NASDAQ:QQQ (Nasdaq ETF) - Tech sector health, 75% correlation
AMEX:XLK (Technology Sector SPDR) - Broader tech sentiment, 80% correlation
NASDAQ:SOXX (Semiconductor ETF) - Chip sector strength indicator
Key Insight: If NASDAQ:NVDA is rallying on AI demand and NASDAQ:QQQ is showing strength, DELL typically follows with a 1-2 day lag. Use these for confirmation! ✅
🧠 Why This Trade Makes Sense (Fundamental Backup)
Don't just trade the chart—understand the story! 📖
🤖 AI Infrastructure Boom: DELL's AI server backlog hit a record $18.4 billion Morningstar, signaling massive enterprise demand
💰 Strong Financials: Revenue growth of 11% year-over-year, with non-GAAP diluted EPS up 17% Morningstar
🎯 Analyst Confidence: Average 12-month price target of $163.30, with high estimate at $200 Investing.com
📊 Technical Confluence: Support levels holding + bullish moving averages + increasing volume
🏢 Recent Catalyst: Michael Dell's recent high-profile donation demonstrates leadership confidence
⚙️ Trade Execution Checklist ✅
Before you hit that buy button, make sure:
You've sized your position correctly (max 5-10% of portfolio)
You've set your layered limit orders
You've placed your stop loss order
You've marked your take-profit levels
You've checked NASDAQ:NVDA and NASDAQ:QQQ for confirmation
You're emotionally prepared to stick to your plan
You've accepted that this is a SWING TRADE (hold time: 2-8 weeks) ⏰
🎬 The Bottom Line
This DELL trade is a high-probability setup combining:
✅ Strong technical pattern (TMA pullback)
✅ Solid fundamentals (AI server demand)
✅ Favorable risk/reward (1:2+ ratio)
✅ Multiple entry opportunities (layering strategy)
✅ Clear exit plan (no guessing games!)
Remember: The market is a patient wealth transfer from the impatient to the patient. We're playing chess while others play checkers! ♟️
🎭 Final Word from Your Favorite Trading Thief
Look, I'm not your financial advisor, I'm not FINRA-approved, and I'm definitely not responsible for your trades! 🤷♂️ This is the "Thief Style Trading Strategy"—a tongue-in-cheek approach to swing trading that emphasizes layered entries and disciplined exits. It's educational, it's entertaining, but it's NOT personalized financial advice!
Trade smart, not hard. Protect your capital, respect the market, and always have an exit plan! 🎯
✨ If you find value in my analysis, a 👍 and 🚀 boost is much appreciated — it helps me share more setups with the community!
⚖️ Legal Disclaimer & Risk Warning
🚨 READ THIS CAREFULLY:
This analysis is for educational and entertainment purposes only. The "Thief Style Trading Strategy" is a playful nickname for a legitimate technical trading approach, NOT an endorsement of illegal activity!
Risk Disclosure:
📉 Stock trading involves substantial risk of loss
💸 Past performance does not guarantee future results
🎲 You can lose more than your initial investment
🧠 This is NOT personalized financial advice
👨⚖️ Consult a licensed financial advisor before making investment decisions
📊 All price targets and technical analysis are subjective opinions
⚠️ I am not a registered financial advisor or broker-dealer
By reading this analysis, you acknowledge that:
You are solely responsible for your trading decisions
You understand the risks involved in stock trading
You will not hold the author liable for any losses
You will do your own due diligence before investing
Trade responsibly. Never invest money you can't afford to lose. Always use proper position sizing and risk management!
#DELL #DellTechnologies #NYSE #SwingTrading #TechnicalAnalysis #StockMarket #TradingSetup #AIStocks #TechStocks #BullishSetup #MovingAverages #LayeringStrategy #RiskManagement #TradingEducation #StockTrading #MarketAnalysis #InfrastructurePlays #ChipStocks #TechSector #ThiefStyle #TradingCommunity #StockTips #DayTrading #InvestSmart #FinancialFreedom
🎩 Happy Trading, Thief OG's! May your stops be tight and your profits be massive! 💰🚀
Dellanalysis
Dell Remains Bullish, Expands AI Reach With New D&H PartnershipDell Technologies continues to strengthen its position in the accelerating enterprise AI cycle, supported by new distribution partnerships and major AI-infrastructure contracts. Last week, D&H Canada announced a new agreement authorizing it to distribute Dell’s endpoint devices and PowerEdge servers, while also giving partners access to Dell’s professional services for digital-transformation projects.
While this partnership broadens Dell’s channel reach, the deeper story remains the company’s rapidly expanding AI-server footprint. Demand for Dell’s AI-optimized infrastructure continues to outpace supply, contributing to a growing order backlog and reinforcing the company’s emerging leadership in enterprise AI deployment. The standout catalyst is Dell’s newly secured US$5.8 billion AI server contract, a deal that directly addresses near-term revenue visibility and signals sustained institutional demand.
However, to be a Dell shareholder today, investors must accept that AI growth needs to compensate for ongoing softness in traditional server and PC segments. The rapid expansion in AI-infrastructure orders can temporarily compress margins, especially as Dell scales production and delivery. Still, these pressures are likely cyclical rather than structural, with higher-value enterprise solutions expected to re-expand margins over time.
Technical Outlook
The chart shows Dell pulling back sharply from the $168 zone and retesting a long-term ascending trendline — a key technical support level that has historically triggered strong rebounds. Price is now hovering around the $134 region, aligning with the dotted trendline that has supported multi-quarter rallies.
If this level holds, DELL could set up a bullish reversal back toward the $168 recent high and beyond, with a broader extension to $180+ over the next cycle. A breakdown, however, exposes the stock to lower support zones.
Overall, Dell remains one of the most leveraged large-cap plays on enterprise AI infrastructure, with strong catalysts and constructive long-term technicals.

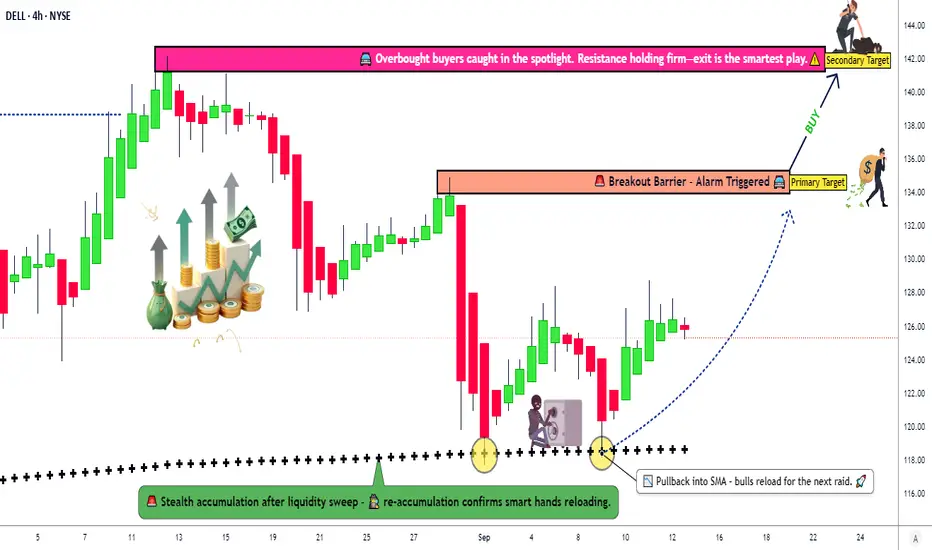
Dell Stock Idea – Bullish Outlook With Layered Entries💰 Dell Technologies INC: The Great Stock Market Heist Plan (Swing/Day Trade) 💰
🎯 Asset: Dell Technologies INC (DELL)🎭 Vibe: Bullish Bandits on the Move! The Simple Moving Average (SMA) is flashing green, confirming a buy trend, and the big institutional players are piling in. Time to join the heist with the market's heavy hitters! 🚀
📜 The Heist Plan: Bullish Breakout with a Thief’s Flair
🔍 Why DELL?The SMA is screaming "BUY," and institutional buyers are sneaking in like pros. We’re tailing the big players with a slick Thief Layering Strategy to maximize our loot. Here’s how we execute this caper:
Entry: 🕵️♂️ Thief Layering StrategyDeploy multiple buy limit orders to stack the deck in your favor:
🎯 $120.00
🎯 $122.00
🎯 $124.00
🎯 $126.00
Pro Tip: Add more layers based on your risk appetite and market conditions. Be the sneakiest thief in the game! 😎
Stop Loss (SL): 🚨 $118.00Set this SL after the breakout at the mentioned price levels to protect your stash. Dear Ladies & Gentlemen (Thief OGs), adjust your SL based on your strategy and risk tolerance. This isn’t a one-size-fits-all heist—own your escape plan! 🏃♂️
Targets: 🤑 Police Barricade Ahead!Watch out for strong resistance and overbought zones where traps lurk. Escape with your profits at:
Primary Target: $134.00
Secondary Target: $142.00Note: Dear Thief OGs, these are suggested targets. Grab your loot when it feels right—your heist, your rules! 💸
⚠️ Thief’s Code of Honor
Dear Ladies & Gentlemen (Thief OGs), I’m not here to dictate your SL or TP. This is your heist—make your moves and take your profits at your own risk. Stay sharp, stay safe, and don’t get caught! 😜
🔗 Related Pairs to Watch
To make this heist even smoother, keep an eye on these correlated assets (all in USD):
HP Inc. ( NYSE:HPQ ): Moves in tandem with DELL as a tech hardware peer. If HPQ is pumping, it’s a good sign for DELL’s bullish run.
NVIDIA ( NASDAQ:NVDA ): Tech giant with strong correlation to DELL due to AI and data center trends.
NVDA’s strength could fuel DELL’s breakout.
S&P 500 Index ( AMEX:SPY ): DELL often rides the broader market wave. If SPY is bullish, it’s a tailwind for our heist.
Key Correlation Insight: DELL’s performance is tied to tech sector momentum and institutional buying in AI/data center stocks. Watch NVDA and HPQ for confirmation of DELL’s bullish trend, and keep SPY on your radar for market sentiment.
🛠️ Why This Setup Works
✅ Technical Confirmation: The SMA signals a clear bullish trend, giving us the green light.
✅ Institutional Backup: Big players are entering, so we’re riding their coattails.
✅ Layered Entries: Multiple limit orders reduce risk and increase flexibility.
✅ Defined Escape Plan: Clear SL and TP levels keep us ahead of the market’s “police.”
📝 Disclaimer
This is just a fun vibe and not financial advice! Trading is risky, and you should always do your own research and consult with a professional before making any moves. Stay sharp, Thief OGs! 😎
✨ If you find value in my analysis, a 👍 and 🚀 boost is much appreciated — it helps me share more setups with the community!
#TradingView #DELL #StockMarket #SwingTrading #DayTrading #Bullish #ThiefStrategy #TechnicalAnalysis
DELL Stock Price Analysis Ahead of Earnings ReleaseDELL Stock Price Analysis Ahead of Earnings Release
In addition to Nvidia’s (NVDA) quarterly report, this week financial market participants are also closely watching Dell Technologies’ (DELL) earnings release, scheduled for Thursday, 29 May, after the close of the trading session.
According to analysts cited by the media:
→ the company’s revenue is expected to come in at $23.18 billion (compared to $22.24 billion in the same period last year, and $23.9 billion in the previous quarter);
→ particular attention will be paid to Dell’s business segment focused on manufacturing servers for AI applications.
Notably, DELL’s price chart shares several similarities with the NVDA chart we analysed yesterday.
Technical Analysis of DELL’s Share Price
Price movements have formed a downward channel (shown in red) that has remained valid since 2024. In a broader context, it resembles a bullish flag pattern, which typically signals the potential continuation of an uptrend — a scenario that seems increasingly likely given the following:
→ the DELL’s price is currently near the upper boundary of the channel;
→ the May price rally suggests strong demand for DELL shares. Note the confident breakout above the psychologically significant $100 level (highlighted by the arrow), accompanied by a bullish gap and a series of rising candlesticks.
It is possible that the upcoming earnings report will act as a catalyst, enabling the bulls to gather momentum and attempt a breakout from the prevailing downward channel.
This article represents the opinion of the Companies operating under the FXOpen brand only. It is not to be construed as an offer, solicitation, or recommendation with respect to products and services provided by the Companies operating under the FXOpen brand, nor is it to be considered financial advice.

Dell Technologies (NYSE: $DELL) Stock Gains on Tariff ReliefDell Technologies Inc. (NYSE: NYSE:DELL ) rose sharply on Monday following the Trump administration’s temporary suspension of tariffs on smartphones, computers, and other electronics. The updated guidance from U.S. Customs and Border Protection late Friday excluded these items from the latest round of reciprocal tariffs, which had raised concerns among tech manufacturers.
Dell shares gained 4%, closing at $85.19, up $3.26 on the day, with a trading volume of 12.35 million shares. The stock had opened at $89.29 and reached a low of $84.01 during the session. The tariff pause, though potentially temporary, has eased pressure on companies that heavily rely on global supply chains. Dell, which produces most of its hardware outside the United States, stands to benefit significantly from the exemption.
JPMorgan analysts commented that the exemption highlights the strategic importance of electronics to American consumers and the economic weight of companies like Dell and Apple. While Apple is accelerating its manufacturing diversification into countries like India and Vietnam, Dell continues to leverage international production capacity to maintain its competitiveness.
Technical Analysis
From a technical perspective, DELL is currently trading within a descending channel that started from its all-time high of $179.70. The recent bounce from a support zone indicates potential short-term support. The price action suggests two likely scenarios: a continued climb toward the upper boundary of the channel near $110, or a pullback to test lower levels around $42, aligned with the bottom of the channel.
The 200-day moving average (86.18) and 100-day (116.72)currently sit above the price, indicating a bearish medium-term trend. However, if DELL holds support around $85.11 and gains momentum, it could challenge the mid-channel resistance and eventually attempt a breakout.

DELL Resistance Breakout 30.05.2024- 1HR Chart Analysis: Dell in uptrend, currently at $179.30.
- Resistance: $179.75.
- Upside Breakout: Target $206.77, with potential for further gains.
- Resistance Rejection: Possible decline to $170.66, with potential for further drops if broken.
- Apply risk management.
_________________________________________________________________________________
Risk Warning: Trading in CFDs is highly speculative and carries a high level of risk. It is possible to lose all of your invested capital. These products may not be suitable for everyone, and you should ensure that you fully understand the risks taking into consideration your investment objectives, level of experience, personal circumstances as well as personal resources. Speculate only with funds that you can afford to lose. Seek independent advice if necessary. Please refer to our Risk Disclosure.
BDSwiss is a trading name of BDS Markets and BDS Ltd.
BDS Markets is a company incorporated under the laws of the Republic of Mauritius and is authorized and regulated by the Financial Services Commission of Mauritius ( FSC ) under license number C116016172, address: 6th Floor, Tower 1, Nexteracom Building 72201 Ebene.
BDS Ltd is authorized and regulated by the Financial Services Authority Seychelles (FSA) under license number SD047, address: Suite 3, Global Village, Jivan’s Complex, Mont Fleuri, Mahe, Seychelles. Payment transactions are managed by BDS Markets (Registration number: 143350)
