BTCUSD — Range Low 87767.53Price broke the range low, but follow-through has not yet accepted value below the range.
Market data behavior observation.
No prediction. No instruction.
— CORE5DAN
Institutional Logic. Modern Technology. Real Freedom.
Delta

Gold - Bulls flex hard into the closeBulls came back strong Friday with very strong bullish delta and imbalance at the lows.

How Investment Funds Really Make Money From Bitcoin📰 After years of closely following financial markets, one conclusion has become impossible for me to ignore:
most people fundamentally misunderstand how professional funds make money from Bitcoin.
Retail traders often assume funds operate the same way they do — buying low, selling high, and betting on direction.
If price goes up, they win.
If price goes down, they lose.
That assumption is overly simplistic — and largely incorrect.
🔍 For institutional funds, Bitcoin is not a directional gamble.
From what I’ve observed, large funds are not emotionally attached to whether Bitcoin rises tomorrow or drops next week.
Price direction is not their primary concern.
What truly matters is structure.
Funds are not rewarded for guessing the market correctly.
They are rewarded for controlling risk and systematically converting volatility into measurable returns.
🎯 Their real objective is volatility, not conviction.
When a fund allocates capital to Bitcoin, it is rarely driven by belief in a narrative or excitement around headlines.
They don’t follow influencers.
They don’t react to social media hype.
What they care about is quantifiable price movement.
Volatility is the raw input.
Mathematical models are the engine.
Decisions are driven by numbers, not emotions.
🧠 Buying Bitcoin does not automatically mean being bullish.
One of the most common misconceptions I encounter is the idea that institutional buying signals an expectation of higher prices.
In reality, a fund can purchase Bitcoin while remaining entirely neutral.
They can be delta-neutral, fully hedged, detached from market direction, and protected against both upside and downside moves.
This is why buying BTC is not a bet for them.
It is simply the first layer in a multi-stage trading structure.
📊 So how do funds actually profit from price movement?
By combining spot exposure with derivatives, funds build positions that benefit from movement itself rather than predicting direction.
When price rises, positions are adjusted and partial exposure is sold at higher levels to rebalance risk and lock in gains.
When price falls, exposure is rebuilt at lower prices to restore balance.
🔁 Price moves higher → exposure is reduced at better levels
🔁 Price moves lower → exposure is increased at cheaper levels
🔁 The process repeats with discipline and precision, free from emotion
This systematic process is known as gamma scalping — the quiet, continuous profit mechanism behind institutional trading.
💰 Where do their real profits come from?
Not from news headlines.
Not from influencers.
Not from ETF narratives.
Profits are generated through continuous hedge adjustments, realized volatility exceeding expectations, direction-neutral structures, and strict mathematical discipline.
⛔ The only environment that truly challenges these strategies is when the market stops moving altogether.
🧭 Let me be direct with you, speaking as a market professional.
You are not BlackRock.
You do not have their infrastructure.
You do not have their capital, execution speed, or risk frameworks.
Attempting to interpret or replicate their actions without understanding the underlying structure will not improve your trading — it will only increase confusion.
✍️ My conclusion is straightforward:
Funds do not profit from predicting the future.
They profit from engineering outcomes.
They do not trade stories.
They do not trade emotions.
They do not trade social media noise.
🎯 They trade structure.
And you?
Stop obsessing over what institutions are doing.
Start focusing on what you should be doing.
That is the line between surviving in the market
and being quietly pushed out of it.

How Funds Actually Make Money From BitcoinIf you spend more than five minutes on Crypto TikTok (YouTube or X are not much different), you’d think the entire market depends on:
- who “bought the dip,”
- who “sold the top,”
- and which whale “decided” to pump or dump.
The screamers with flashy thumbnails and zero understanding yell:
- “BlackRock is buying—BULLISH!”
- “Whales are selling—CRASH INCOMING!”
- “Institutions are entering the market!!!”
- No nuance.
- No structure.
- No clue.
Because here’s the truth:
What BlackRock buys or sells is almost irrelevant to you.
Funds do not make money the way TikTok believes.
They don’t need Bitcoin to go up.
They don’t need Bitcoin to go down.
They need one thing:
Movement. Volatility. Math.
Let’s destroy the hype and show how funds actually make money.
1. Why “BlackRock is buying BTC” tells you absolutely nothing
Retail sees a headline:
“ETF inflows: +5,000 BTC today!”
And jumps to conclusions:
“They know something!”
“Price HAS to go up!”
“Institutions are bullish!”
No.
A fund can buy BTC and still be:
- 100% hedged
- delta-neutral
- directionally flat
- risk-neutral
- fully protected against price movement
The purchase is not a bet.
It’s a component of a structured position.
Buying BTC is just Step 1.
What matters is Step 2, 3, 4, 5…—all the parts TikTok doesn’t even know exist.
2. Why TikTok “analysts” have no idea what they’re talking about
If someone:
- screams in every video,
- says “bullish” or “bearish” 40 times a minute,
- thinks “institutions pump price,”
- doesn’t know what delta, gamma, basis, hedging, ATM straddles are…
…then they are not explaining institutional flow.
They are farming views and likes, not teaching markets.
Let’s be blunt:
If you can’t explain a delta-neutral hedge, your opinion about what BlackRock “plans to do” or "is doing" is worthless.
So let’s walk through how a real fund uses BTC to print money without caring if price goes up or down.
3. How a real fund makes money from volatility (step-by-step, using $100,000 BTC)
Assume:
- BTC price = $100,000
- A fund wants exposure to volatility, not direction
- They buy a BTC ATM straddle (call + put at 100k)
- Delta ≈ 0
- Gamma > 0 → the part that generates money
- They also own BTC spot for hedging.
- Let’s say the fund holds 1 BTC worth $100,000 as inventory for hedge adjustments.
At the start:
Delta-neutral. No directional risk.
Now let’s see how they profit.
Step 2 – BTC goes up 10% → $110,000
Straddle delta becomes +0.5 BTC.
The fund is unintentionally long 0.5 BTC.
To go back to neutral:
The fund sells 0.5 BTC at $110,000.
Cash received:
0.5 × 110,000 = $55,000
Theoretical cost basis (100k):
0.5 × 100,000 = $50,000
👉 Profit from hedge = $55,000 – $50,000 = $5,000
Plus, the straddle increased in value due to volatility.
Step 3 – BTC drops 10% → $90,000
Now straddle delta flips negative: –0.5 BTC
To get back to neutral:
The fund buys 0.5 BTC at $90,000.
Cash paid:
0.5 × 90,000 = $45,000
If they later sell that BTC at the baseline of 100k:
👉 Profit = $50,000 – $45,000 = $5,000
Again, without needing BTC to go up or down, “as predicted.”
This is called:
Gamma scalping — the quiet, relentless engine behind institutional P&L.
Up move → sell high.
Down move → buy low.
Repeat. Print. Sleep.
4. Where does the REAL profit come from?
A fund earns from:
- hedge adjustments (buy low, sell high, but mathematically—not emotionally)
- straddle appreciation as realized volatility exceeds implied volatility
- basis differences between spot and futures
- neutrality to direction, allowing consistent compounding
They make money even if Bitcoin swings between 95k–105k for weeks.
The only time they lose?
When BTC does NOT move.
Because then the straddle premium decays.
That's it.
Nothing to do with faith, predictions, narratives, influencers, or ETF flows.
5. So why should YOU ignore what BlackRock is doing?
Because:
- You are not BlackRock.
- You do not run a delta-neutral book.
- You do not make money from gamma exposure.
- You do not scalp intraday hedges on $100M positions.
- You do not capture basis spreads across spot and derivatives.
- You do not have a trading desk rebalancing risk every hour.
But the TikTok screamers will still tell you:
“Institutional buying = bullish!”
“Institutional selling = bearish!”
“Whales know something!”
They don’t know anything.
Especially not about institutional structure.
So here’s the punchline:
Watching what funds do—without understanding why they do it—is the fastest path to confusion in the best case and destruction in the worst.
You don’t have their:
- tools,
- capital,
- execution speed,
- risk models,
- mandate,
- or mathematical framework.
So trying to mimic them is not just pointless —it’s dangerous.
Final Lesson: Ignore the noise, ignore the hype, ignore the TikTok parade.
BlackRock doesn’t care about bull markets or bear markets.
BlackRock doesn’t need Bitcoin to moon.
BlackRock doesn’t panic when Bitcoin drops.
Because BlackRock doesn’t trade the story.
They trade the structure.
And unless you operate like a fund — stop pretending their moves matter to your trading.
You’re not them.
You don’t have their machinery.
You don’t have their volatility book.
So:
Stop watching what institutions do.
Start understanding what you should do.
That’s the difference between surviving and blowing up.
P.S: BlackRock and TikTok are used just as an example:)

A simple Introduction to Footprint charts
Welcome to this educational video on footprint charts .
I decided to do this introduction because I feel it would benefit so many traders who are unfamiliar with this chart type and once understood it can serve as a very powerful additional confluence in your day to day trading .
I hope I have delivered this lesson in a simple and understandable format for you too
understand the following .
The problem with just watching the price
What is order flow
Delta explained
What is open interest
How to tie it all together to produce better entries , exists and oversight into knowing when to take your trades.
I welcome any feedback or questions and I really hope that this serves you well.
*The link to the Tradingview guide is in the designated box on the right hand side I encourage everybody to use this resource .

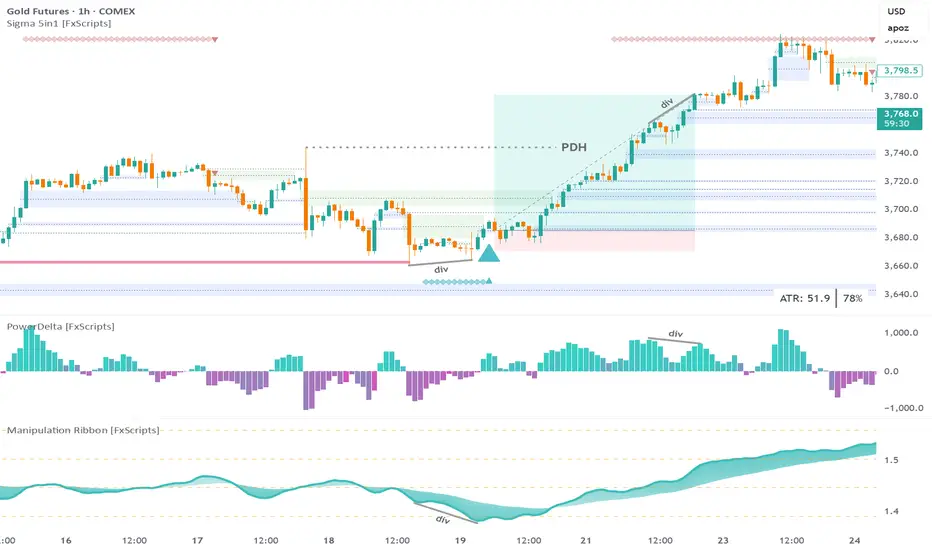
GC Futures 15m: 6.6:1 trade executed using Sigma Trading SystemStep 1: wait for a sweep of daily liquidity
Note: the sweep must be confirmed for any of the other confluences to be valid
Step 2: wait for a bullish marker to be drawn by the Reversal Print indicator
Tip: set an alert if you don’t want to spend all day staring at the chart
Step 3: look for a divergence with either the PowerDelta Oscillator or, in this case, the Manipulation Ribbon
Info: the Manipulation Ribbon detects areas of price manipulation by Market Makers vs areas where it is trading in a natural, price-driven state
Step 4: the entry is a tap of the most recent confirmed FVG
FYI: all the drawings on the main chart are created by the Sigma 5-in-1 indicator
SL: low of first candle that forms the entry FVG
Tip: for a more conservative approach the recent swing low could also be used
TP: bearish divergence with the PowerDelta Oscillator
Note: gold was at an all-time high so anything beyond the Previous Day High (PDH) posed a risk however for a more conservative approach you could exit half your position at the PDH
From Mystery to Mastery: Options ExplainedIntroduction: Why Options Feel Complicated
Options are perhaps the most misunderstood instruments in trading. To the untrained eye, they seem like an impossible puzzle: strange terminology, an overwhelming options chain filled with numbers, and payoff diagrams that bend in multiple directions. Many traders dismiss them as “too complex,” or worse, confuse them with gambling.
But options are not about chance — they are about choice. Each contract offers the trader a way to shape risk, control exposure, and adapt to unique market conditions. While this flexibility comes with greater sophistication, it also unlocks a toolkit that no other instrument can match.
The visuals you can see at the top of this publication — an options risk profile with multiple legs and a snapshot of an options chain — illustrate this dual nature. At first glance, the visuals are busy, packed with strikes, expirations, premiums, and curved payoff lines. Yet these are the very tools that make options versatile. They can be combined to express bullish, bearish, neutral, or volatility-driven views with precision.
The goal of this article is to take the mystery out of options and highlight why their complexity is worth understanding. Step by step, we’ll explore how they work, how the Greeks shape outcomes, how different strategies can be structured, and why they play such a vital role when layered onto futures trading.
What Are Options?
At their simplest, options are contracts that give the buyer the right, but not the obligation, to buy or sell an asset at a predetermined price within a specific time period. That asset may be a stock, a futures contract, or even an index.
Two Building Blocks
Call Options: Give the right to buy the underlying at the strike price. Traders buy calls when they expect the underlying to rise.
Put Options: Give the right to sell the underlying at the strike price. Traders buy puts when they expect the underlying to fall.
The Price of an Option: The Premium
Option buyers pay a premium, while option sellers collect it. This premium reflects the market’s assessment of risk and probability, and it changes constantly with price, volatility, and time.
Intrinsic vs. Extrinsic Value
Intrinsic Value: The amount an option would be worth if it were exercised immediately. For example, a call with a strike below the current price has intrinsic value.
Extrinsic Value: The “time value” built into the premium — compensation for the uncertainty of where price may go before expiration.
Why Options Matter
Unlike buying or selling the underlying directly, options allow traders to shape their exposure: define maximum risk, set conditional payoffs, or even profit from time decay and volatility changes.
The above options chain screenshot illustrates how layered this world can be. Rows of strikes, bid-ask quotes, open interest, and implied volatility may look daunting at first. But each piece of data contributes to building strategies that fit specific objectives.
The Greeks Made Simple
If the options chain is the menu, then the Greeks are the ingredients that determine how a position behaves. Each Greek measures a different sensitivity, helping traders understand not just what they are trading, but how it will move as conditions change.
Delta (Δ)
Measures how much an option’s price will change for a one-point move in the underlying asset.
A delta of 0.50 means the option should gain about 0.50 units if the underlying rises by 1.
Traders often use delta as a proxy for probability of finishing in the money.
Gamma (Γ)
Tracks how much delta itself will change as the underlying moves.
High gamma means delta can shift rapidly, often near at-the-money strikes close to expiration.
This makes gamma a key driver of volatility in option prices.
Theta (Θ)
Represents time decay — the amount an option loses each day, all else equal.
Options are wasting assets; as expiration approaches, time value shrinks faster.
Option sellers often seek to benefit from theta, while buyers must overcome it.
Vega (ν)
Measures sensitivity to changes in implied volatility (IV).
A higher vega means the option’s value rises more when volatility increases.
Since IV often spikes in uncertain times, vega is crucial for traders who position around events.
Rho (ρ)
Tracks sensitivity to interest rate changes.
While less relevant in low-rate environments, rho matters for longer-dated options.
Why the Greeks Matter
Taken together, the Greeks form a multidimensional risk profile. A trader isn’t just long or short — they are exposed to directional risk (delta), acceleration (gamma), time decay (theta), volatility (vega), and interest rates (rho).
The earlier options risk profile diagram illustrates how these forces combine in multi-leg positions. Each curve on the graph reflects the complex interplay of the Greeks, showing why mastering them is essential for managing sophisticated strategies.
Core Options Strategies
Options can be as simple or as sophisticated as a trader chooses. At their core, all strategies are built from just two instruments — calls and puts — yet when combined, they create a vast range of payoff structures.
Directional Strategies
Long Calls: Buying a call gives upside exposure with limited downside (the premium paid).
Long Puts: Buying a put provides downside exposure with limited risk.
These are straightforward but carry the burden of time decay (theta).
Income Strategies
Covered Calls: Holding the underlying asset while selling a call against it. This generates premium income but caps upside.
Cash-Secured Puts: Selling a put while holding cash collateral. If assigned, the trader buys the underlying at the strike price.
Risk-Defined Spreads
Vertical Spreads: Buying one option and selling another at a different strike in the same expiration. This defines both maximum risk and reward.
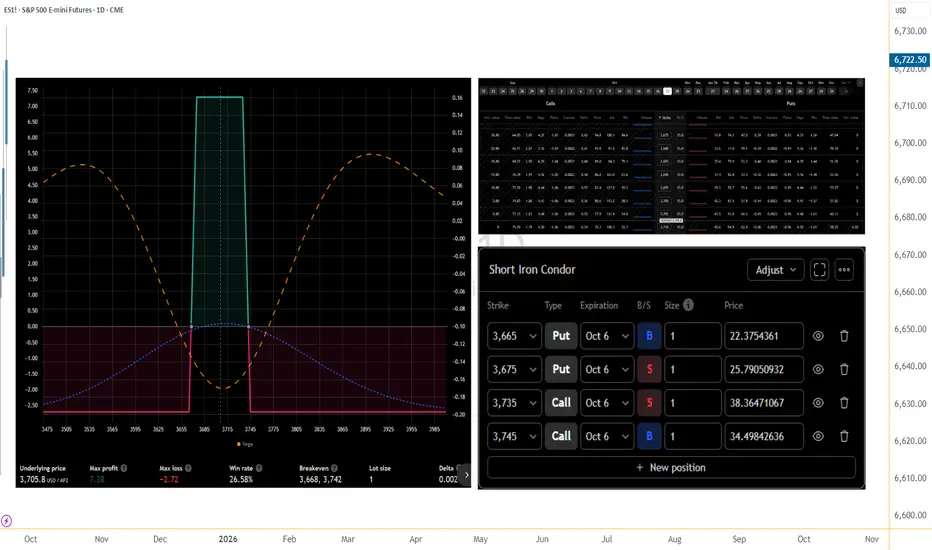
Iron Condors: A combination of spreads that profits if the underlying stays within a range. Risk and reward are defined upfront.
The above iron condor risk profile chart shows exactly how this works: profit is maximized in the middle range, while losses are capped outside the wings.
Why Structure Matters
Each strategy has its strengths and weaknesses, but the true value of options lies in their flexibility. Traders can design positions to fit directional views, volatility expectations, or income objectives — all with defined risk.
Options strategies are like tools in a kit: the more you understand their mechanics, the more precisely you can shape your market exposure.
Options on Futures
Most traders first encounter options through stocks, but options on futures open the door to even broader applications. While the mechanics are similar, there are key distinctions worth noting.
Underlying Differences
Stock options are tied to shares of a company.
Options on futures are tied to futures contracts — which themselves already embed leverage and expiration.
This layering adds both flexibility and complexity. A trader is essentially trading an option on a leveraged instrument.
Practical Use Cases
Hedging Commodity Risk: An airline might use crude oil futures to lock in prices, then overlay options to cap extreme scenarios while reducing hedging costs.
Speculating with Defined Risk: A trader bullish on gold can buy a call option on gold futures. The maximum loss is the premium, but the upside tracks leveraged futures moves.
Volatility Plays: Futures options often respond strongly to shifts in implied volatility, especially around key reports or geopolitical events.
Why They Matter
Options on futures give traders the ability to fine-tune exposures. Instead of committing to full futures leverage, a trader can scale in with options, controlling downside while keeping upside potential open.
They also broaden the range of strategies available. Futures already expand diversification; adding options introduces an entirely new layer of flexibility.
Index Options
Among the most widely traded options in the world are those based on equity indexes, such as the S&P 500 or Nasdaq-100. These instruments serve as essential tools for institutions and active traders alike.
Why Index Options Are Popular
Portfolio Hedging: Instead of hedging each stock individually, investors can use index puts to protect an entire portfolio.
Exposure Without Ownership: Index options allow participation in market moves without holding any individual company shares.
Liquidity and Depth: Index options often trade with deep volume and open interest, making them attractive for both large and small participants.
Volatility and the Options Surface
A key feature of index options is their relationship with volatility. The chart below — an implied volatility surface/skew diagram — shows how options with different strikes and maturities carry different implied volatilities.
Volatility Skew: Out-of-the-money puts often trade with higher implied volatility, reflecting demand for downside protection.
Term Structure: Near-term expirations may reflect event risk (such as earnings or Fed meetings), while longer maturities capture broader market uncertainty.
Why It Matters
Index options aren’t just directional bets. They are also instruments for trading volatility, sentiment, and risk itself. Institutions rely on them to hedge, while traders use them to capture shifts in implied volatility across strikes and expirations.
By understanding how skew and surfaces behave, traders can better interpret market expectations — not just where prices may go, but how uncertain participants feel about the path forward.
Risk Management with Options
Options provide unmatched flexibility — but that flexibility can tempt traders into overcomplicating positions or underestimating risk. Mastery comes from structuring trades with risk control at the core.
Defined vs. Undefined Risk
Defined-Risk Trades: Spreads and combinations such as verticals or iron condors cap both upside and downside. Maximum loss is known from the start.
Undefined-Risk Trades: Selling naked calls or puts exposes traders to potentially unlimited risk. While these strategies may generate steady premiums, one large adverse move can wipe out months or years of gains.
Managing Volatility Exposure
Volatility can shift rapidly, especially around earnings reports, central bank decisions, or geopolitical events.
A long option position benefits from rising implied volatility but suffers if volatility collapses.
A short option position gains from falling volatility but risks severe losses if volatility spikes.
Theta Decay and Time Management
Time decay (theta) erodes option premiums every day.
Buyers must ensure their directional or volatility edge is strong enough to overcome this drag.
Sellers must balance the benefit of theta decay against the risk of sharp, unexpected price moves.
Position Sizing Still Matters
Even defined-risk strategies can compound losses if oversized. Options’ leverage allows traders to control significant exposure with relatively small premiums, making discipline in sizing just as important as with futures.
The Core Principle
Options don’t eliminate risk — they reshape it. Effective risk management means choosing strategies where the risk profile matches your conviction, market conditions, and tolerance for uncertainty.
Common Mistakes New Options Traders Make
Options open powerful opportunities, but without structure, beginners often fall into predictable traps. Recognizing these mistakes is the first step to avoiding them.
Chasing Cheap Out-of-the-Money Options
Many new traders are attracted to options with very low premiums, believing they offer “lottery ticket” potential. While the payoff looks appealing, the probability of expiring worthless is extremely high.
Ignoring Implied Volatility
Price direction isn’t the only driver of option value. A trader might buy a call, see the underlying rise, yet still lose money because implied volatility dropped. Treating options as simple directional bets ignores one of their most critical dimensions.
Overusing Undefined-Risk Positions
Naked calls and puts can seem attractive because of the steady income from premium collection. But without defined risk, these trades can expose traders to devastating losses when markets move sharply.
Mismanaging Time Decay
Theta works against buyers, and new traders often underestimate how fast options lose value near expiration. Buying short-dated options without accounting for theta can erode capital even when the underlying moves in the expected direction.
Forgetting the Exercise and Assignment Process
Options on futures and equities alike can be exercised or assigned. New traders often overlook the obligations that come with short positions, leading to unexpected futures or stock exposures.
Takeaway
Every mistake above comes from misunderstanding what options truly are: instruments shaped not only by direction, but also by time, volatility, and structure. Avoiding these pitfalls is what separates those who dabble from those who progress toward mastery.
Conclusion: From Complexity to Clarity
Options may seem intimidating at first glance. The crowded options chain, the curved payoff diagrams, and the alphabet soup of Greeks can overwhelm even experienced traders. Yet within this complexity lies unmatched versatility.
Options allow traders to:
Define risk with precision.
Express bullish, bearish, or neutral views.
Trade volatility and time as independent variables.
Hedge portfolios against unexpected events.
The charts in this article — from the iron condor risk profile to the volatility skew surface — highlight the breadth of possibilities. They show why options are not a single strategy, but a toolkit that adapts to any market condition.
The challenge is not to memorize every strategy, but to understand how the pieces fit together: calls, puts, Greeks, spreads, volatility, and time. Once these elements stop being a mystery, options transform from a confusing maze into a structured path toward mastery.
This article completes our From Mystery to Mastery trilogy. We began with Trading Essentials, laying the foundation. We advanced into Futures Explained, exploring leverage and diversification. Now, with Options Explained, we’ve reached the most versatile and sophisticated layer of trading.
The journey doesn’t end here. Futures and options will always evolve with markets, offering new challenges and opportunities. But with a structured process, disciplined risk management, and the mindset of continuous learning, traders can move confidently — from mystery to mastery.
From Mystery to Mastery trilogy:
Options add a powerful layer of flexibility to trading, whether used for directional plays, income strategies, or hedging. Since many actively traded options are written on futures contracts listed on CME Group exchanges, it’s important to note that chart data can sometimes be delayed. For those who wish to analyze these products in real time on TradingView, a CME Group real-time data plan is available: www.tradingview.com . Traders focused on short-term options strategies, where timing and volatility shifts matter most, will find real-time access particularly valuable.
General Disclaimer:
The trade ideas presented herein are solely for illustrative purposes forming a part of a case study intended to demonstrate key principles in risk management within the context of the specific market scenarios discussed. These ideas are not to be interpreted as investment recommendations or financial advice. They do not endorse or promote any specific trading strategies, financial products, or services. The information provided is based on data believed to be reliable; however, its accuracy or completeness cannot be guaranteed. Trading in financial markets involves risks, including the potential loss of principal. Each individual should conduct their own research and consult with professional financial advisors before making any investment decisions. The author or publisher of this content bears no responsibility for any actions taken based on the information provided or for any resultant financial or other losses.
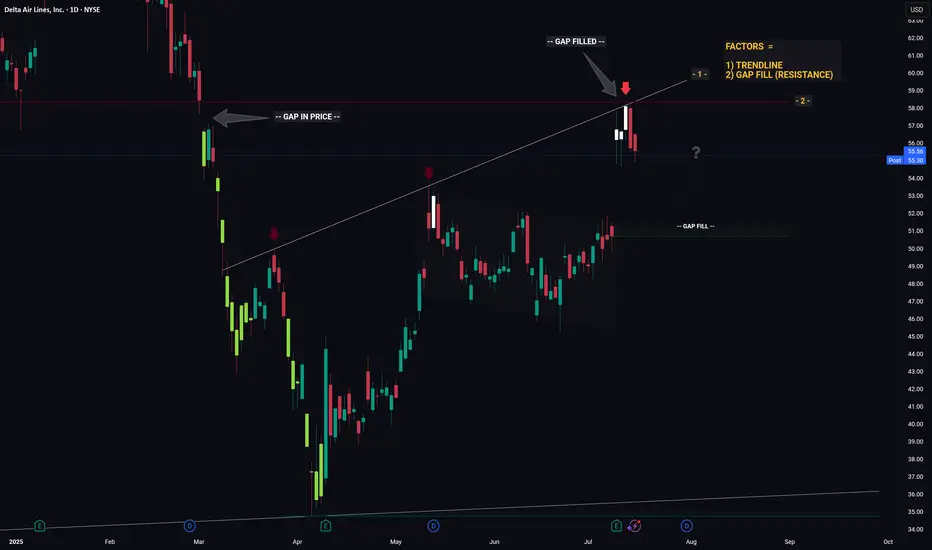
DELTA - Converging Levels Creates Huge Resistance - Retrace?Hello Traders!
Whichever Hedge Fund that is responsible for the recent price action in DELTA mustve been in a generous mood... because theyre giving us an excellent hint as to what price will likely do next.
And what hint might that be you ask...
1) Trendline (connecting the recent highs)
2) Gap Fill (Resistance)
Individually these factors are relatively strong, however when combined they essesntially create a strong barrier that will be very hard for price to break through. Think about it like a wall made from Captain Americas shield... now try and break through that.. aint gonna be easy.
So whats next for price? If I was a betting man (and I am, incase you were wondering) I would say theres a high probability that price is going to trade down from this resistance level then retrace to the gap fill below. From the gap fill level we will likely see a bounce.
Thanks, I hope you found this post educational or helpful and best of luck on your trading journey!
Delta Airlines - Long Term FlyerHey, all. Pretty intense idea here, but I am a buyer of NYSE:DAL at these levels. Obviously, the chart looks awful from a recent performance perspective. However, if you take a long term view, we could actually be rebalancing after an initial range expansion to the upside. Just like NASDAQ:RIVN , airlines are/have been a pretty brutal investment. I guess I have a thing for pain. Ha.
I am certainly a believer that airlines are undervalued here and can reverse back to the upside. Of course, it goes against the current narrative that the economy is showing signs of weakness. But I am just willing to take the risk on this one. I believe the consumer and culture shift in the US to have more experiences in life will continue to hold.
Are we going to come in for a hard landing, or take off to cruising altitude? We'll see what kind of lift the market will give us. Right now the turbulence is pretty intense.

NVDA GEX Earnings Outlook by OptionsNVDA reports earnings this Wednesday, and it’s a big deal. A major move could impact both the indexes and broader tech sector.
The OTM 16 delta curve essentially overlaps with both the GEX profile and the expected probability zone — signaling strong confluence.
📈 Rising IV with falling call skew: Volatility is rising into earnings, while the call skew is dropping — a sign of growing interest in downside hedging/speculation.
🔷 Key inflection zone (129): Above 129, the market is unlikely to surprise. Below it, however, a domino effect could trigger increased volatility and put-side flows.
Implied move into earnings is 6.62%, reflecting binary risk expectations from the options market.
Strong gamma squeeze territory exists between 140–145, with significant call wall buildup around 140.
The nearest expiry shows a positive net GEX — supporting short-term mean-reversion or hedging flow stability above 129, at least until the earnings print.
🔴 Downside risk scenario:
In the event of a downward move, the market is most heavily hedged around the 125 level, which aligns with the deepest put support.
💡 Wheeling Opportunity Idea
ONLY IF you want to own NVDA long-term around the $130 level (even if it drops short/mid-term), this might be a great time to start the wheeling strategy.
Because earnings inflate volatility, you can sell a near-term cash-secured put (CSP) for solid premium — even on a 53DTE (July) option.
Based on current GEX levels, we’re seeing:
-Support (squeeze zone) around $125
-Call resistance around $140
-A potential upside squeeze extending to $145-$150
These align roughly with ~20 delta OTM options, so the premium is attractive.
How would I personally start this:
Sell a CSP for May 30 with the intention to get assigned if NVDA drops.
If I do get assigned, I’m happy to own shares.
Then, I sell a 60DTE covered call right after to collect another round of premium.
If I’m not assigned, I sell a new 45–60DTE put the following week — still benefiting from the relatively high IV.
👉 Remember: High IV = synthetic time value. With this two-step method, you can harvest premium twice in quick succession.
I used the same technique with NASDAQ:INTC , and it’s been performing well.
💥 ONLY IF you want to own NVDA long-term around the $130 level (even if it drops short/mid-term)!

Breaking: Delta Air Lines, Inc. (NYSE: $DAL) Surged 8% TodayShares of Delta Airlines, Inc (NYSE: NYSE:DAL ) surges 8% today after the company reported adjusted earnings per share (EPS) of $0.46 on operating revenue of $14.04 billion. Analysts polled by Visible Alpha had forecast $0.39 and $13.89 billion, respectively.
The company which provides scheduled air transportation for passengers and cargo in the United States and internationally reported passenger revenue per available seat mile (PRASM) of 16.78 cents and cost per available seat mile (CASM) of 19.69 cents; analysts had expected Delta to lose about 2.8 cents per ASM transporting passengers. Delta and domestic rivals United Airlines (UAL), American Airlines (AAL), and Southwest Airlines (LUV) all were profitable but lost money flying passengers in 2024.
Delta said it expects second-quarter revenue to rise or decline by 2% and adjusted EPS from $1.70 to $2.30, below the $2.41 consensus. The airline said it is not affirming or updating full-year projections at this time "given current uncertainty."
Analyst Forecast
According to 14 analysts, the average rating for DAL stock is "Strong Buy." The 12-month stock price forecast is $64.56, which is an increase of 68.30% from the latest price.
Technical Outlook
As of the time of writing, NYSE:DAL shares are up 6.69% trading within a bullish pattern. The asset has more to run as hinted by the RSI at 31. NYSE:DAL 's chart pattern shows a bullish engulfing candlestick and a break above the $45 pivot point could cement the path for a bullish move to the 1-month high.

10RR Cont. >VWAP-Bearish cum. delta on the day
-Continuation on structure
-move from vwap
-confirmed by OF
-Entry off imbalance on VP

DAL... We have take offGood morning traders,
If you have been following my predictions on DAL and UAL, well... WE HAVE TAKE OFF! OB has been tested, we could see a pullback testing the previous red candle but should be a decent flight from there on out. Some turbulence along the way, but shouldn't be big enough to knock this plane down.
All previous areas have been tested and structurally it looks great. Hang on tight a bit more we are almost there. Keep UAL on your sights, this has much more traveling to do which means bigger profits as well.
Hope you enjoy the rest of your day, and don't forget to follow for all my other predictions. Have a great rest of your week, happy trading & God Bless!

2 bullish scenarios for Delta!🔉Sound on!🔉
Thank you as always for watching my videos. I hope that you learned something very educational! Please feel free to like, share, and comment on this post. Remember only risk what you are willing to lose. Trading is very risky but it can change your life!

Weekly GEX of SPX | Option Chain Analysis for Option TradersI’d like to share my thoughts below after analyzing the SPX option chain. In this analysis, I focus exclusively on the weekly time range, examining the SPX option chain and the changes in top-tier options metrics.
🔶 Breakout and Bullish Outlook
Last Friday's price action saw the SPX break through the 5800 call gamma wall, generating strong bullish momentum . This breakout opens the door for further upward movement throughout the week, especially if buying pressure persists. Breaking through a call gamma wall often leads to a rapid price increase, as these levels act as resistance, but once broken, they support further upward moves.
However, caution is advised, as additional call gamma levels (around 5850 and 5875) could act as resistance, where the price may stall. These levels can reverse roles and, if the price falters, could act as significant resistance, potentially leading to a pullback toward the 5800 level.
🔴 Put Skew and IVx Changes
The put pricing skew on the Options Oscillator shows a declining trend, meaning that while put options are still more expensive than calls at equivalent strikes, this trend is softening when looking at the November expiration. This indicates a weakening of put options relative to calls, which could be another bullish signal as demand for puts may be declining.
The five-day IVx average declining , indicating a decrease in market volatility = VIX is melting down.
🟨 Backwardation and Diagonal/Calendar Strategy Opportunities
It's also worth noting the 10.5% backwardation based on the IV skew for the expirations between 10/18 and 10/21 (4/7DTE). This backwardation (downward sloping volatility curve) could benefit calendar and diagonal spread strategies, as options with different expirations have varying volatility conditions.
🔶 GEX Wall Levels: Where Is Support and Resistance?
🔹Gamma Exposure (GEX) levels continue to play a crucial role in the market’s movements:
🔹On the upside, the largest call gamma wall for the next 7 days is at 5850, while the 5875 level may also act as significant resistance. The 5875 is a more likely a realistic bullish target, supported by the Options Overlay’s blue OTM delta 16 probability curve.
🔹On the downside, the 5750 put support level currently offers strong support, with sellers forming a barrier here. The 5800 level is also interesting because it was the largest call gamma level last week, meaning there could be significant volatility as bulls and bears battle around this point.
(NOTE: GEX levels is not part of the TanukiTrade Options Overlay indicator yet. The automatic GEX levels will be available by the end of October.)
🟨 How Delta 16 Curves Define My Rational Price Range in Options Trading
The blue OTM Delta 16 curves from the Options Overlay define the rational probability range for me based on a lognormal distribution. This is important because there’s a 68% chance the price will stay within this range by expiration. These values are also visible in the Overlay Expiry table.
This represents the 68% probability range defined by OTM 16 delta PUTs and OTM 16 delta CALLs, showing a clear directional expected move value. It provides an insightful view of the expected price movement’s directional range, often used by delta-neutral strangle traders like those at TastyTrade.
⅀ SPX Summary
The SPX options chain is showing a bullish direction with the breakout above 5800, but it will be key to watch the gamma levels where the market might stall this week. The rising IV and declining put skew trend could provide further signals that the bull market might continue, but the possibility of resistance or a pullback remains. For those considering diagonal strategies, the backwardation may offer interesting opportunities to capitalize on.
(NOTE: GEX levels is not part of the TanukiTrade Options Overlay indicator yet. The automatic GEX levels will be available soon, by the end of October!)

Options Blueprint Series [Intermediate]: Vega-Neutral Gold Play1. Introduction
Gold is currently in an uptrend, presenting a potentially favorable environment for bullish traders. However, with implied volatility (IV) sitting around its mean, there’s uncertainty about whether IV will rise or fall in the near future. In such a scenario, traders may want to neutralize their vega exposure to avoid being negatively affected by changes in volatility.
This article focuses on setting up a Call Ratio Spread, a bullish option strategy that provides positive delta while allowing for further adjustments that could keep vega neutral. This allows traders to capitalize on Gold’s potential uptrend while minimizing risk from changes in implied volatility.
2. Current Market Context
The Gold futures market shows strong levels of support, which reinforces the bullish outlook. On the continuous Gold futures chart above GC1!, we observe key support levels at 2646.2 and 2627.2-2572.5. These levels could act as price floors, helping the uptrend continue if tested.
Similarly, when examining the contract-specific below chart for GCQ2025, we identify supports at 2725.4 and 2729.5-2705.5. These levels provide solid ground for bullish trades on this specific contract, giving traders additional confidence in entering long positions.
With implied volatility near its average (see the chart below), the market’s future volatility direction is unclear. Traders using options may choose adapt to this environment, ensuring that changes in volatility do not work against them.
3. Options Strategy: Call Ratio Spread
To take advantage of Gold’s uptrend while neutralizing the risk from changes in volatility, we could employ a Call Ratio Spread. This strategy offers a bullish stance while maintaining vega neutrality, protecting the trader from swings in implied volatility.
Setup:
Buy 1x 2600 Call at 256.15
Sell 2x 3500 Calls at 23.32
Expiration: July 28, 2025
This configuration generates positive delta, meaning the strategy will benefit from upward price movement. At the same time, by selling two calls at a higher strike, we offset the vega exposure, ensuring that changes in volatility won’t dramatically affect the position.
The strike prices and expiration selected help create a risk profile that works well in a bullish market. The maximum gain potential occurs if Gold continues to rise but stays below the higher 3500 strike, while the vega neutrality minimizes any volatility risks as the trade begins.
Notice the breakeven point for this strategy is 2809.5, meaning the trade becomes profitable if Gold exceeds this level by expiration.
4. Why Use Micros?
Traders looking for a more flexible approach can consider using Micro Gold Futures (symbol: MGC) instead of standard Gold futures contracts. Micro Gold Futures offer smaller contract sizes, which translate into lower margin requirements and a more precise way to control risk. This makes them an attractive alternative for traders with smaller accounts or those looking to scale into positions gradually.
Additionally, Micro Gold Futures allow traders to fine-tune their exposure to Gold without the larger capital commitment required by standard contracts. For those implementing strategies like the Call Ratio Spread, Micros provide a cost-effective way to execute similar trades with a lower financial commitment.
Contract Specs and Margin Requirements
Gold Futures (symbol: GC) represent 100 troy ounces of gold, and their margin requirements can vary depending on market volatility and the broker. Typically, the initial margin requirement for a standard Gold futures contract is around $10,000 to $12,000, but this can fluctuate. For traders seeking more flexibility, Micro Gold Futures (symbol: MGC) offer a smaller contract size, representing 10 troy ounces of gold. The margin requirement for Micro Gold Futures is significantly lower, usually in the range of $1,000 to $1,200, making it a more accessible option for those with smaller accounts or those looking to fine-tune their exposure.
5. Risk Management
As with any options trade, managing risk is essential. In the case of a Call Ratio Spread, the primary risk comes from the naked short calls at the 3500 strike price. If Gold rallies aggressively beyond 3500, the trader faces unlimited risk due to the uncovered nature of the short positions.
To mitigate this risk, traders should consider using stop-loss orders or adjusting the trade if Gold's price approaches the 3500 level too quickly. Another way to eliminate the unlimited risk component to the upside would be to convert the Call Ratio Spread into a Call Butterfly by buying an additional call above the 3500 strike price, effectively capping the risk. This adjustment still allows for positive delta exposure while limiting potential losses if Gold moves sharply higher.
Additionally, monitoring implied volatility is key. While the position starts with neutral vega exposure, this will change as the underlying asset price moves and time passes, especially as expiration approaches. The vega exposure can increase or decrease depending on these factors. If maintaining the vega-neutral characteristic is a priority, further adjustments—such as rolling options or modifying strike prices—could be made to keep the position aligned with the trader’s volatility outlook.
When charting futures, the data provided could be delayed. Traders working with the ticker symbols discussed in this idea may prefer to use CME Group real-time data plan on TradingView: www.tradingview.com - This consideration is particularly important for shorter-term traders, whereas it may be less critical for those focused on longer-term trading strategies.
General Disclaimer:
The trade ideas presented herein are solely for illustrative purposes forming a part of a case study intended to demonstrate key principles in risk management within the context of the specific market scenarios discussed. These ideas are not to be interpreted as investment recommendations or financial advice. They do not endorse or promote any specific trading strategies, financial products, or services. The information provided is based on data believed to be reliable; however, its accuracy or completeness cannot be guaranteed. Trading in financial markets involves risks, including the potential loss of principal. Each individual should conduct their own research and consult with professional financial advisors before making any investment decisions. The author or publisher of this content bears no responsibility for any actions taken based on the information provided or for any resultant financial or other losses.

$BABA volatility pricing skew on CALL side before earningsThe high vertical CALL pricing skew on the options chain shows that the CALL options for the September expiration are already much more expensive than the PUT options at the same expected move distance. This suggests that market participants are pricing in an upward move.
Let's take a closer look at the probability curve formed by the options chain. I'm very curious to see whether the 8/8 to +1/8 quadrant line will hold the price for BABA, or if it will continue to surge into the Upper Extreme quadrant, heading towards +4/8 until $100.
If everything stays the same, something like this could be an interesting lottery ticket for me. I'm thinking about an OTM call butterfly with a short expiration before earnings.
I have to admit, I’m not a big fan of risking on this red/black roulette type of play, but if things stay as they are, I might consider combining it with a 40 or 68DTE credit put ratio below and the call butterfly above before earnings.
But we'll see how things look on the day before earnings!

Options Blueprint Series: Tailoring Yen Futures Delta ExposureIntroduction
In options trading, a Bull Call Spread is a popular strategy used to capitalize on price increases in the underlying asset. This strategy involves buying a call option at a lower strike price while simultaneously selling another call option at a higher strike price. The net effect is a debit trade, meaning the trader pays for the spread, but the risk is limited to this initial cost, and the profit potential is capped by the sold call option's strike price.
For traders interested in Japanese Yen Futures, the Bull Call Spread offers a way to potentially profit from expected upward movements while managing risk effectively. Delta exposure, which measures the sensitivity of an option's price to changes in the price of the underlying asset, is a crucial aspect of this strategy. By carefully selecting the strike prices of the options involved, traders can tailor their delta exposure to match their market outlook and risk tolerance.
In this article, we will delve into the mechanics of Bull Call Spreads, explore how varying the sold unit's strike price impacts delta exposure, and present a practical case study using Japanese Yen Futures to illustrate these concepts.
Mechanics of Bull Call Spreads
A Bull Call Spread is typically constructed by purchasing an at-the-money (ATM) call option and selling an out-of-the-money (OTM) call option. This strategy is designed to take advantage of a moderate rise in the price of the underlying asset, in this case, Japanese Yen Futures.
Components of a Bull Call Spread:
Buying the ATM Call Option: This option is purchased at a strike price close to the current price of the underlying asset. The ATM call option has a higher delta, meaning its price is more sensitive to changes in the price of the underlying asset.
Selling the OTM Call Option: This option is sold at a higher strike price. The OTM call option has a lower delta, reducing the overall cost of the spread but also capping the profit potential.
Delta in Options Trading:
Delta represents the rate of change in an option's price concerning a one-unit change in the price of the underlying asset. For call options, delta ranges from 0 to 1:
ATM Call Option: Typically has a delta around 0.5, meaning if the underlying asset's price increases by one unit, the call option's price is expected to increase by 0.5 units.
OTM Call Option: Has a lower delta, typically less than 0.5, indicating less sensitivity to changes in the price of the underlying asset.
By combining these two options, traders can create a position with a desired delta exposure, managing both risk and potential reward. The selection of strike prices is crucial as it determines the overall delta exposure of the Bull Call Spread.
Impact of Strike Price on Delta Exposure
Delta exposure in a Bull Call Spread is a crucial factor in determining the overall sensitivity of the position to changes in the price of the underlying asset. By adjusting the strike price of the sold call option, traders can fine-tune their delta exposure to align with their market expectations and risk management preferences.
How Delta Exposure Works:
Higher Strike Price for the Sold Call Option: When the strike price of the sold call option is higher, the overall delta exposure of the Bull Call Spread increases. This is because the sold option has a lower delta, contributing less to offsetting the delta of the purchased call option.
Lower Strike Price for the Sold Call Option: Conversely, a lower strike price for the sold call option decreases the overall delta exposure. The sold option's higher delta offsets more of the delta from the purchased option, resulting in a lower net delta for the spread.
Examples of Delta Exposure:
Example 1: Buying a call option with a strike price of 0.0064 and selling a call option with a strike price of 0.0065.
Purchased call option delta: 0.51
Sold call option delta: 0.34
Net delta: 0.51 - 0.34 = 0.17
Example 2: Buying a call option with a strike price of 0.0064 and selling a call option with a strike price of 0.0066.
Purchased call option delta: 0.51
Sold call option delta: 0.21
Net delta: 0.51 - 0.21 = 0.29
As illustrated, the higher the strike price of the sold call option, the greater the net delta exposure. This increased delta indicates that the position is more sensitive to changes in the price of Japanese Yen Futures, allowing traders to capitalize on more significant price movements. Conversely, a lower strike price reduces delta exposure, making the position less sensitive to price changes but also limiting potential gains.
Case Study: Japanese Yen Futures
Market Scenario: Recently, a downtrend in Japanese Yen Futures appears to have potentially reversed, presenting an opportunity to capitalize on a new potential upward movement. To take advantage of this potential uptrend, we will construct a Bull Call Spread with specific entry, stop loss, and target prices based on Yen Futures prices (underlying).
Underlying Trade Setup
Entry Price: 0.0064
Stop Loss Price: 0.00633
Target Price: 0.00674
Point Values and Margin Requirements
Point Values: For Japanese Yen Futures, each tick (0.0000005) equals $6.25. Therefore, a movement from 0.0064 to 0.0065 represents a 200-tick change, which equals $1,250 per contract.
Margin Requirements: Margin requirements for Japanese Yen Futures vary but are currently set at $2,800 per contract on the CME Group website. This amount represents the minimum amount of funds required to maintain the futures position.
Valid Bull Call Spread Setup
Given the current market scenario, the following setup is selected:
1. Purchased Call Option
Strike Price: 0.0064 (ATM)
Delta: 0.51
2. Sold Call Option Variations
Strike Price 0.0068:
Delta: 0.08
3. Net Delta: 0.42
Reward-to-Risk Ratio Calculation
Due to the limited risk profile of Debit Spreads, where the maximum potential loss is confined to the initial debit paid, stop loss orders will not be factored into this reward-to-risk ratio calculation.
Debit Paid: 0.000085 (call purchased) - 0.000015 (call sold) = 0.00007
Potential Gain: Sold Strike - Strike Bought - Debit Paid = 0.0068 - 0.0064 - 0.00007 = 0.00033
Potential Loss: Debit Paid = 0.00007
Reward-to-Risk Ratio: 0.00033 / 0.00007 ≈ 4.71
This ratio indicates a favorable risk-reward setup, as the potential reward is significantly higher than the risk.
Conclusion
In this article, we have explored the intricacies of using Bull Call Spreads to tailor delta exposure in Japanese Yen Futures trading. By strategically selecting the strike prices for the options involved, traders can effectively manage their delta exposure, aligning their positions with their market outlook and risk tolerance.
Key Points Recapped:
Bull Call Spreads: This strategy involves buying an at-the-money (ATM) call option and selling an out-of-the-money (OTM) call option to capitalize on moderate upward price movements.
Delta Exposure: The delta of the options involved plays a crucial role in determining the overall sensitivity of the spread to price changes in the underlying asset.
Strike Price Variations: Adjusting the strike price of the sold call option can significantly impact the net delta exposure, offering traders the flexibility to fine-tune their positions.
Case Study: A practical example using Japanese Yen Futures illustrated how varying the sold unit's strike price changes the delta exposure, providing concrete insights into the strategy.
Risk Management: We always emphasize the importance of stop loss orders, hedging techniques, avoiding undefined risk exposure, and precise entries and exits ensures that trades are structured with proper risk controls.
By understanding and applying these principles, traders can enhance their ability to navigate the complexities of options trading, making informed decisions that align with their trading objectives.
When charting futures, the data provided could be delayed. Traders working with the ticker symbols discussed in this idea may prefer to use CME Group real-time data plan on TradingView: www.tradingview.com This consideration is particularly important for shorter-term traders, whereas it may be less critical for those focused on longer-term trading strategies.
General Disclaimer:
The trade ideas presented herein are solely for illustrative purposes forming a part of a case study intended to demonstrate key principles in risk management within the context of the specific market scenarios discussed. These ideas are not to be interpreted as investment recommendations or financial advice. They do not endorse or promote any specific trading strategies, financial products, or services. The information provided is based on data believed to be reliable; however, its accuracy or completeness cannot be guaranteed. Trading in financial markets involves risks, including the potential loss of principal. Each individual should conduct their own research and consult with professional financial advisors before making any investment decisions. The author or publisher of this content bears no responsibility for any actions taken based on the information provided or for any resultant financial or other losses.

Buy call option – at the money / in the money / out of the moneyDefinitions
Buy call option – a stock option is the right to buy a stock (but not the obligation) at a certain price for a limited period of time. The price at which the stock may be bought is called the striking price.
Three terms describe the relationship between the stock price and the options striking price: At the money / In the money / Out of the money
For example; stock XYZ trade at $100
At the money – the strike price of the option is $100
In the money - the strike price of the option is $90
Out of the money – the strike price of the option is $110
The strike price is one of the 6 factors that determine the price of the option.
Those factors are:
1. The price of the stock
2. The strike price of the option
3. The time until the option expires
4. The volatility of the stock also called “implied volatility”
5. The risk-free interest rate (usually the 90-day treasury bills)
6. The dividend rate of the stock.
The last two have less influence on the option price.
The option pricing has two elements, “time premium” and “intrinsic value”.
In this post, I’m not going to elaborate on those two. (But they are important to understand).
The Delta
The delta of an option is the amount by which the call option will increase or decrease in price if the stock moves by 1 point. The values of the delta are between zero to one, if the call option is in the money the delta is closer to 1 if the call option is out of the money the delta is closer to 0.
For example; if the stock option has a delta value of 0.8, this means that if the stock increases or decreases in price by $1 per share, the option price will rise or fall by $0.8.
The option pricing is based on a partial differential equation because of that the behaver of the option pricing is not linear, as we can see from the charts.
In the right chart, we see In the money option with a delta of 0.92, meaning the option price is behaving very similar to the stock price, we see that the lines are nearly flat.
In the left chart, we see Out of the money option with a delta of 0.12, meaning the option price does not move like the stock price, for every $1 the stock will move the option price will move $0.12.
Also, note the difference between the profit lines, to make 3 points with In the money option the stock needs to move to above $190, but the Out of the money option needs only to move above $145.
This was the profit side, the losing side as you can see if the stock will remain at the same place the In the money options will break-even while the Out of the money options will expire worthless and will lose 1 point.
The options that were used (input):
Right chart: Option price -> $25.9, Stock price -> $115 , Strike price -> 90$ , Interest rate -> 0 , Days to expire -> 56 , Implied volatility -> 40.8%
Left chart: Option price -> $1.17, Stock price -> $115 , Strike price -> $140 , Interest rate -> 0 , Days to expire -> 56 , Implied volatility -> 40.8%
One option contract is the right to buy 100 shares so the cost for the options would be: $2590 and $117 respectively, not include commissions.
For clarification: If you hold it to expiration and it is not worthless, that means you need to buy 100 shares at the strike price, $9000 in the right chart, $14,000 in the left chart. (not include what you already paid)

DAL Delta Air Lines Options Ahead of EarningsIf you haven`t bought the dip on DAL:
Now analyzing the options chain and the chart patterns of DAL Delta Air Lines prior to the earnings report this week,
I would consider purchasing the 46usd strike price Calls with
an expiration date of 2024-7-19,
for a premium of approximately $1.74.
If these options prove to be profitable prior to the earnings release, I would sell at least half of them.
=

Out perform Sector This week 7/06/24Hello All, ETRON Sector that is first leading sector this week, Stronger than others.
look that it seem price break accumulation ready to test EMA200, please closely look at that point.
Delta already bull little bit.
KCE Already break accu. phase just starting.
HANA Follow ...
CCET That is leading stock for this sector

Looking for a bullish swing on DAL today at close!🔉Sound on!🔉
Thank you as always for watching my videos. I hope that you learned something very educational! Please feel free to like, share, and comment on this post. Remember only risk what you are willing to lose. Trading is very risky but it can change your life!

Bearish Movement expected. Dont be the Liquidity! pt4Look to all this Negative Delta. We are on Daily TF. BTC will fall and I strongly suggest that you protect your capital.
When media is fully bullish, and everybody is talking about BTC going to the moon and the bullish effect of Halving.. thats the moment when MMakers will rekt almost everybody.
Remember this wise phrase: buy with the rumor and sell with the new.
Even if we see a bullish manipulation to the upside, everything is pointing to lower prices.
Below actual price there is a lot of available Liquidity and it needs to be recapitalized.
Bearish signs are present since days ago. This is my 4th Update trying to warn people.
Be careful.
