UNI - Long idea.BINANCE:UNIUSDT.P
I am waiting for a reaction at this level. The nearest target is to break through the $6.1 high.
Add it to your watch list. Set alerts and wait for the price to approach the level.
I will not short. I will work strictly from the level.
DEX

THE - Update!TSX:THE / USDT - Update:
My medium-term outlook remains unchanged 📈
Wave 3 hasn't even started yet!🚀
Very bullish fundamentals & chart structure (daily).
Short term doesn't matter to me here 📈
Review my previous analyses for more levels!
Key support to be maintained; 0.1680$ & 0.1630$ (daily close) ⚠️
📊 Key S/R levels marked in my chart.
⚠️ Not financial advice - DYOR.

Could Altcoins bottom before BITCOINIn Q2 of 2026 vs a longer slower drawn out BTC bear that bottoms in Q3 or Q4 in line with the 4 year cycle which forecasts Oct/Nov of 2026.
It would surprise many participants in #Crypto
To see a still falling BTC price but #Ethereum, #SOLANA and select altcoins rallying on their /BTC pairs.
We shall be watching and monitoring.
What do you think?
This chart is of PULSEX a DEX on a Ethereum sidechain is pointing towards a pee off the roof inverted banana zone waterfall price action.
Which may correlate to an ETH decline sub $2k...?

The - bullish setup ongoing TSX:THE - bullish setup ongoing 📈
I'll hold for some days, SWING play here with a 20%+ pump potential.
Low leverage, less stress, but usually more gains in a full setup play!.
#dyor if you follow!

FireHoseReel | Aster DEEP ReSearch: EP5 - Inside ASTER Economy🔥 Welcome To FireHoseReel !
Let's dive into Aster Deep ReSearch EP 5 - Inside the ASTER Token Economy
🪙 Token Launch & Hype
In September 2025, ASTER officially launched and instantly grabbed headlines. Within just days, its price surged over +2000%, reaching nearly $1.90, pushing Aster’s market cap beyond $3 billion. This explosive move was fueled by a powerful combo of marketing hype, backing from CZ, and a uniquely structured community rewards model.
🎁 Aster allocated over 50% of total supply to airdrops, liquidity incentives, and referrals — creating one of the widest token distributions in DeFi. Just 24 hours after launch, more than 330K new wallets were activated on the platform.
🧬 ASTER Token Utility – Not Just Governance
ASTER isn't just a passive governance token. Its utility spans multiple layers across the Aster ecosystem:
🗳 Governance: Token holders can vote on key protocol decisions and platform upgrades.
💸 Fee Discounts & Premium Access (future): Holding ASTER may unlock lower trading fees or access to Pro features, similar to Binance’s BNB model.
🎯 Liquidity Incentives: ASTER powers LP rewards, referral programs, and ecosystem growth incentives.
💰 Staking & Margin Collateral: Users can stake ASTER to earn ~5–7% APY and simultaneously use up to 80% of staked value as margin in Aster Pro.
🔥 Aster also introduced a token-burning mechanism (approx. 5–7% annually) to control inflation and support long-term price stability.
⚠️ Challenges Ahead
While the generous airdrop strategy helped bootstrap adoption, it also introduces inflation risk and potential sell pressure if demand doesn't scale.
Aster’s long-term success depends on deep integration of ASTER within trading, governance, and infrastructure — especially as it rolls out its own Layer-1 chain (Aster Chain) with native utilities tied to the token.

TradeCityPro | HYPE Near Breakdown Zone, Bears Gaining Control👋 Welcome to TradeCityPro!
In this analysis, I want to review HYPE, one of the well-known decentralized exchanges in crypto. The exchange’s native token currently has a $10.46 billion market cap, ranking 11th on CoinMarketCap.
🗓 Daily Timeframe
On the daily timeframe, this coin had been moving inside a rising channel, which was already broken in the previous analysis, and we were waiting for its trigger to activate.
✔️ The trigger for confirming the channel breakdown was 36.682, but since there was a major support zone right beneath it, we needed to wait for the price to stabilize below that support to confirm a bearish trend.
📊 After reacting to 36.682, the price made a deep pullback to the channel, and after getting rejected from the channel again, it continued moving downward.
💥 Following this pullback, the RSI dropped back below the 50 level, signaling a return of bearish momentum, and all that remained was a price confirmation for the downtrend to fully establish.
🧮 After breaking 36.682, the price reached the $30 zone for the first time and reacted to it. Currently, after pulling back to 36.682, the price looks ready to continue its bearish move.
🔔 The confirmation for HYPE turning fully bearish comes with a break of 29.9.
Once this level breaks, we can open a short position.
⚖️ RSI staying below 50 and avoiding any overbought conditions — along with weak buying volume — are strong signs that the bearish trend can continue.
As long as RSI remains under the 50 zone, the market structure remains bearish in my view.
📝 Final Thoughts
Stay calm, trade wisely, and let's capture the market's best opportunities!
This analysis reflects our opinions and is not financial advice.
Share your thoughts in the comments, and don’t forget to share this analysis with your friends! ❤️

ONLY WAY IS UP - SUNDAEHear me now, the only way is up for SUNDAE. May drop down to the .004cent range but that will be a perfect buying opportunity.
- current market cap is 12million
- current TVL is 14.3million
- Sundae Labs is already familiar with Hydra (which is under construction) but would drastically reduce fees and increase transaction speed
- Governance to come
- Reduced fees for SUNDAE holders to come
SUPER UNDERVALUED. This will likely be a 200million DEX at minimum during the next bull run

TradeCityPro | CRV in a Key Zone: Watch for Breakouts or Drops👋 Welcome to TradeCity Pro!
Let’s dive into the CRV coin analysis. It's one of the popular DeFi projects, with a market cap of $608 million, currently ranked 89th on CoinMarketCap.
⏳ 4-Hour Timeframe
On the 4-hour timeframe, this coin is currently sitting on a very important support level and has just bounced up from it.
✔️ In this recent bearish leg, as Bitcoin’s dominance dropped, most altcoins declined less than Bitcoin.
One of these altcoins is CRV, which, as you can see, hasn’t yet lost its support zone.
🔽 For a short position, we can enter if the support level breaks. For an early entry, considering the bearish trend of this coin, we can use momentum triggers like candlestick setups.
🧩 On the other hand, if the price can stabilize above 0.4496, it will be the first sign of a trend reversal to the upside, and we can use this trigger to open a long position.
💡 Personally, I prefer to wait until the price forms a higher high and higher low above 0.4496 before entering. The main confirmation of the trend change will come after breaking 0.5240.
📝 Final Thoughts
Stay calm, trade wisely, and let's capture the market's best opportunities!
This analysis reflects our opinions and is not financial advice.
Share your thoughts in the comments, and don’t forget to share this analysis with your friends! ❤️

#UNI --- Uniswap to soar back into the 20'sAs a brand
how do u compete with a leader
Uniswap being the leader of on-chain exchange
Coke is the brand to invest in
(what stock did Buffet buy?)
not Pepsi
not RC cola
Do you get where I'm coming from
And I am not getting into to who, what or how
they have been infiltrated
but clearly they have
As an investor
you MUST pick the best of breed
That has historically been the best route to success.
UNI to rip is my prediction

TradeCityPro | JUP Bearish Bias Near Key Support Zones👋 Welcome to TradeCity Pro!
In this analysis, I want to review the JUP coin,one of the projects in the Solana ecosystem, with a market cap of $1.09 billion, currently ranked 64th on CoinMarketCap.
⏳ 1-Hour Timeframe
On the 1-hour timeframe, this coin has formed a structure between the 0.3357 and 0.3591 levels, and has already faked out the range once to the upside and once to the downside.
🔍 After the fakeout to the upside, the price made a downward move toward the 0.3357 support, and as you can see, the selling volume in the red candles has been very strong.
🎲 At the moment, I believe the sellers have much more control in the market compared to the buyers, so the probability of a further downward move is higher for now.
📈 In that case, we can open a short position if the 0.3357 level breaks. One important thing to note is that the zone between 0.3260 and 0.3357 is a very strong support area where many buyers are active.
📊 So if buying volume enters this range, we may see a shift in market strength. In that case, breaking the 0.3488 level could give us a long position.
📈 The main long trigger for this coin is at 0.3591. However, since the price has already faked this level once, it's better to wait for a reaction to refine the exact breakout point.
📝 Final Thoughts
Stay calm, trade wisely, and let's capture the market's best opportunities!
This analysis reflects our opinions and is not financial advice.
Share your thoughts in the comments, and don’t forget to share this analysis with your friends! ❤️

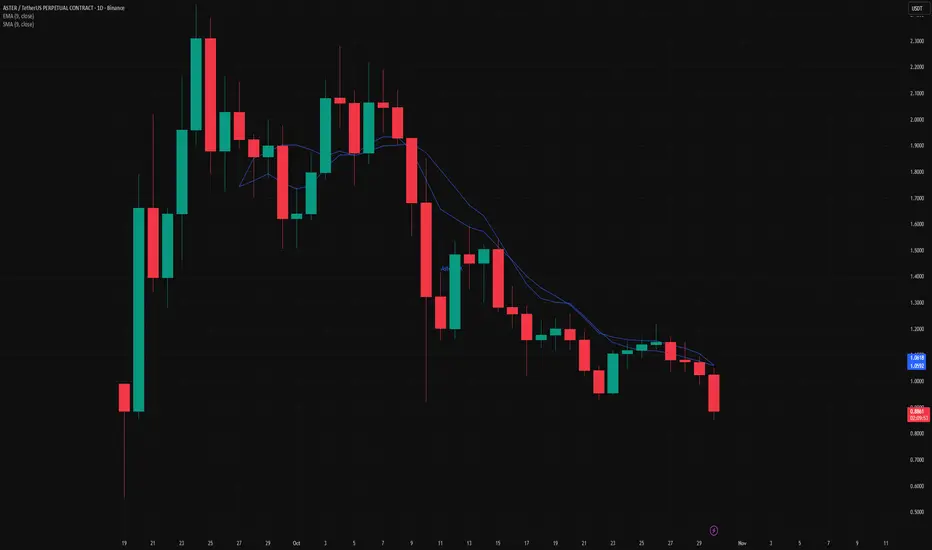
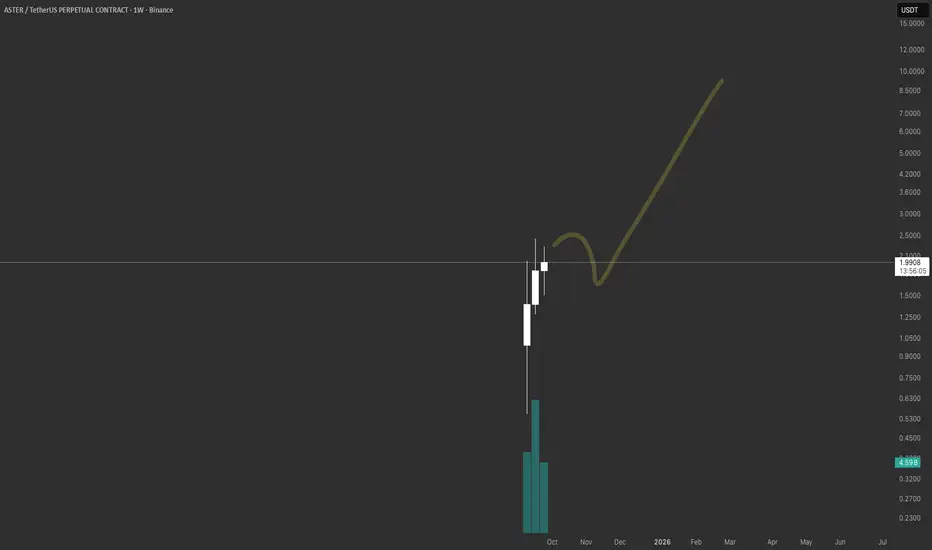
Why you should actually be bullish on ASTERASTER price action has people confused.
Short-term thinking always blinds investors.
ASTER went from $0 to $4B market cap in one week while the market dumped. It is six weeks old, already top 45, and still above $2B market cap.
The Dex has done 2.85T in trading volume with over 5M users. The team announced that 70–80% of all trading fees go to buybacks of $ASTER. This changes the math. Strong volume. Strong user base. Strong tokenomics.
ASTER is the Perp DEX of Binance, backed by CZ and YZILabs. HYPE reached a $20B market cap in under a year. ASTER is following the same pattern with better fundamentals.
Key points: $4B+ market cap in week one 2.85T total trading volume 5M+ users 70–80% fee buybacks Binance ecosystem backing DEX will outlast CEX.
Hold this long term.
TradeCityPro | CAKE: Range Squeeze, Breakout Imminent👋 Welcome to TradeCity Pro!
In this analysis, I want to review the CAKE coin, one of the DeFi projects active on the BNB network with a market cap of 916 million USD, ranked 74th on CoinMarketCap.
⏳ 1-Hour Timeframe
This coin is currently in a small range box on the 1-hour timeframe, and this tight range has reduced its price fluctuation.
✨ This compression indicates that, if the box is broken, price could make a sharp move.
⭐ Currently, price is at the bottom of this compression and has entered a key support zone.
✔️ If the support zone breaks, the downward move for CAKE will resume, so we can open a short position if the level is broken.
📊 However, if price finds support at this level and moves upward, we can open a long position once 2.785 is broken.
💥 Both triggers for long and short are highly risky. For more reliable triggers, for a long position, we should wait for the break of 3.017, and for a short, we would look for a lower high and low below the support zone.
📝 Final Thoughts
Stay calm, trade wisely, and let's capture the market's best opportunities!
This analysis reflects our opinions and is not financial advice.
Share your thoughts in the comments, and don’t forget to share this analysis with your friends! ❤️

The Best DEX & Token PotentialAVNT #LONG
Potential for 130% growth .
You can go long on spot or with a small leverage.
Token from a DEX, the exchange is good , the drop was awesome , staking their token with a good interest rate is available, the team's cliff is long, so there is an incentive to push the price up .

CAKEUSDT – Potential Recovery Setup Amid BNB Ecosystem StrengthCAKE remains one of the most active decentralized exchanges by volume, maintaining strong relevance alongside UNI. With renewed bullish momentum across the BNB ecosystem, CAKE may be poised for a recovery after a recent breakdown.
Price action is approaching a key support zone between $1.93 and $2.09, which could serve as a base for accumulation. If the level holds and broader sentiment improves, this area offers a strategic long setup targeting higher resistance zones.
Upside targets are defined at $2.70 and $4.20, with a stop loss below $1.66 to manage risk. This idea hinges on stabilization in the crypto market and continued strength in BNB-related projects.
Levels:
Entry Zone: $1.93–$2.09
Targets: $2.70, $4.20
Stop Loss: Below $1.66

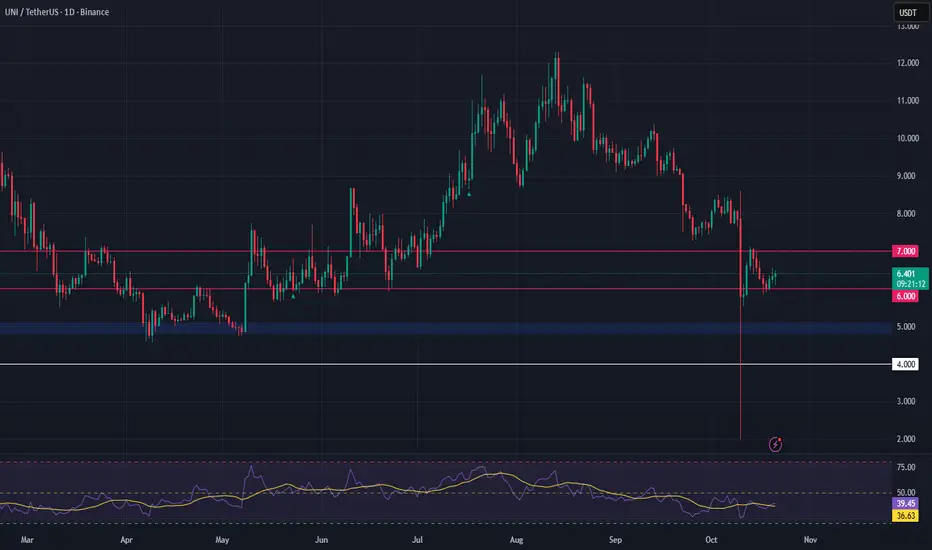
UNI/USDT – Bullish Setup as Uniswap Expands Cross-Chain AccessUniswap just integrated Solana into its Web App, enabling swaps across Ethereum and 13+ other networks. This move significantly expands Uniswap’s ecosystem and could drive a surge in DEX volumes, adding fundamental strength to UNI.
Technically, UNI is trading near a key accumulation zone between $4.80–$5.10. A sustained hold within this range offers a potential long opportunity, especially as momentum picks up with this major protocol update.
🔹 Entry Zone: $4.80–$5.10
🔹 Targets: $6.00, $7.09
🔹 Stop Loss: Below $4.00
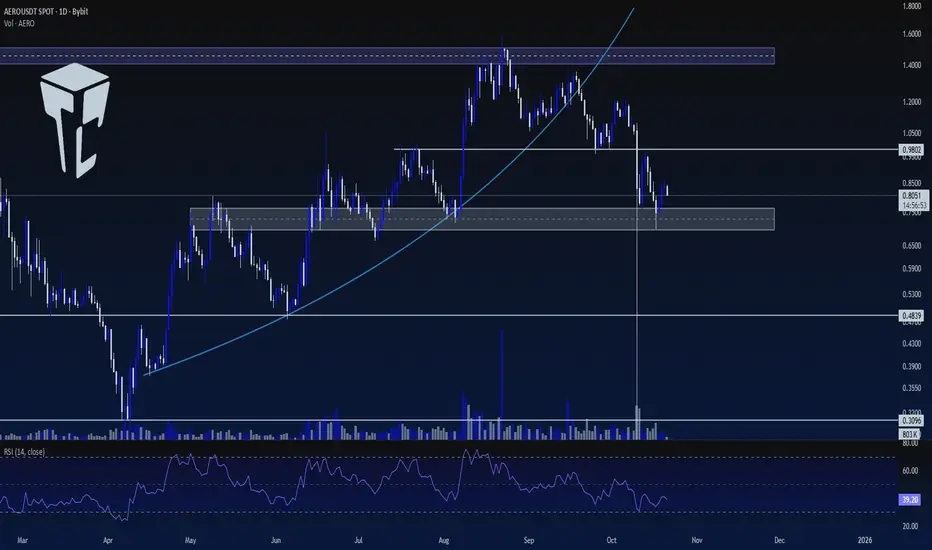
TradeCityPro | AERO: Testing Support After Trendline Break👋 Welcome to TradeCity Pro!
In this analysis, I want to review the AERO coin for you. This project is one of the well-known DEXs, ranked 84th on CoinMarketCap with a market cap of $727 million.
📅 Daily Timeframe
In the daily timeframe, since the last time I analyzed it for you, the coin has been rejected from its resistance zone and has broken its curved trendline.
✨ With the break of this trendline and the activation of the 0.9802 trigger, the bearish move of this coin has continued, and the price has dropped to around $0.7.
💥 Currently, the price is still sitting on this support zone and has penetrated it twice so far. If this level breaks, the trend of this coin will turn bearish.
🧮 In that case, we can open a short position on the break of this zone. The next support levels are 0.4839 and 0.3096.
📊 For a long position, we can act after the price stabilizes above 0.9802. The main trigger for the bullish trend will be breaking the 1.5$ zone.
📝 Final Thoughts
Stay calm, trade wisely, and let's capture the market's best opportunities!
This analysis reflects our opinions and is not financial advice.
Share your thoughts in the comments, and don’t forget to share this analysis with your friends! ❤️
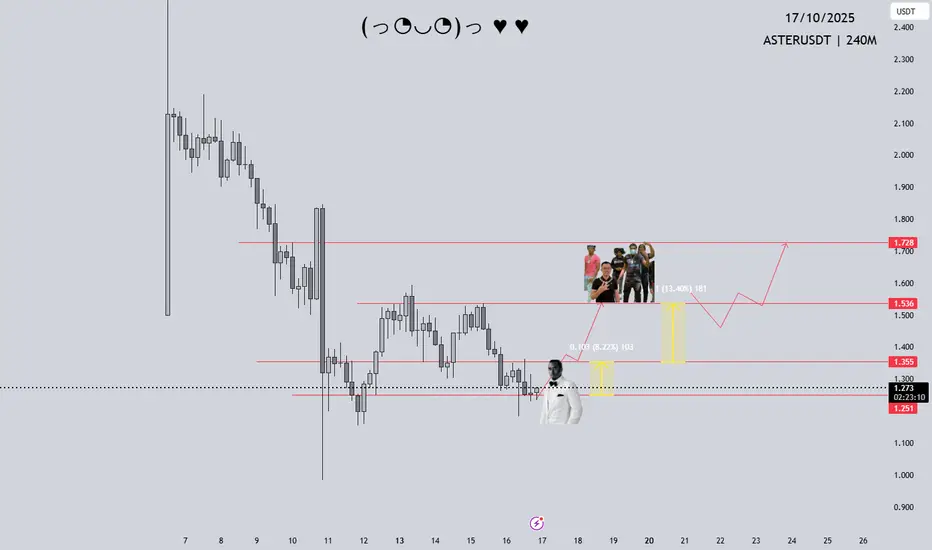
$ASTER wait for 4H close above and Diddy will hang out with CZSEED_WANDERIN_JIMZIP900:ASTER wait for 4H close above and Diddy will hang out with CZ #four4444 #ASTER #EpsteinFiles #diddyparty #DEX
Hyperliquid Price Scenario 10/15Wait for Liquidity sweep and close of candle above range on the 4hr timeframe to confirm entry. Manage risk accordingly, if price fails to close above range then entry is not valid.

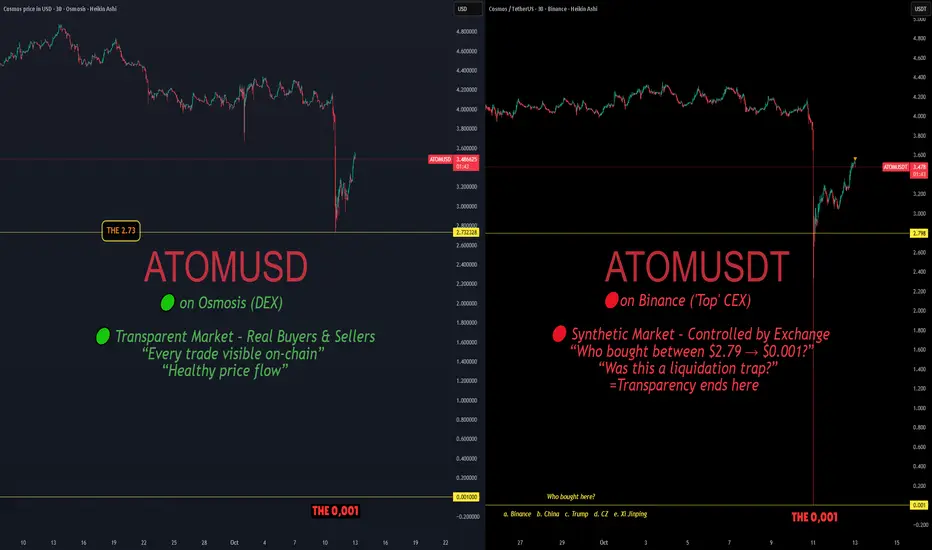
The Problem With Crypto –Part2: The Illusion of Decentralization🧠 The Problem With Crypto – Part 2: The Illusion of Decentralization
Same token.
Same moment.
Two realities.
🟢 ATOM/USD on Osmosis (DEX)
Transparent market — every trade visible on-chain.
Real buyers. Real sellers. Healthy price flow.
🔴 ATOM/USDT on Binance (CEX)
Synthetic market — controlled by the exchange.
Price collapsed to 0.001 USDT.
Who bought there?
Was it a trader, a market maker… or the house itself?
If it was the exchange — we deserve answers.
If it was a “partner” — expose it.
If it was “normal system behavior,” then the system is built to harvest.
On-chain markets move by human action.
Off-chain markets move by design.
And behind that design… there’s the Dragon behind the curtain. 🐉
We’ll dive deeper into that in a next episode.
One Love,
The FXPROFESSOR💙
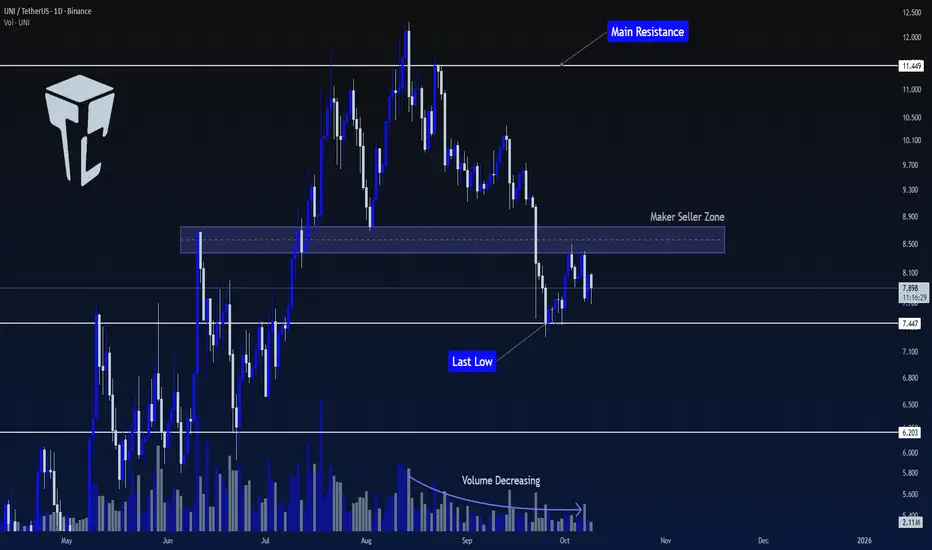
TradeCityPro | UNI: Key Levels and Bullish Continuation Setup👋 Welcome to TradeCity Pro!
In this analysis, I’m going to review UNI, one of the most popular DEX projects within the Ethereum ecosystem, with a market cap of $4.93 billion, ranking 28th on CoinMarketCap.
📅 Daily Timeframe
This coin has shown a strong upward move reaching 11.449 and then started a correction. After the failure at this level, a downward move began.
🧩 An important support zone around $8.5 has formed, which after breaking, is now acting as resistance.
✅ During this downward movement, the volume has been decreasing. Despite having two down legs so far, it can be said that the overall trend for this coin is still bullish.
📊 For a long position, the first trigger we have is the break of the Maker Seller level. Breaking this level will remove a lot of selling pressure, which could cause a sharp upward move in price.
🛒 The spot trigger for UNI is at 11.449. I recommend opening a long position after breaking the level, and using the profits from that position to buy this coin when the spot trigger is activated.
💥 For a short position, the trigger is 7.447. If the price ranges a bit longer in this area and then breaks the low, it would make a great position. However, if the price breaks the level right now, it would be a risky trigger.
📝 Final Thoughts
Stay calm, trade wisely, and let's capture the market's best opportunities!
This analysis reflects our opinions and is not financial advice.
Share your thoughts in the comments, and don’t forget to share this analysis with your friends! ❤️
AAVE/USDT;BUY LIMITHello friends
Given the price reaching the specified support and the strong support of the price by buyers in the specified range and the failure of the specified resistance, we can buy in steps with risk and capital management and move to the specified targets.
*Trade safely with us*

$ASTER setup looks unstoppable.Backed by CZ.
$ASTER isn’t just another token, it’s the only DEX with direct ties to Binance’s founder. That alone gives it massive trust and liquidity potential.
Strong base at $1 . Let’s be real, CZ won’t let it break, but still, stay cautious of short-term spikes .
Technically, $4 looks inevitable , and $10’s on the table if $ASTER starts closing the gap with BINANCEUS:HYPEUSDT market cap (maybe not this cycle, but it’s coming)
Hidden Order system gives pro traders stealth execution, and buyback rumors could fuel the next expansion phase.
Hyperliquid stays a beast, but $ASTER setup is one of the cleanest plays this cycle.
DYOR, but fading $ASTER might age badly.
BB - MORNING VIEW VS NOW! ON POINT AGAINNYSE:BB - morning view vs now ... 🔥
11% up already, is it just getting started?? 👀
TA & FA are solid🚀
