Unisawp Possible Bullish Move to 9dollarsCHoCH on the 4hr TF, signifying a bullish move and price also heading to a Buy Zone after sweeping liquidity. price possible heading to 9 dollars.
Remember: Risk Management very important.
Key stats
About Uniswap
Uniswap is the big dog in the decentralized exchange game with over 1tn in trading volume on the board. The Uniswap Protocol itself provides liquidity and trading for ERC20 tokens on Ethereum, but, unlike a centralized exchange, it cuts the need for a trusted intermediary that can charge fees or require know your customer (KYC) information. Its native token, UNI, enables community ownership and active stewardship of the protocol through governance.

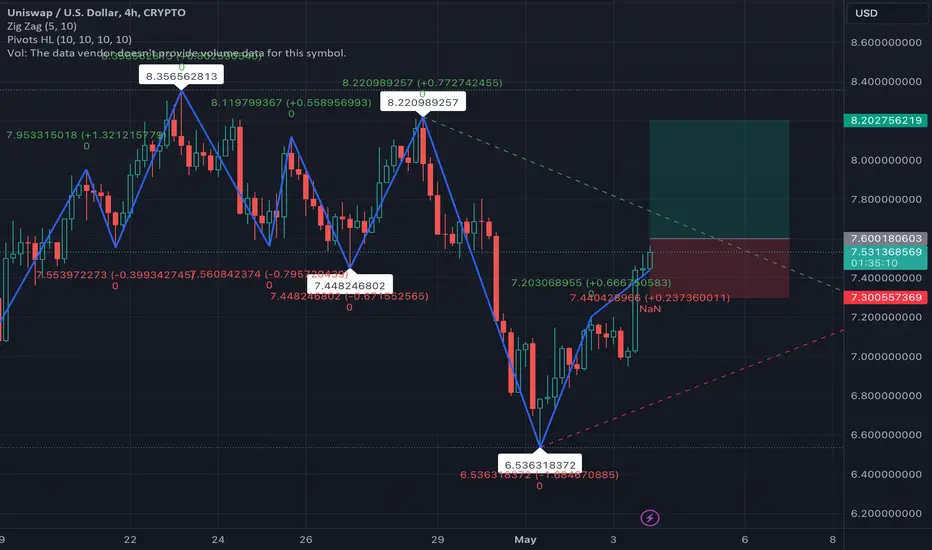
Uniswap _ Next Target is Triangle Target _ Make a +82% PROFITTriangle Pattern Forming and Expecting Breakout... Offering a Chance to Make +82% Percentage Profit.

Uni to shortUni is travelling in a downward channel. one can take a short entry here at 7.98869. for target price of 6.8136000 while stoploss will be 8.4406450.

Uniswap / U.S. Dollar Distribution price Uniswap / U.S. Dollar Distribution price
I will not be spending time on this asset class as it is clear where is heading and where will be dropping. Bad data management!
$12.565
$15.402
$16.103
Distribution price : $16.552
2 Facts for incoming Bearish move:
(1) The distribution price creat

(UNI) uniswapauto fib and auto retrace overlay on top of one another for uniswap chart looks like a song that used to play on the radio by a band called foreigner.

Uniswap Foundation Reveals It has $41 Million in Funding The Uniswap Foundation has disclosed that it holds $41.41 million in fiat cash and stablecoins on hand, with an estimated runway through the end of 2025. The foundation plans to use the fiat currency and stablecoins for grant commitments and operating activities, while the CRYPTOCAP:UNI tokens are

New up trend started?One of the few protocols that generates revenue (and a ton!). When the regulatory issues clear this should perform well.

Uniswap Introduces ERC-7683 Token Standard, Breakout Lurking Uniswap Labs has introduced ERC-7683, a new token standard designed to streamline cross-chain trading solutions. The standard, which aims to establish a unified framework for intents-based systems to specify cross-chain actions, was proposed in collaboration with the Across Protocol. The standard ou

Technical Analysis Report: Uniswap (UNI/USD)Uniswap (UNI/USD) has exhibited significant volatility in the recent trading sessions, navigating through various technical setups and indicators that warrant a detailed analysis. Herein, we delve into the current price trends, supported by a mix of oscillators, moving averages, and volume indicator
Regular Bearish Divergence on the 4H UNI/USD (Uniswap)**UNI/USD 4H Chart Analysis**
As we examine the 4-hour chart for Uniswap (UNI/USD), a noteworthy pattern emerges, signaling potential trading opportunities. The price trajectory is forming higher highs, a bullish signal under normal circumstances. However, a deeper look with the Commodity Channel I

See all ideas
Curated watchlists where UNIUSD is featured.

AMM Coins: Automation is coming to a farm near you
20 No. of Symbols

Crypto tokens: Chips and dips
24 No. of Symbols

Decentralized Exchange Tokens: Risky business?
22 No. of Symbols

DeFi Tokens: Finance 2.0
24 No. of Symbols

ETH-based crypto: Find your utility
38 No. of Symbols

Exchange Based Tokens: Follow the leader
25 No. of Symbols

Gen 3 crypto: A new day dawns…
25 No. of Symbols

Staking Coins: Pick up a stake
18 No. of Symbols

Top altcoins: Choose your alternatives carefully
28 No. of Symbols
See all sparks
Frequently Asked Questions
The current price of Uniswap (UNI) is 7.624 USD — it has fallen 0.73% in the past 24 hours. Try placing this info into the context by checking out what coins are also gaining and losing at the moment and seeing UNI price chart.
The current market capitalization of Uniswap (UNI) is 4.57 B USD. To see this number in a context check out our list of crypto coins ranked by their market caps or see crypto market cap charts.
Uniswap (UNI) trading volume in 24 hours is 100.10 M USD. See how often other coins are traded in this list.
Uniswap price has fallen by 4.72% over the last week, its month performance shows a 18.78% decrease, and as for the last year, Uniswap has increased by 29.88%. See more dynamics on UNI price chart.
Keep track of coins' changes with our Crypto heatmap.
Keep track of coins' changes with our Crypto heatmap.
Uniswap (UNI) reached its highest price on May 3, 2021 — it amounted to 45.024 USD. Find more insights on the UNI price chart.
See the list of crypto gainers and choose what best fits your strategy.
See the list of crypto gainers and choose what best fits your strategy.
Uniswap (UNI) reached the lowest price of 0.470 USD on Sep 17, 2020. View more Uniswap dynamics on the price chart.
See the list of crypto losers to find unexpected opportunities.
See the list of crypto losers to find unexpected opportunities.
The current circulating supply of Uniswap (UNI) is 1.00 B USD. To get a wider picture you can check out our list of coins with the highest circulating supply, as well as the ones with the lowest number of tokens in circulation.
The safest choice when buying UNI is to go to a well-known crypto exchange. Some of the popular names are Binance, Coinbase, Kraken. But you'll have to find a reliable broker and create an account first. You can trade UNI right from TradingView charts — just choose a broker and connect to your account.
Crypto markets are famous for their volatility, so one should study all the available stats before adding crypto assets to their portfolio. Very often it's technical analysis that comes in handy. We prepared technical ratings for Uniswap (UNI): today its technical analysis shows the sell signal, and according to the 1 week rating UNI shows the sell signal. And you'd better dig deeper and study 1 month rating too — it's sell. Find inspiration in Uniswap trading ideas and keep track of what's moving crypto markets with our crypto news feed.
Uniswap (UNI) is just as reliable as any other crypto asset — this corner of the world market is highly volatile. Today, for instance, Uniswap is estimated as 0.81% volatile. The only thing it means is that you must prepare and examine all available information before making a decision. And if you're not sure about Uniswap, you can find more inspiration in our curated watchlists.
You can discuss Uniswap (UNI) with other users in our public chats, Minds or in the comments to Ideas.