SEMICONDUCTORS: Are you ready to get knocked off your SOX?Using Elliott wave one can determine once an uptrend has ended as the market simply has run out of waves. Here I assess the waves off the November 2008 low (yes the NASDAQ:SOX ) bottomed well before the other major US indices and has thus been a market leader since. However, it's price pattern off the December 2018 low is all but ideal and in elliott wave terms looks very much like a (very large) ending diagonal. In technical analysis terms its called a rising wedge. This is a bearish price pattern because once it completes, and it appears very close to completion especially considering today's price action, price will rapidly (here the time frame is weeks, so "rapidly" is relative) move back to the start of the diagonal which is around $1285. Given that the leader is in that case becoming the laggard, it will be quite obvious what this will do to the broader market indices. From that level we should see at least a decent bounce as ultimately the low 1000s should get revisited. Note that the big-picture elliott wave count for the TVC:SOX is not necessarily the same as for the other major US indices such as the TVC:SPX , NASDAQ:NDAQ or TVC:DJI as each index obvioulsy tracks different parts/segments of the overall economy and those are each at different stages of their social and business cycles, which is exactly what Elliott wave tracks and qualifies. Price will have to break above $1650 on the TVC:SOX to tell me my assessment of the chart is wrong, but given the very ragged (overlapping) price action this year, rather similar to October 2014-June 2015 and which was followed by an ~27% correction into early 2016, I prefer to err on the side of caution for now.
Trade Safe!
Diagonal

Motive Waves Construction - Part 4 (01)This chart corresponds to our educational article "Motive Waves Construction - Part 4".

Ending Diagonal Pattern is completing in EURUSD pairIn the 71.8 Fibo and 161.8 time retracement ,the ending diagonal pattern will be completed in high probability and will start a new big IMPULSE wave

Closing corrective Diagonal on AUDNZDThis short structure will lead to a quick sell position. Not to be held long term!

NEO - Elliott Wave idea #1Maybe NEO need break this "validation level" to validate this count. After break and finish 5th wave we will see deep correction.

When the indicators align: Potential long-term trend reversal! Hi all,
Heres a video summary...
XPT has been giving me the eyes from across the bar all night... However, I am sitting on my hands patiently waiting for absolute confirmation before striking. These sensational charts are suggesting to me we are approaching a potential long term trend reversal!
Here are my confluent reasons why...
1. Falling wedge pattern.
2. Bullish divergence on the RSI.
3. Higher lows RSI, lower lows price action.
4. Potential ABCDE count.
5. Price action really stretched away from EMAS. (weak indication)
I believe we are going to get something like this
However, there are multiple pathways it could take...
we have to look on the flip side as well, very possible we break out now and bull off into the sunset
Or we reject the top trend line head to the bottom trend line and continue this strong downtrend.
Either way, Platinum looks juicy and prosperous and I am leaning towards bullish.
Be patient and prepared for anything and let me know your thoughts.
Good luck and happy trading :^)
***This information is not a recommendation to buy or sell. It is to be used for educational purposes only.***

NZDUSD - Look for the Buy*Disclaimer - This analysis alone DOES NOT warrant a buy or sell trade immediately. Before you enter any trade in the financial market, it is very important that you have a proper trading plan and risk management approach.
The sharing of this idea is neither necessarily indicative of nor a guarantee of future performance or success.

GBPNZD Long. Impulse Wave Continuation.Volatility looks good.
Volume looks good.
Wave/Triangle counts seem legit.
Candlestick patterns have bullish sentiment.
Good spot for a long position? I think so. ~300 pips to my forecasted 'Wave 5' target, which lands right on a low volume node.
Stop loss around 1.92838.
Take profit area shown on chart.

USDCAD - A classic diagonal structureMany traders struggle with Elliott Wave analysis because they often try to label the charts without having a strong foundation on the principles of wave analysis.
It can be made easy with just a few simple steps:
1) Understand price movement - impulse vs correction
2) Discover the 3 main categories of pattern formation
3) Identify which pattern is forming and what does each pattern mean
Here is a good classic example of diagonal structure. We call it the 'crawl' pattern.
Whenever we spot a pattern like this, our bias is to the downside. Either a correction, or a potential major reversal.
*Disclaimer - This analysis alone DOES NOT warrant a buy or sell trade immediately. Before you enter any trade in the financial market, it is very important that you have a proper trading plan and risk management approach.
The sharing of this idea is neither necessarily indicative of nor a guarantee of future performance or success.

OLong

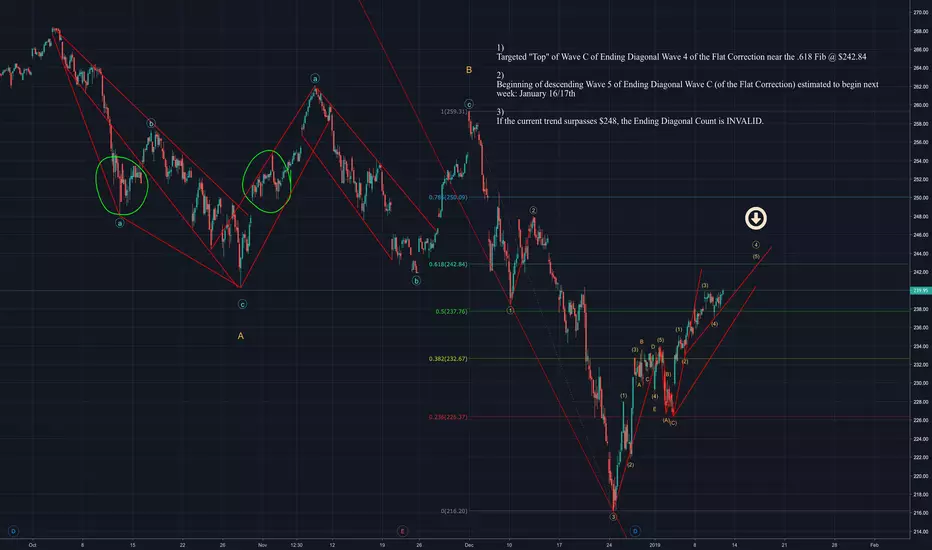
Elliott Count of DIA - Bear Move May Start Next WeekElliott Wave Count: Flat Correction (3-3-5)
- Waves A and B of the Flat have completed.
- Wave C is an Ending Diagonal (*A very small percentage of diagonals appear in the C-wave position* | sequence 3-3-3-3-3)
Current Predictions
1)
Targeted "Top" of Wave C of Ending Diagonal Wave 4 of the Flat Correction near the .618 Fib @ $242.84
2)
Beginning of descending Wave 5 of Ending Diagonal Wave C (of the Flat Correction) estimated to begin next week: January 16/17th
3)
If the current trend surpasses $248 , everything here is wrong/the Ending Diagonal Count is INVALID.
EURCAD - A great counter trend setupPrice structure is showing a divergence with MACD, and also forming a diagonal pattern.
We are expecting the correction to unfold soon with a potential target at 1.5299 area.
*Disclaimer - This analysis alone DOES NOT warrant a buy or sell trade immediately. Before you enter any trade in the financial market, it is very important that you have a proper trading plan and risk management approach.
The sharing of this idea is neither necessarily indicative of nor a guarantee of future performance or success.

EURUSD with Elliott Pattern + Diagonal / Weekly and DailyHi
I think we're at the end of the A-wave.
You can plan for B-wave.
#Elliott
#Diagonal
#EURUSD

Looking for EWZ to retrace as it should. Patience on re-entry.Trading EWZ with options.
Calenders and Verticals in specific.
looking for a retrace so im open ended on the position to the down side.
Im long term Bullish.
Short term Bearish.
Also note, if retracement actually matures, it will leave a bearish formation producing resistance levels.
The market will have to fight back a little harder to bring back the current high levels.
GL luck all

The Big Short? Triple diagonal confluence sell signal at 4408I've been a bit obsessed with diagonals lately, and noticed this lining up to a rejection of BTCUSD at 4408. This would align to this fake head & shoulders breakout, which would lead to a ton of longs being filled on completion of the H&S , and then immediate liquidation of longs on a selloff.
The only target bottom confluence I'm showing is 1237 with a timeline of April 1. That seems pretty low to me, however I'm not seeing another lower level of confluence on this timeframe on the chart. I wonder if an "extinction level event" (death of Tether) along with USD stock markets tanking would drive the price pretty low (~1700), then panic selling would ensue and cause a massive selloff that would lead to "all hope lost in" BTC and result in a complete capitulation event.
All that said, I'm going to reassess the lower level charts in the future if we connect on the 4408 downturn. But remember, we are still in a major bear-market downtrend and there isn't yet "blood in the streets".

USD/NOKIU-NOKE sell for diagonal, with massive possible downside long term, however I can only go by the diagonal. But very nice divergence.Also, note Eur/Nok trapped buys.

Bullish Countbased on the above count, the long-term trend remains bullish, either wave (3) or wave (C) rally is under way


Eur/ChfEchf is looking very corrective in nature. I looked at multiple things on different time frames and that zone has a lot of resistance within it. We had a smaller scale diagonal ending at the 1.618 extension which is typical for a wave 3, so if Echf breaks that top trend line, that would complete a diagonal of a larger degree. The point would be to catch a sell entry, which could have the possibility of going down to break the last low it made. That blue ma is the 800. See 200MA on daily and ichimoku cloud on monthly to see what I mean about resistance within zone.

USD/SGDUSD/SGD could be in a huge down trend, or it will correct and give us one more up to the .618 for last 3 wave move meaning we get a correction in the middle. watch the 200MA on 4hr/ 800MA on 1hr as a potential reaction point for larger corrective structure, or a flag to continue down.

Shanghai composite is not that bearish as you thinkThe major Chinese stock index, shanghai Composite, is not as bearish you might think or you might heard it to be in the news. It has just broken out of a month long fallen wedge formation, which usually appears at the end of a major trend.
The break down yesterday provided great buying opportunities. Given the size of the fallen wedge pattern, it should be at least able to prop the market higher for the next 1 to 2 months given that the wedge low is not taken out.
SLong
