DIAAfter liquidity was taken out at the purchase and a new asset high was reached, a short-term revaluation of the asset is expected following the bullish rally. This rally left behind a lot of unfilled liquidity and a fair value gap, which I have noted on the chart. However, I won't rush to open a sho
Key stats
About SPDR Dow Jones Industrial Average ETF
Expense ratio
0.16%
Home page
Inception date
Jan 14, 1998
Despite the name recognition that comes from tracking the Dow and its own popularity, DIA is not the ideal ETF for investors who want broad-based exposure to US large-caps. The fund`s tiny portfolio, arbitrary selection, and antiquated weighting produce significant sector biases relative to the market, and cover only a fraction of the large-cap space, typically represented by hundreds of names. Stocks are price-weighted, not cap-weighted, which can produce major sector realignments when multiple holdings change, as occurred in September 2013. Still, DIA tends to move with the broader market day-to-day, and some may prefer its typically (slightly) lower beta. DIA is extremely liquid, with huge assets and a long track record. The fund`s UIT structure is shared by a few other long-lived ETFs (like SPY), with the most notable effects being a slight cash drag since stock dividends received in between the ETF`s distributions can`t be reinvested as is typically the case. UITs must also hold every stock in the index at all times, which can tie the PM`s hands. Still, for exposure to the Dowa concentrated, universally-cited basket of household namesDIA is a great choice.
Classification
What's in the fund
Exposure type
Finance
Technology Services
Health Technology
Electronic Technology
Stock breakdown by region

A Simple/Consistent Trading Strategy Using AnchorBars For AllI was talking with a friend today and he stated he just wanted something simple and consistent.
He stated he was using Weekly, Daily, and 30 Min charts to try to confirm his trade setups.
He did not want to swing for trades too often - only when the Weekly, Daily, 30 Min charts aligned.
I've buil

DIA POSSIBLE WAVE E LOW what NEXTThe chart posted is the only Bullish wave structure and it is now labeled if this structure that has formed is correct then we would see a Run above 40k and it would be rather fast . I am watching close best of trades Wavetimer

DIA Trend BreakThis is a pattern on DIA that has been forming since 2022, so I'd expect a big reaction when it breaks either direction. As of now, it has broken below, but it's done that before and recovered so I'll be waiting for more confirmation.

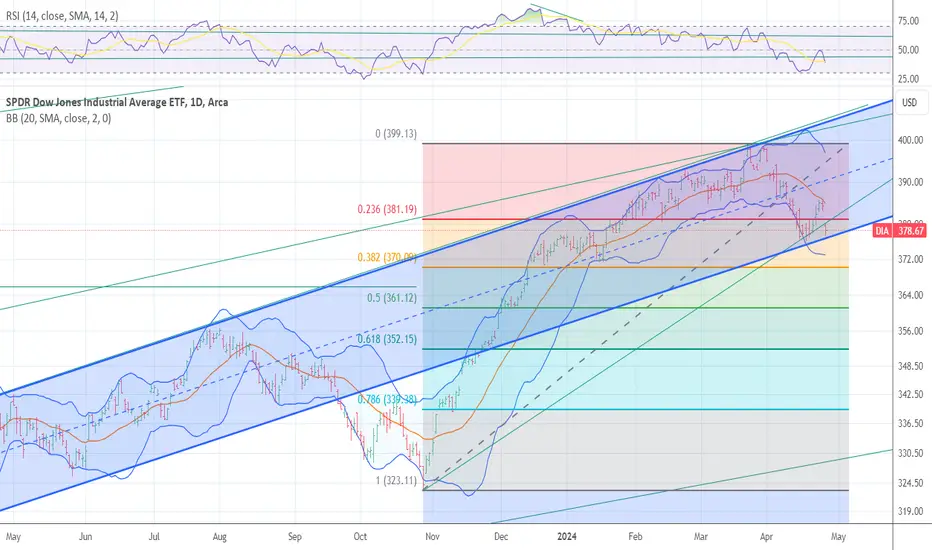
DIA Q2 2024DIA ETF Q2 2024 view with RSI and 200, 100, 50, 20 VWMA indicators.
DIA
UNH
GS
MSFT
HD
CAT
V
MCD

Puts DOWI think the DOW has already peaked out. I'm going to short it with puts on every rally. If tomorrow opens with a gap up I'll buy more.

DIA if today is wave B or 2The chart of the dow jones tracking stock DIA if today lows hold we could then see a run to two targets fist is 393.1 BEAR wave count alt is a rally to .786 where wave A or 1 equal 1.618 at a .786 Reason TLT has now broke above fib res and this should be a positive for the BANKS

DIA support and crossroads ! The chart posted is than of a channel I believe we have been in for some time as well as fib relationship . we are now sitting a channel that should be watched and respected .

I am long calls SPY and now TLT The chart posted is that of the DIA as I have said this chart is and has been very clear in regards to the Pattern forming . In march at the spring Equinox on the 21 we peaked above the bb bands on the monthly and also peaked just under the super cycle channel into the fib projections 39580 to

This is why I am taking on long calls the channel The chart posted is in a well defined channel that is parallel we are now retesting it . if we were to Break it . that would be BAD thing . But if we break it and close back above that that would be a GOOD thing .We had the Vix cycle peak come in within 1.5 days of the 4/15/4/17 and we are sett
See all ideas