Diamond Shift, Channel in Play!Price action recently formed a diamond pattern right at the intersection of two channels, a high-probability area for a shift in direction.
The diamond acted as a turning point, and from there, price shifted into a new phase: the creation of an ascending channel.
Within this structure, we can clearly see consistent higher highs and higher lows, confirming that momentum is now with the buyers.
The market transitioned smoothly into this new ascending channel.
What’s important here is that the channel is not random: it’s an orderly climb, respecting both the upper and lower boundaries. That shows controlled buyer pressure rather than chaotic volatility.
As long as price continues to respect the lower boundary, the bias remains bullish, with the target being the top of the channel.
So, the sequence is clear:
Diamond pattern at the intersection → transition into an ascending channel → target at the channel high.
Diamond

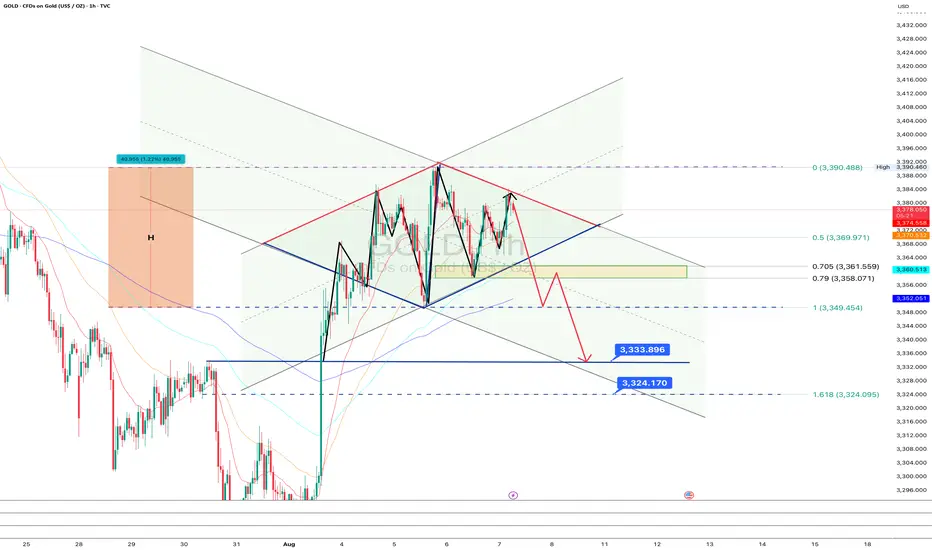
GOLD: The diamond hasn’t sparkled yet - waiting for confirmationOn the 1-hour chart of gold, a diamond pattern is forming at the top of an ascending channel. The current price is 3378, and the asset remains within the structure, without confirming a reversal yet. The key area is the 0.705–0.79 Fibo zone (3361.5–3358), which aligns with the lower boundary of the diamond. At this stage, the pattern is not complete — there's no break of the base, so the move is still pending.
Technically , the market is showing signs of momentum fading and a possible transition into a correction, but it's too early to call it without a clear break and close below 3361, which represents the lower edge of the diamond. If the bearish scenario plays out, the next targets are 3333 and 3324, projected from the pattern itself.
Fundamentally , the picture remains mixed: the dollar has stabilized temporarily, and expectations around U.S. interest rates continue to create uncertainty. Gold is reacting to all of this, but without a clear macro trigger, the upside may remain limited.
Tactical plan: Watch how price behaves in the 3361.5–3358 zone. If a reversal pattern forms, followed by a break to the downside, a short opportunity may open after a retest.- with targets at 3333 and 3324. If that break doesn't happen, and price moves higher, the diamond structure breaks to the upside, and the bearish scenario is invalidated.
As they say until the base breaks, it’s just a shiny piece of the chart, not a diamond. Watch closely, act on confirmation, not assumptions.
BTC Diamond Ser ?- While bears see bearish pennants, I see diamonds in the rough.
- I remain bullish, not due to the price, but for the sake of humanity.
- This isn’t an analysis, just a light-hearted joke, so please don’t roast me too hard! 🙏.
- Remember, diamonds are forever.
- Hodl!
Happy Tr4Ding!

Shine bright like a diamondAfter the abrupt appearance of a downward pattern, a counterposition emerges: a new, massive symmetrical triangle! This should take us above 110K, forming a diamond(A) where the goal is to preserve the megaphone(B) effect and establish a new target within it.

XDefi Wallet Second DiamondGATEIO:XDEFIUSDT
⏰ TimeFrame 1Day
👉 💎 Diamond reversal❓ or continuation❓
👉0,031-0,044
✔️Logarithmic (Log) Chart

BTC DIAMOND?Is this a giant diamond shape reversal for bitcoin? OMG… that would mean the moves down would be in proportion to the moves up. But it is sloped up a bit… i wonder what that enthusiastic canter will do to the price out of this pattern?
Still scared of Bitcoin. :)

BTC DIAMONDPump or dump???
I think we have a lot of over leveraged shorts so I am going to risk it. Might have to drop out and go for 52K.
NOT FINANCIAL ADVICE!!!!

JSE TOP 40 potential big Diamond breakdown to 58,288Bearish Diamond formation is potentially forming on JSE Top 40.
We've seen bearish tendencies for the market with momentum downside.
Price<20 and Price<200 - HPT
We DO need this price to break below the Diamond before the likelhood is higher for big downside.
But knowing indices, they always tend to suprise and the market makes a big rally.
ANyway, the momentum is down for now and if the diamon breaks below the next target could be at 58,288.
Let's see

GBPJPY CONTINUOUS DIAMOND PATTERN GBPJPY is trading a diamond continuous bullish pattern on its daily chart.
The price is trading above Mid: 160.498 and approaching the Breakout: 172.129.
Stop below the low previous to the Breakout: 172.129.
Targets:
62%: 186.658
79%: 190.717
100%:195.674

Crudeoil - Diamond setup and minor 2nd wave CorrectionCrudeoil tested LS Kink wiith 3Drive and Failed QM followed by Stacked RS. Lower side LS KInk already tested at retracement of 786.but 2nd wave looks like isint completed . one more fall expected before starting 3rd long wave.

GBPJPY DIAMOND BOTTOM🎄 Hello Traders, Merry Christmas and Happy New Year! 🎉
As we embrace the festive spirit, let's also dive into an exciting trading opportunity that's shaping up in the Forex market.
📚 Introduction to the Diamond Bottom Pattern:
What is a Diamond Bottom? It's a unique and relatively rare chart formation that signals a potential bullish reversal. This pattern is characterized by a broadening price range followed by a narrowing one, forming a diamond-like shape.
Why It Matters: For technical traders, spotting a Diamond Bottom can be like finding a gem – it often leads to significant price movements if confirmed.
🔎 Analysis of GBPJPY's Diamond Bottom Pattern:
Current Scenario: The GBPJPY has formed a distinctive Diamond Bottom on its hourly chart, hinting at a possible shift in momentum.
Breakout Point: The key level to watch is the breakout point at 180.366. A sustained move above this level could signal the start of a bullish phase.
Risk Strategy: As always, managing risk is crucial. Placing stops below the low prior to the breakout can help mitigate potential downside risks.
Target Zones:
Primary Target Zone:
62% Retracement: 181.202
79% Retracement: 181.440
Extended Target Zone:
127% Extension: 182.092
162% Extension: 182.573
🎁 Trading Insights:
Confirmation is Key: Wait for a confirmed breakout above the Diamond Bottom for a higher probability trade.
Market Context: Keep an eye on overall market trends and news, especially those affecting the GBP and JPY.
🌟 Conclusion:
Opportunity Awaits: The Diamond Bottom pattern in GBPJPY offers a promising setup as we head into the new year. With careful analysis and prudent risk management, this could be a great way to start your trading year.
Here's to a profitable and joyous trading journey ahead! 🥂

Diamond Pattern: How To GuideThe Diamond pattern, an often-overlooked gem in technical analysis, holds the potential for substantial profits.
💜 If you appreciate our guides, support us with boost button 💜
Despite its rarity, this unique pattern can be a valuable asset for traders. In this article, we'll explore the essentials of the Diamond pattern, from its formation principles to practical trading strategies.
Understanding the Diamond Pattern:
The Diamond pattern, a reversal pattern, takes shape at the top of an uptrend or the bottom of a downtrend. Recognized by its diamond shape, the pattern signifies a period of decreased volatility, with market participants positioning themselves for the next significant move.
Diamond Pattern Formation:
Top of Uptrend: Starts with an expanding triangle, followed by a converging triangle. The second wave of players triggers a rapid price decline, forming the Diamond pattern.
Bottom of Downtrend: Bears induce a sideways movement, and the second wave of traders, motivated by greed, initiates active selling. Profit-taking by the first wave of sellers leads to the formation of the Diamond pattern.
Trading Strategies:
Opening a Selling Position:
Sell when the price breaks the lower right support line and the candlestick closes below it.
Place a Stop Loss behind the nearest high.
Potential profit: 60-80% of the Diamond's height.
Alternative Selling Approach:
Enter at the breakaway of the Diamond's low for a conservative approach.
Place Stop Loss behind the nearest low or Diamond's high.
Opening a Buying Position:
Buy when the price breaks the upper right resistance line, and the candlestick closes above it.
Place a Stop Loss behind the nearest low.
Potential profit: 60-80% of the Diamond pattern size.
Alternative Buying Approach:
Enter at the breakaway of the Diamond's high for a conservative option.
Place Stop Loss behind the nearest low or Diamond's low.
Closing Thoughts:
Mastering the Diamond pattern requires patience, technical analysis skills, and disciplined risk management. Despite its infrequency on larger timeframes, the potential for significant profits makes the Diamond pattern a valuable tool in a trader's toolkit. Traders should exercise caution, ensuring the pattern is complete, and adhere to risk management rules, especially with larger stop-loss sizes on larger timeframes.

AREA NEW INCREASE VOLUMEThank you for reading this update.
Depending on our study we see that AREA has a good chance of volume increase.
This updates depending on day trade, And the market should confirm with time the right market way.
#Nottradingadvice
#For day traders take always profits when market increase
#Expect noting from the markets, but follow what it shows.

SVV ENTERING NEW VOLUME ZONEThank you for reading this update.
In our prevous update we did follow SSV from 13 USD, we have seen in the short term that SVV did made new volume gains.
Depending on our new study we see that SSV has a good chance of volume increase.
This updates depending on day trade, And the market should confirm with time the right market way.
#Nottradingadvice
#For day traders take always profits when market increase
#Expect noting from the markets, but follow what it shows.

AUDJPY DIAMOND CONTINUOUS PATTERN The AUD/JPY has formed a geometric diamond pattern on its daily chart. The price is currently trading above the MID level at 94.959 and is approaching the BREAKOUT point at 96.893. A clear breakout above the level of 96.893 could potentially lead to targets at 62%: 99.379 and 79%: 100.038.

AI DOGE NEW BREAK VOLUME Thank you for reading this update.
Depending on our study we see that AIDOGE has a good chance of volume increase.
This updates depending on day trade, And the market should confirm with time the right market way.
#Nottradingadvice

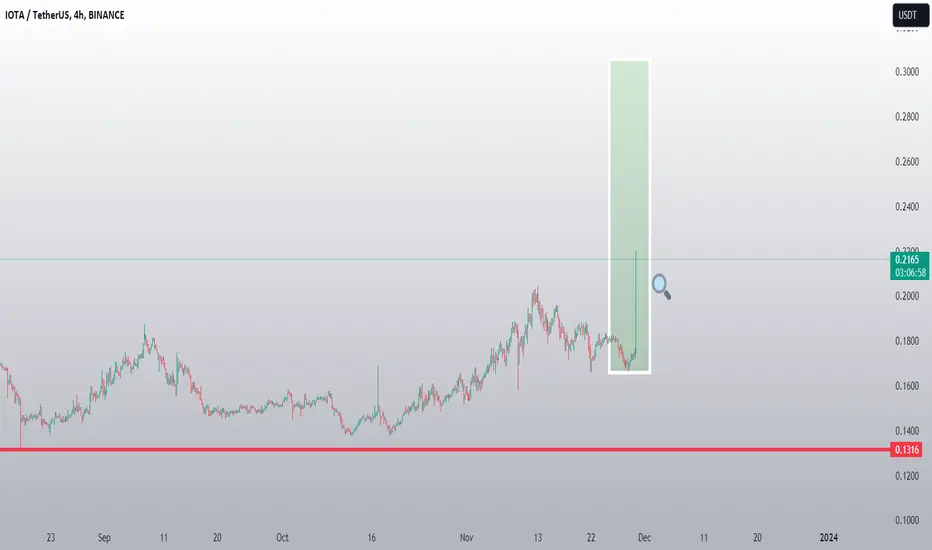
WHAT AFTER THE VOLUME INCREASE IOTAThank you for reading this update.
Depending on our study we see that IOTA has a good chance of volume increase.
This updates depending on day trade, And the market should confirm with time the right market way.
Since the last increase its important to see IOTA having a new confirmation.
If there is new trend ww follow with new update.
#Nottradingadvice
SUPER COIN VOLUME NEW RANGEThank you for reading this update.
Depending on our study we see that SUPER has a good chance of volume increase.
This updates depending on day trade, And the market should confirm with time the right market way.
#Nottradingadvice

Movrusdt ... Diamond patternMovrusdt has formed a diamond pattern, it can climb up to around $9.
and in (RSI) it is clear that we have a positive divergence.

XVS START INCREASE VOLUMEThank you for reading this update.
Depending on our study we see that XVS has a good chance of volume increase.
This updates depending on day trade, And the market should confirm with time the right market way.
#Nottradingadvice

CHFJPY GEOMETRIC TRADING DIAMOND BOTTOMHello Traders,
Today, we are having a closer look at CHFJPY, which presents a promising trading opportunity. Upon analysing the daily chart, we can observe a geometric pattern resembling a diamond shape. The trade has already been initiated, and you can view it here: However, don't worry; I have more news to share with you.
It's important to note that the diamond pattern won't be considered valid until we see a healthy breakout above 164.290. You can monitor this breakout here:
Here's the trading strategy I have for you:
1. Enter a long trade above the breakout level of 164.290, ensuring there's a surge in volume.
2. Place a stop-loss order below the previous low before the breakout.
The diamond pattern offers excellent target criteria. You can consider the following target levels:
- 62%: 166.938
- 79%: 167.653
- 100%: 168.545
I hope you find this analysis useful. I have many more analyses like this one in my profile, so you should check it out before you leave. If you support this idea, please show your appreciation with a like and stay connected by following me. Don't miss out on more trading opportunities like this one.
Have a fantastic weekend!
Best regards,
TCPLTP

GBPNZD PRICE ACTION TRADING DIAMOND BOTTOMGBPNZD is trading a diamond bottom on its daily chart and the price is currently trading 1.98040.

GBPNZD PRICE ACTION TRADING DIAMOND BOTTOMGBPNZD has formed a Diamond Bottom reversal pattern on its daily chart.
The Price is trading near the Breakout: 2.03195.
ST: 1.99395
Target1:
62%: 2.16627
79%:2.20281
Target2:
127%: 2.24911
162%: 2.38346
