IOTAUSDT 1WIOTA ~ 1W
#IOTA Very interesting support block to start accumulation. at least for a minimum 20%+ increase from here.

IOTA LONGIota currency has made a good return and is on support. Now, if it exits this triangle with strength, it can form a higher ceiling until autumn BINANCE:IOTAUSDT KUCOIN:IOTAUSDT

Good time to buy IOTAIOTA (IOTA) is one of the first coins which I started to follow and invest in. This is trade (investment) setup on larger timeframe. I am not looking to reach targets 2,3,4 and 5 very soon, that could be year(s). I will sell most of my capital on targets 3 and 4. Small portion will be sold on Targe

#IOTA Technical Analysis in Weekly TimeframeHello everyone, I’m Cryptorphic.
For the past seven years, I’ve been sharing insightful charts and analysis.
Follow me for:
~ Unbiased analyses on trending altcoins.
~ Identifying altcoins with 10x-50x potential.
~ Futures trade setups.
~ Daily updates on Bitcoin and Ethereum.
~ High time frame (H

IOTA poised for a BIG move4 years resistance and support encounter are near. Honestly, crypto will only evolve when Bitcoin lose its throne. Maybe it is a good time for altcoins outside the top 10. Primary target is $0.61, second target $0.9~$1.

IOTAUSDTHM signal v5.0 (High momentum) spotted. Looking good with previous wave up with increasing volume and momentum.
- Heathy retracement and support well at good level @ 0.1755-0.1765
- Trending slow and steady if able to hold above the support zone
It is at extremely good reward to risk level now if

IOTAUSDT short-term analysis - bullish signalhi traders,
Let's take a look at IOTAUSDT on 1D time frame.
What we can see are regular bullish divergences.
Moreover, a potential triple bottom formation may be in play or the falling wedge pattern.
Buy now, take profit at 0,258 and exit fully your long at 0,30 usdt.
Stop loss at 0,1947
Good luc

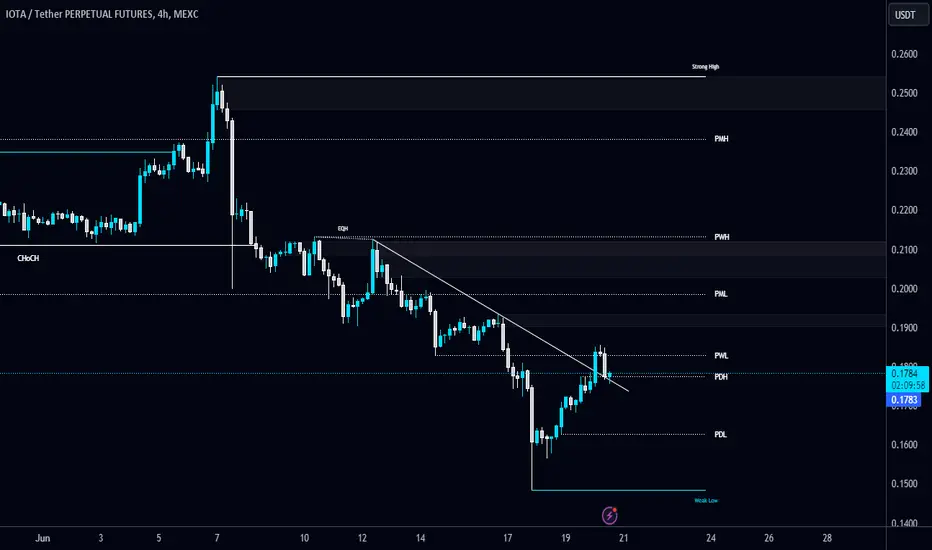
#IOTA/USDT breaks the Diagonal Trendline in 4-Hour TF!#IOTA/USDT breaks the Diagonal Trendline in 4-Hour TF!
FWB:IOTA is bullish as long as it holds this Trendline as a support. The local resistance level is PWL $0.183, and the support level is $0.163.
Alikze »» IOTA |Pullback to dynamic trigger is brokenAccording to the previous analysis , he was able to touch the first supply area of the 0.43 range with the flag pattern.
💎 But now in the 4H time, after exiting the density and breaking the dynamic trigger, it can now touch the specified areas and also the first supply area with the support of the

#IOTA/USDT#IOTA
The price is moving within a descending channel pattern on the 12-hour frame, which is a retracement pattern
We have a bounce from a green support area at 0.2000
We have a tendency to stabilize above the Moving Average 100
We have an upward trend on the RSI indicator that supports the rise

See all ideas
Frequently Asked Questions
The current price of IOTA / TetherUS (IOTA) is 0.1644 USDT — it has fallen 0.42% in the past 24 hours. Try placing this info into the context by checking out what coins are also gaining and losing at the moment and seeing IOTA price chart.
IOTA / TetherUS price has fallen by 6.54% over the last week, its month performance shows a 5.19% decrease, and as for the last year, IOTA / TetherUS has decreased by 5.57%. See more dynamics on IOTA price chart.
Keep track of coins' changes with our Crypto heatmap.
Keep track of coins' changes with our Crypto heatmap.
IOTA / TetherUS (IOTA) reached its highest price on Apr 16, 2021 — it amounted to 2.6773 USDT. Find more insights on the IOTA price chart.
See the list of crypto gainers and choose what best fits your strategy.
See the list of crypto gainers and choose what best fits your strategy.
IOTA / TetherUS (IOTA) reached the lowest price of 0.0534 USDT on Mar 13, 2020. View more IOTA / TetherUS dynamics on the price chart.
See the list of crypto losers to find unexpected opportunities.
See the list of crypto losers to find unexpected opportunities.
The safest choice when buying IOTA is to go to a well-known crypto exchange. Some of the popular names are Binance, Coinbase, Kraken. But you'll have to find a reliable broker and create an account first. You can trade IOTA right from TradingView charts — just choose a broker and connect to your account.
Crypto markets are famous for their volatility, so one should study all the available stats before adding crypto assets to their portfolio. Very often it's technical analysis that comes in handy. We prepared technical ratings for IOTA / TetherUS (IOTA): today its technical analysis shows the sell signal, and according to the 1 week rating IOTA shows the sell signal. And you'd better dig deeper and study 1 month rating too — it's sell. Find inspiration in IOTA / TetherUS trading ideas and keep track of what's moving crypto markets with our crypto news feed.
IOTA / TetherUS (IOTA) is just as reliable as any other crypto asset — this corner of the world market is highly volatile. Today, for instance, IOTA / TetherUS is estimated as 0.98% volatile. The only thing it means is that you must prepare and examine all available information before making a decision. And if you're not sure about IOTA / TetherUS, you can find more inspiration in our curated watchlists.
You can discuss IOTA / TetherUS (IOTA) with other users in our public chats, Minds or in the comments to Ideas.