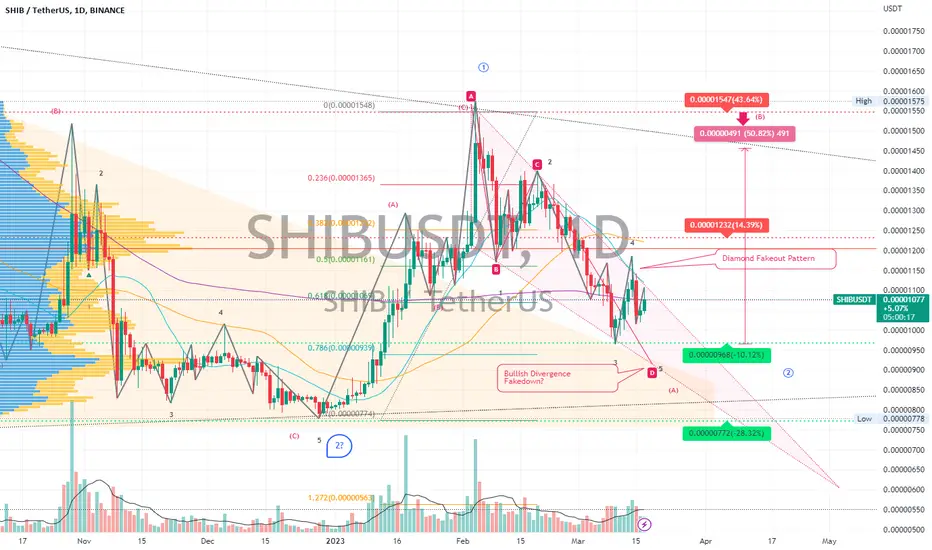
SHIBUSDT | Wave Analysis | Bull Wedge Diamond Breakout Position?Wave Analysis combined with price action and chart pattern trading:
> A potential minor 1-wave descending triangle breakout scenario with ABC falling wedge retraced 0.786 fibonacci level
> After recent uptrend diamond breakout above SMA200, now assuming a possible upcoming bullish divergence FAKE BREAKDOWN minor 5-wave to complete the reversal pattern for downtrend A wave correction.
> If breakout +50% upside falling wedge target at downtrend triangle resistance.
> 2nd fakeout is always the 4 - wave correction position
> Long Entry after bullish divergence confirmation at the Wedge
Always trade with affordable risk and respect your stoploss,
Good Luck
Diamondpattern
A diamond is about to shine!The price action is printing a peak formation making an iv wave of a potential expanding diagonal ending. This contractive path suggests a possible diamond pattern to be formed, in which structure price can form a counter triangle. The expected swing down tends to led the price to extend an 2.618 Fibonacci ratio of a potential Harmonic Bat C-D leg @ pivot support level, as shown on this chart.

eth 1h triangle and diamondCOINBASE:ETHUSD
⏰ TimeFrame 1h
👉 💎 Diamond reversal❓ or continuation❓
✔️Logarithmic (Log) Chart

SPX - Could be still whipping in a wide rangeAt the start of February, SPX saw a number of "affirmations" that the uptrend was underway:
1. broke up and continued to trade above it's longer term trendline resistence
2. traded above its 200 day MA since 24th Jan
3. followed by a Golden Cross on 1st Feb
However the month of February began to see momentum evaporate as the index began to pullback below it's 20, then 50 days MA and finally stopped short at its 200 day moving average.
There are now a confluence of immediate "supports" coming up between 3920 to 3949, namely:
1. the 200day MA @ 3940
2. the long term trendline resistence that could have turned support
3. 38.2% fib retracement of the big AB upswing that began from Oct's low @ 3920
4. which is also the 61.8% fib retracement of the more recent BC swing
Therefore we need to see some rebound this week if the this pullback is just a breakup and retest of major prior resistences or something more bearish (which mean breaking below 3920).
A look on it's monthly chart showed that SPX had been mostly whipsawing within a wide sideway range of between 3585 to 4150 for the past 9-10 months and it is possible we could have more of that (think "STAGFLATION").
Hence unless we see some rebound this week or it could likely be a short term trader's arena right now (ie high volatility, short term swing ups and downs).
Can only wait and see.
Disclaimer: Just my 2 cents and not a trade advice. Kindly do your own due diligence and trade according to your own risk tolerance and don't forget that money management is important! Take care and Good Luck!

ETH Diamond Top - CONFIRMED - UPDATEAhoy, me hearties! Let me tell ye a tale about a man named James, a swashbuckling trader who sailed the seas in search of the finest diamonds. James was a master of the diamond top pattern, and he knew how to read the tides of the market to make a profit. When he saw the pattern confirm, he hoisted his sails and set a course for treasure. His crew worked tirelessly, scanning the charts and watching for any signs of a change in the winds. And when the diamond top pattern reached its peak, James struck with all the force of a cannonball. The market trembled beneath his feet as he raked in his booty, grinning from ear to ear. For James, trading was a way of life, and he would stop at nothing to find the most precious gems in the world. And as long as the diamond top pattern continued to shine, James knew he would always be the king of the trading seas.
All joking aside - this is going according to plan. Bounces are likely going to occur going into the weekend or next week but this is playing out nicely. Top for the year is still capped at $2,000 - $2,500.

BTC diamond pattern waaaSUP everyone, i thought i would share this one,
I was charting away and drew the wedge channel BTC is in. The white trend line is from body of the candles the blue is from wicks of the candles.
If you notice the blue trendline of the wedge has hit the last wick bang on
You will also see the bear flag that BTC is currently in ready to go somewhere, It could form a double bottom very soon which would also make this a Two diagonal diamond continuation pattern or possible reversal pattern depending if it broke out or not.
So ye theres my idea, another thing is there is a bull divvy on the 2hr.
On the daily we are below the 50MA, by a thread, but if we break the 50MA on the daily i would suggest the probability would be more favourable of hitting the top of that wedge.
But we will soon see, Happy weekend :)

Filcoin. Diamond pattern 3Bullish for now .The previous ceiling or even higher, offers and requests, macdi is a great place. And I see support in Macdi.
,

Filcoin. Diamond pattern 2After breaking the lower support line in the diamond pattern and exiting the price from this pattern, a sell decision is issued. In such situations, you can open the shorts position. The price target after the pattern is broken from the bottom is the same as the highest to the lowest price within the pattern, but sometimes the price chart may see higher prices after the pattern is broken.

Filcoin. Diamond pattern Diamonds are a very deceptive pattern in addition to the cryptocurrency market. Sellers in this area are misled by the fact that this deception provides a lot of liquidity to institutions and major investors in the market. A diamond pattern is formed when it is broken, QMed (price engulfs it). That is, for example, H, L, HH, LL, HHH exist. In the diamond pattern, four in-gulfs occur, and in this way, the stops of 4 groups of traders are eaten and liquidity is created.The loss of users of digital currencies in the diamond pattern - Sellers on the ceiling, buyers on the floor, sellers on the ceiling, buyers on the line..

Classic Reversal Patterns of Technical Analysis !!!👨🏫I tried to show you the most important Classic Reversal Patterns of Technical Analysis with their 🎯 Targets 🎯.
Please do not forget the ✅' like '✅ button 🙏😊 & Share it with your friends, Thanks, and Trade safe.

SPX - expect short term pullback (bearish divergence)The markt has been more bullish than bearish lately. However it is getting overbought in the near term and a bearish divergence is now seen on the daily chart. Hence some pullback from here will not be too surprising. Bearing in mind divergence usually result in only a short term trend change lasting several candles. I am looking at possible near term SPX support at 3885 (recent pivot low).
While SPX managed to break above its 200 day moving average and even the longer term trendline resistence that had proven to be a tough one to crack in the past few months, there are still a lot of skepticism especially when "bad" news (eg mass layouts by big techs) still abound.
The fact remains that the bigger picture (say 2 monthly chart) remains in a sideway "diamond pattern" consolidation. Assuming the market is indeed on the recovery, It will be weeks (or even months) more before the 200 day moving average can flatten and turn up. Hence, SPX could continue to whip saw around the 200 day MA for a while.
There are more and more stocks that are forming/have formed basing patterns, ready (or have already begun) to reverse into an uptrend. The way to navigate this market is to trade those stocks showing high conviction technicals. The more we see such stocks, the more we will be convinced the market is probably turning the corner (albeit it will still be volatile for a while until it becomes too obvious). More importantly is also to have strict exit rules (ie stop losses) in place in case we are wrong. Keeping losses small and letting winners run is the way to go although it is definitely easier said than done.
Disclaimer: Just my 2 cents and not a trade advice. Kindly do your own due diligence and trade according to your own risk tolerance and don't forget that money management is important! Take care and Good Luck!

BTC: Diamond Effort from the BullsLet's see how this turns out. Highly manipulated ATM, on the macro I'm bearish. Currently, however, a FOMO pump to 22.8K may be in the cards before this thing goes back to structure & back to bed. Be safe, be strong, be wise :)
**If you have patience, strong hands, and like scoring wins, be sure to SUBSCRIBE to this channel. Here's why: I track all USD-paired cryptocurrencies on all the major CEXs and seek out the most lucrative swing trades. All my charts are clean and easy-to-follow with exceptional win rates ranging consistently between 80-85%. My TA is based off a combination of Wyckoff Volume Spread & Fibonacci Ratios. Stop getting smashed and start winning in crypto. My charts will teach you how.
*Not a financial advisor. Trade at your own risk.

Diamond pattern round 2?Larger diamond pattern forming after the July pattern played out and hit target. Strong bullish divergence on the larger time frames, bounce off the .618, and RSI trend break and backtest (similar to July/Aug run) looks pretty good. Could come back to test the support line before continuing
NLong

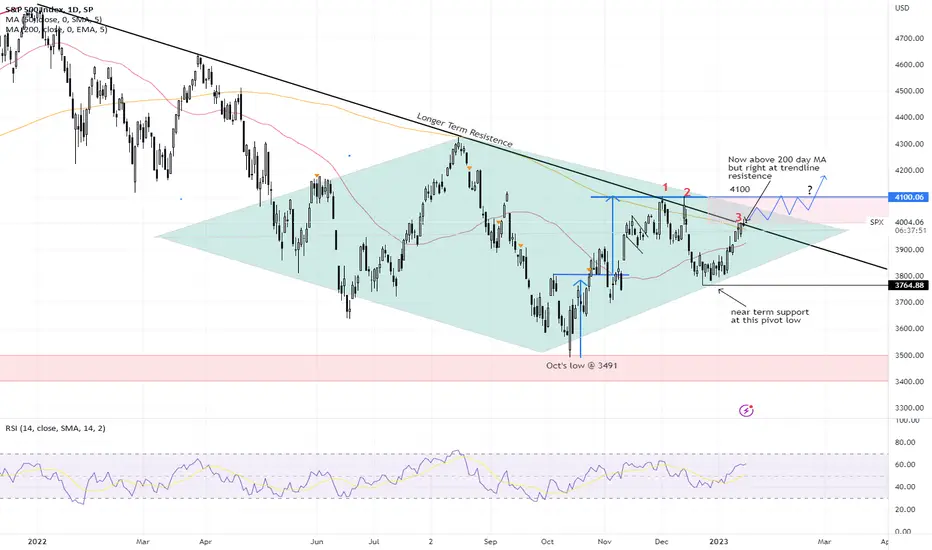
SPX - case for optimismOn Jan 3, I posted that SPX had been trading in a diamond pattern since late May, a potentially bottoming formation in a bearish market. It has been 2 weeks since and this pattern continues to play out.
2 days ago, SPX managed to close above its 200 day moving average and stopped right at the critical longer term trendline resistence again. This is the 3rd attempt testing the 200 day MA as well as the trendline resistence in the past 1.5 months.
The odds have increased that it will eventually test the 4100 level in the not too distant future, We may face some resistence at 4100 but the next pullback could be an opportunity to buy the dips, especially if pull backs do not bring it below the 200 day moving average again or formed a higher low.
Signs that a new bull could have returned (in the following order):
1. trading above both longer term trendline resistence (black) AND 200 day moving average
2. Golden cross, ie 50day MA crossing above 200day MA. May happen within the next couple of weeks? However, the market could continue to gyrate wildly for weeks more until the 200 day MA can flatten out
3. finally, trading above the 4100 level and by then the 200 day MA could be starting to slope upwards
Let's see.
Disclaimer: Just my 2 cents and not a trade advice. I may or may not enter into this trade. Kindly do your own due diligence and trade according to your own risk tolerance and don't forget that money management is important! Take care and Good Luck!
💎 Diamond Chart PatternAll financial markets, including the stock market, forex market, cryptocurrency market, and futures markets, feature diamond reversal patterns.
Compared to many other traditional chart designs, the diamond pattern is less frequent.
However, it's critical that you understand and recognize the pattern since, when it happens, it can present a great trading opportunity.
In general, a diamond top pattern that follows a rise in market prices offers a greater likelihood of a trade than a diamond bottom pattern that follows a decrease in market prices.
🟢 Bullish Scenario:
After a decline, a bullish diamond pattern known as a diamond bottom appears.
Typically, a diamond bottom is formed by a significant price decline followed by a consolidation phase that creates up and down swing points.
The appearance in this situation will resemble an upside-down head and shoulders design.
The structure's peaks and troughs will be connected in the same manner.
🔴 Bearish Scenario:
The diamond top typically occurs at the peak of significant uptrends.
It efficiently and accurately predicts imminent shortfalls and retracements.
By focusing on a head-and-shoulders structure and adding trendlines to the highs and lows, a diamond top can be found.
👤 @AlgoBuddy
📅 Daily Ideas about market update, psychology & indicators
❤️ If you appreciate our work , Please like, comment and follow ❤️

VIX in DIAMOND BUTTOMS!!!!!On the VIX Volatility index , I have observed a diamond pattern, which suggests that the current instability in market sentiment is likely to lead to a rise in market prices. Based on this, I decided to open a long position at the entry price of USD 21.21. I have set the Stop Loss level at USD 19.53 so that if market prices turn worse than expected, I can close the position with minimal loss. And I set the Take Profit at USD 24.26 so that if the market prices reach a certain level, I can automatically close the position at the best possible price. It is important to note that this is only my own observation and does not constitute investment advice. Everyone should make decisions in the financial markets at their own risk.

SPX & NQ - Still a mixed bagJust a quick update.
SPX closed the year 2022 with a Diamond Pattern. This pattern is potentially a reversal pattern (potentially bearish if it occurs at Market Tops, and potentially bullish if it occurs at Market Bottoms). Where it is occuring now, it could be a bottoming process for the SPX.
However, Nasdaq is still the weakest link right now and still looking bearish. A short term bounce could happen for NQ as a bullish divergence is seen but in the larger picture, any bounce right now could still be a "Bull Trap".
Disclaimer: Just my 2 cents and not a trade advice. Kindly do your own due diligence and trade according to your own risk tolerance and don't forget that money management is important! Take care and Good Luck!

GOING SHORT IN GOLD USD BY TRADING STRATEGYBearish Indications (BIASED SHORT)
1. Rejected or retest from a resistance level
2. Formation of Bearish Diamond Pattern
3. Trend Line Broken
4. Bearish Divergence
5. Entry at Bearish Candle
Neutral Indication
1. Price still in the range/consolidation phase
Bullish Indications
1. By Breaking the resistance level and making a new HL then the trend will be bullish

Diamond Bottom on Bitcoin 4HOn the chart above we can see a clear diamond bottom forming on Bitcoin's 4 hourly chart. This formation could cause BTC to rise to the level of $17,500 where it is also proven to be a diligent support. Lets see if the next few candles can manage to break the resistance of the pattern, which I believe is likely as we have a bull flag forming on lower timeframes.

APPL APPLE BEARISH DIAMOND CONT.It appears to me that a bearish diamond pattern is coming to an end - based on the qqq's direction and the overall sentiment on the direction of the entire market I would wager that its going to eventually (soon) break the lower purple line (140.15) which represents a heavy volume/price area. As you can see that level has been an area of strong adherance throughout the entire diamon thus far. It is possible that the pattern will make one more small push to the upside towards the $145 level however that pop should be short lived.
Overall PT 1 is $135.64
PT 2 - 131.04
Both the 1/20/23 $140 PUT strike as well as the 2/17/23 $140 put strike have heavy open interest and look like a safe bet with plenty of time. However I do think the trade can be exited for profits well before those expirations.


Bearish Diamond Reversal for SPX if confirmedThe SPY is forming a bearish diamond reversal pattern just below critical trend resistance from the larger trend. If we create a bear-spring pattern at this larger trend resistance marked with the dotted green line, or if we simply reject down from it, then we can assume a high likelihood of breaking the diamond to the downside.
Of course, naturally, if we form support at or above the larger trend resistance, then we can assume the price will not complete the bearish diamond reversal pattern and will do something else entirely.

bitcoin bowtie diametric chart patternHey Guys
This the bowtie diametric analysis of bitcoin's 4H chart i'm publishing
This wave is going down is wave G
please don't hesitate to share your ideas
regards Reza
