ETH/USDT diamond pattern!!!Hello''ETH Diamond Pattern Completed The price can fall as much as the height of the diamond pattern.
Diamondpattern

LUNA DIAMOND TOP PLAYING OUT!LUNA has just started to break to the downside from a DIAMOND TOP pattern.
Target buy zone for me is $35-40, this also lines up with my long term trendline in a rising channel.
This chart shows how nice it is to catch a DIAMOND TOP.
You can see the VOLUME CANDLE and the pump and dump manipulation to create the pattern as shown by the arrows.
Not Financial Advice!

Bitcoin H1 diamond patternBitcoin is forming a diamond pattern on the H1 view.
The bullish target is 52,000$ and the bearish target is 45,000$.

Hindustan Unilever HUL made Diamond Bottom Pattern Plus another triangle Breakout on Hourly Charts.
Could b bought with Sloss of 2300 & tgt of 2420.


BTC/USDTHi guys.
BTC at 2h timeframe is in diamond pattern and when it breakout, can go to 53800 $ or 61400 $. good luck😉

Big Neutral Diamond Looking For a 30% breakout SoonI'm not sure which direction it ultimately will want to go but due to the diamond it certainly has my attention and I am watching it.

MINA DIAMOND PATTERNMINA has been very bullish the past few months.
We have a DIAMOND pattern in play where the chance to the upside is 31% and downtrend 69%.
Wait for the breakout/confirmation and targets for both scenarios in play.
MINA is within my Buy Zone marked with GREEN HORIZONTAL RAY.
#NFA

usdcad diamond breakout soon.UsdCad has been in a diamond price formation and due for a breakout soon.
Since USD is very bullish recently, I predict a bullish breakout and retest on the diamond structure.. then resume the price channel created in the diamond structure. This is a daily time frame so you will have to use a lover time frame for a buy entry. But it is sitting on a strong support now so there is a very good opportunity.
*I only try to identify chart patterns, it's up to you to make your decisions whether to buy or sell.
Good luck to everyone. Follow me for more patterns early

Perfect AB=CD Early Diamond C Entry on WAVES/USDWe have a Diamond pattern forming at a Potential C leg of a Perfect AB=CD with Hidden Bullish Divergence on the RSI.

EurCad long positionhello traders
I only try to identify patterns for all to make something of it. Here we can see EurCad is in a diamond reversal pattern. As it has been selling for some months now and due for a bull run. There is high probabilty price could possibly shoot up this week. As the pattern is very almost complete.
This is a buy opportunity and stop loss just under the strongest support level.
Good luck.

QTUM USDT X3 perp Working out the "DIAMOND" patternI propose to look at I give a coin not only from the side of trade, but also from the side of a small investment. Looking at the large timeframe, you can see the "diamond" pattern
A pending order to buy in the zone I have designated.
Stop loss and target values indicated on the chart

Matic printing a diamond patternCan see FTX:MATICUSD printing a diamond patten on retrace from recent local top around 2.22
Still considering the fib retracement lines (drawn from low of 1.15 to top at 2.22) around 1.77, 1.63 and 1.49 so could be a short term bullish push upwards if it breaks diamond pattern to the upside. Otherwise we’re still looking to pick some orders up around those fib lines, especially around 1.63 as that is a strong long term resistance that Matic is now looking to flip support.
Keep in mind using other indicators to confirm movement. Most would look to enter on a break of upper right side of Diamond with other confirmations like volume and stochastic oscillator with a stop loss just below the recent higher low before the breakout. Targets around top of Diamond and one Diamond height extended beyond the top of current Diamond.

BEARISH DIAMOND ON THE 4HThe Euro had a bit of a rally on Friday however the United states dollar showed sudden pressure on the Euro mid day during US session. This sideways action has formed a clear bearish diamond on the 4H / 240 time frame. Im expecting EUR/USD will test lower support levels next week. The favorable support is 1.1500, we shall see next week but keep an eye on this textbook Diamond bearish reversal pattern.
This Is Not Financial Advice

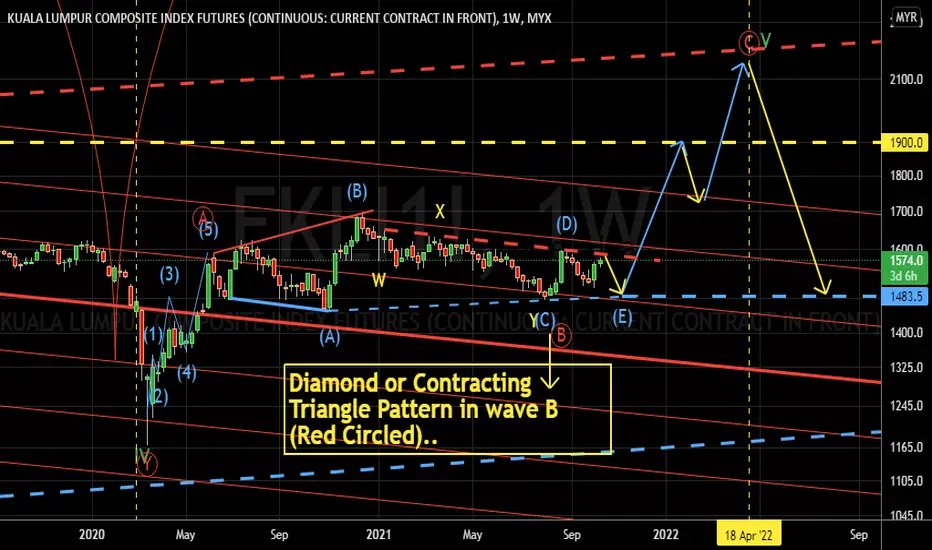
KLCI may form a diamond/contracting triangle. 12/Oct/21KLCI index price still in ranging and price may form a diamond/contracting triangle pattern before breakout for resuming uptrend..
BTC - Short Framed Diamond PatternSimilar to the last pennant break as price found the .764 of the 64.9 to 28.8 retracement and reversed, setting up a Diamond pattern.
BTC - Gains the Golden PocketPrice found the 76.4% level of the .65 to .764 channel (64.9 -28.6 retracement). Watching for the strength of the consolidation, particularly if price can hold the .65 in the event it returns for a back-test.

NASDAQ - The Game of Patterns - Q4 BeginsNASDAQ ends the week with a Diamond Pattern, after the iH&S broke the LH-LL 4 hour pattern.

ATOM diamond pattern#ATOMUSDT
$ATOM completed the AB=CD pattern as I shared before.
now price needs a correction, so I think #ATOM is trading inside a diamond pattern which is a reversal and as you can see included 2 parallel channels.
price broke out from middle line of descending channel, but it seems that the middle line of ascending channel have strong resistance. although price may have go up to touch the upper line of descending channel that is the same as middle line of ascending one,, then a slow and boring down trend to lower line of descending channel, to touch the 0.5 or 0.618 fib level of last swing high.

BTC IDEA 2BTC has a few scenarios, this is my 2nd chart for analysis.
1. Bull Flag
2. Broadening Wedge
3. Diamond Top
4. Head and Shoulders
5. ABC Corrective Elliot Wave
I think BTC is going for the higher low at $49,500 then into the corrective wave down to $38,000. I am bearish short/medium term, bullish long term.
This is NFA and for educational purposes only. DYOR.
Safe trading.

BTC - Daily Dash Board - Time for Time Away as the Diamond movesThis is the reference chart for the 3D charts provided previously. The reaction to the midline pops out as the larger Daily Diamond has come into focus. Diamonds are volatility machines, designed for fake-outs and dramatic reversals. Conventional wisdom suggests waiting for a clear break and backtest of the Dart boundaries for a play. Time to take some time away and let the range work itself out.

BTC DIAMOND TOP PLAYING OUT!BTC Diamond Top is in play, a bull flag is being formed which would take the price to $51,000-52,000.
We would then look for BTC to make a break down to complete the Diamond Top pattern, target is $35,000-38,000.
I will keep you updated with how it plays out.
Safe trading.

BTC - In 3D - Diamond to the Weekly 8 EMATesting the Weekly 8 EMA support as BTC looks for a Higher Low. The 2 hour frame shows a Confirmed Inverse H&S that met quick resistance at the 2 hour MBB.
