Digibyte

Digibyte vs Bitcoin - Digibyte set to come out on top... for nowWelcome to heyitskolin's analysis of DGB (Digibyte) and BTC. This is charted using the four hour chart on the logarithmic scale.
Ok, so from 10th of April DGB seems to have finished it's consolidation phase that began around the 19th of March forming a new uptrend channel (dotted black line). Accumulation Distribution has been increasing adding strength to this new uptrend channel (Note: for those of you learning, An uptrend in the Accumulation Distribution Line reinforces an uptrend on the price chart and vice versa – one of the many uses for the accumulation distribution indicator).
Aroon Up is high, whilst Aroon Down is flat to the floor, adding further confirmation that the new uptrend is valid; whilst the 200 EMA is also supporting this view.
Now it is worth noting the MACD has just crossed over bearish and we have fallen below the EMA 12. Therefore the latest emerging candle is looking to now test the bottom of the uptrend channel. I am not worried about falling through the bottom of the uptrend channel at this point in time as we have the EMA 26 as support whilst (at the time of writing this) also having a bullish doji star emerging in the 15 minute chart (these patterns are usually of medium reliability). The area we are now testing has also previously been confirmed as support back around the 8th/9th of February. Therefore, I think the next valid price action would be for a bounce off the bottom of the uptrend channel and provided this occurs (seems likely) we will then have a free run through a lack of resistance to test the 38.2% Fib level.
Trade safely, and as always DYOR.
Cheers


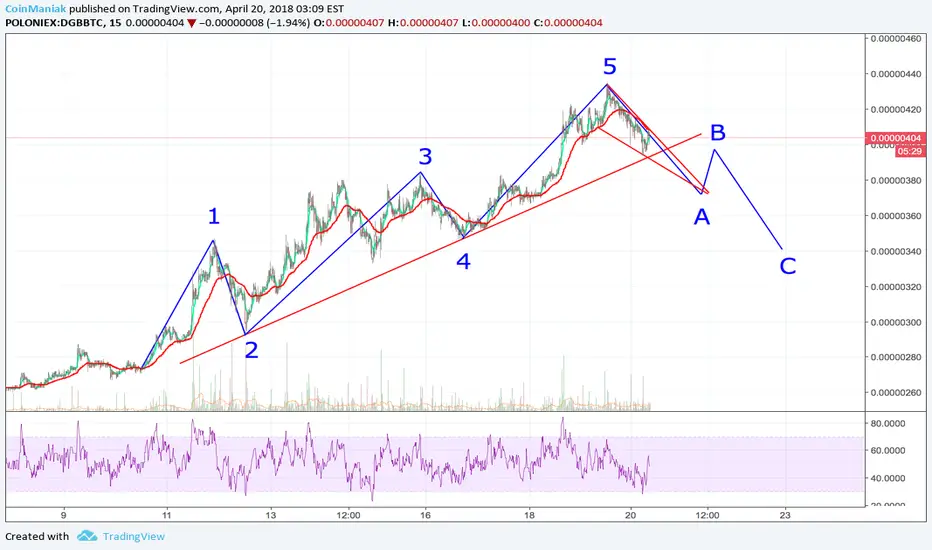
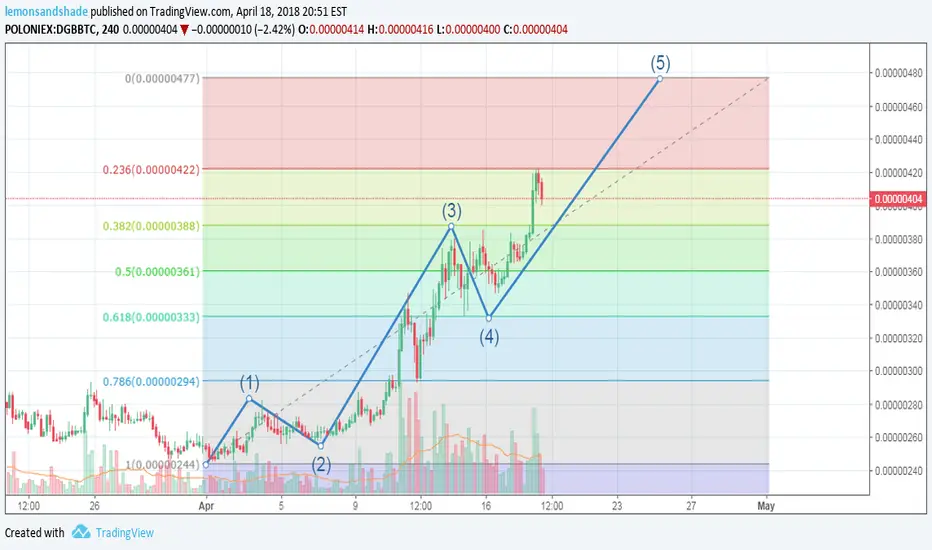
Digibyte - 4hour chart shows one more jump then minor correctionDigibyte is showing good volume and with the elliott wave count I have I think we have a little left to go in the 5th wave for 4 hour chart. Expecting a minor correction after target is hit then even a bigger blast off.
Digibyte Daily Analysis
Now I ain't crazy.... and I ain't a psychic... But I drew this yellow line yesterday as a potential first level of resistance if the DGB price did finally break through the 200 day moving average. And it looks like that's exactly where the price stopped today. All in all, Digibyte had a great day though. Busting above with pretty decent volume accompanying the move is an impressive showing the for the little guy.
We're overbought on the RSI and DGB needs to settle down and hopefully build a little base.
We have some possible support around the 3.1 cent level.
The 4 hour chart looks great. The two long wicks in either direction is a pretty good sign. Hopefully we can stay range bound up here for a while.
We might into a few "mini bosses" at this trend line dating back to December 2017. If we do then the price should advance to the
Niceeeeee! Let's get there and deal with it when the time comes.
So, I'm still a Bitcoin Maximalist but DGB is looking pretty good here. Let's see what happens! Worth a trade? You decide.

My thoughts on digibyte future, wave 2 then 3 and we are off. My thoughts only. Not financial advice.

Digibyte? Actually somehow still bullish here......Unlike Bitcoin, DGB somehow narrowly printed a green 1 today and we are already trading with a nice green 2 on the chart. This is exactly what you would have wanted to see out of Bitcoin today.... But, it didn't happen. DGB actually managed to pull this off and we're at least "setup" for some "bulls on parade" type action.
Now let's not get too excited because if BTC does a "crap sandwich" here then chances are DGB doesn't break out. Maybe there is an outlier event, maybe some bizarre XXX site partners with them or the pending phone wallets get some approval or something. Maybe old Jared does a speech at the White House, yea.... "anything can happen.'" As ya'll certainly know.
We're still flirting with this nice, long, saucer formation and that should be able to put some "umph" in the move if we do finally break out of here.
We're still between this 50 and 200 day moving average. Remember this... nothing good ever really happens under either of these. It's even worse when they're descending.
All and all, DGB is not in awful shape here. Wish BTC would have done the same today. Unfortunately, not the case.


Digibyte Profit Taking! Now What?Digibyte, along with most of the cryptos that are actually acting well all had 9 counts on the TD Sequential Indicator. All in all, nothing to really worry about. Just the move was exhausted and this is where profit taking usually occurs. Literally, the exact same action as the Bitcoin chart. Which to me, is rather healthy. This is giving the overbought RSI a chance to cool down and reset, the MACD is still in great shape and have plenty of room to run. DGB actually touched the top of the Bollinger Band and this all happened in concert with the TD 9 and RSI entering overbought territory. Everything lined up perfectly for a pause in the upward movement. This is what you want to see when you decide to do any trading. You want as many indicators as possible helping to assist you in putting the probabilities in your favor. No single indicator is going to be right all the time, you have to take a 360 degree view of the whole landscape before you execute a buy or sell.
If we can start to trade above 2.9 cents and close there tomorrow, then we will have a green 1. On Wednesday if we can get a green 2 then we should see some bullish action. The absolute best case for DGB is to trade above the 200 day moving average around 3.3 cents (hopefully with some decent volume and then you can buckle up for a nice move higher. Until then..... snooze fest.

Digibyte Analysis. Price StallingThe Digibyte price is stalling at the 200 day moving average. It was able to briefly trade above it yesterday but was rejected. This move coincided with the same action on the BTCUSD chart at the 50 day moving average. Also happening simultaneously is the daily 9 forming on the chart while using the Tom Demark Sequential Indicator. This is usually normally the time when profit taking occurs and the recent move pauses. Totally fine for DGB to sit around for a few days and then resume the next move upwards. Still a lot of bullishness in the chart here. This smack down also puts DGBUSD back below the saucer formation breakout level that it's been flirting with. Truth be told, the longer Digibyte stalls here, the greater and stronger the move can be once it finally busts out of range. It's well above the 50 day moving average and that should be strong support if the price should get into trouble. If DGBUSD loses the 50 day moving average at around 2.5 cents, then good night nurse and you're in for some trouble. Right now, this is just normal profit taking and I'm not too concerned with it. What do you think? Please comment below.

Digibyte 4 Hour Chart. BreakoutDigibyte is at a crucial breakout point on the 4 hour chart. This saucer formation started on March 12th and we're finally testing these levels today. A move out above this resistance point here should have some legs to get the price to the 3.5 cent level before pausing to at least digest the move. The RSI is flirting with overbought territory so that may delay the upside move but then again, anything can happen. The MACD did have a bearish cross a few hours ago but nothing that can't be reversed quickly.
I have to say, this DGBUSD chart does look bullish and while nobody knows how far this goes, the characteristics for higher prices are showing up in the chart.
BITTREX:DGBUSD

Digibyte | DGBBTC - 1 year ago and now same timeframesLet's see if it happens again, bull market must be confirmed. It plays out well until now on the same timeframes as last year.
In bull market we will get much more volume then last year.

Digibyte Price Analysis. There's a lot going on in this chart here.
Bullish Case
Digibyte has closed above the 50 day moving average for 2 consecutive days and it was above average volume. The volume acts as a good confirmation that this was a meaningful move and as long as we can hold the 50 DMA, we should be in good shape. If anything this should act as support if the price gets in trouble. If anything, it should at least bounce the price. Digibyte has also been challenging and flirting with the 200 day moving average. A break above and especially if some decent volume accompanies it, is very bullish. The MACD had a nice cross at the lows on April 2nd. Usually this type of divergence, (being the price heading down but the MACD crossing up) is a good indicator that the trend may be due to reverse. The cherry on top is the beautiful saucer pattern that started forming on March 3rd and that was also a crazy price action day for DGB. We're sitting at the top of the saucer right now and this also can help propel the price higher if it breaks out.
All of this is a perfect storm for higher Digibyte prices if we can break out of this area.
Bearish Case
Well the overall breadth and crypto market in general still has a lot of work to do and some serious "technical healing" on the longer term charts. The RSI is heading into overbought territory on the daily chart and this could potentially "pump the brakes" to make the price stall at the 200 day moving average.
Other than that.... not a whole lot of a case to be made for the bears here.

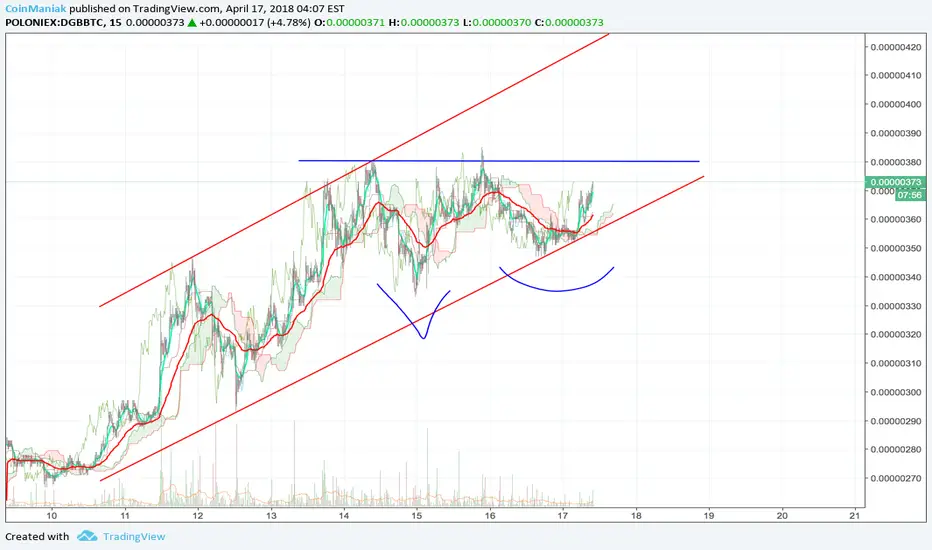
DGB/BTC Forming Inverse H/S Excellent LONG OpportunityDGB/BTC Forming Inverse H/S signaling a bullish trend reversal. Major resistance lines up with the latest bounce, let's see if it holds through the inverse H/S.

Potential Saucer Formation Breakout on the DGBUSD Chart!Nothing is certain.... However, DGBUSD forming a nice saucer like pattern on the daily chart. This started forming around mid March and is at the upper end of the saucer. A breakout here + it's meeting of the 50 day moving average is a critical point in this chart. A move higher and accompanied with some decent volume should make for a nice move to the upside. Failing here, which would be expected with the current bearish landscape of the crypto sector would be par for the course. Then again. Anything can happen. What do you think?

DGB needs to seize the day. Personally, this is better off as a long-term investment. However, I believe this coin severely under-performed in Q1. Say what you may about Bitcoin, DGB has not done much about bringing their blockchain ahead of others. (Marketing fund for what?).
DGB fundamentals are great. There is immense potential.
For about 2 1/2 months this coin traveled down the wedge and finally broke out. The volume at time of publishing is 469 BTC (Bittrex). The 1 and 3 Day MACD Chart looks superb for a long uptrend. RSI is around 54 with plenty of room to grow. Of course we have to see the correction first in order to gauge its next move. For now, a buy seems like a good bet. Wait for wave 2 correction though. Any where from 320-280 Sats could be a buy zone.
Don't take my word for it. These are merely thoughts. Prove yourself Digibyte!


DGB Flirting with the 50 Day. Ready for a major breakout?Digibyte has been testing the 50 day moving average and has been showing relative strength. A break through here with meaningful volume could send the price much higher. What do you think?

