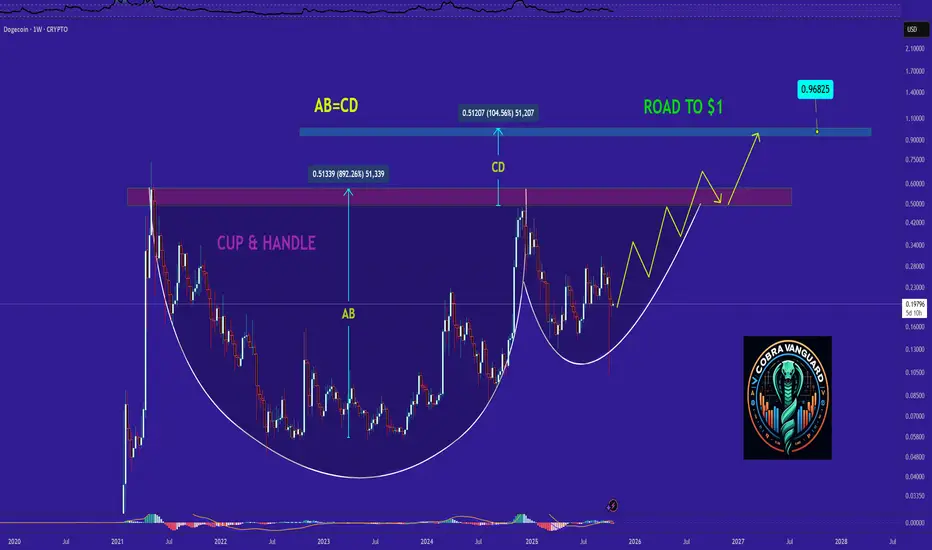
Can we be optimistic that this will come true?No matter how bad Dogecoin looks on lower timeframes, the higher timeframes tell a different story—one of strength and potential. As you can see, the weekly chart has formed a large Cup and Handle pattern. If this pattern breaks out, the price could easily surge above $1. So be patient and stay alert, because you don’t want to miss the next bull run.
Unfortunately, the harsh truth is that 99% of you *will* miss it.
Doge
DOGEUSD H4 | Bearish ReversalBased on the H4 chart analysis, we ccould se the price rise to the sel entry whichis an overlap resistance that is sligjhtly below the 38.2% FIbonacci retracement and could reverse from this level to the take profit.
Sell entry is at 0.20657, whichis an overlap resistance that is slightly below the 38.2% FIbonacci retracement.
Stop loss is at 0.21917, whichis a pullback resistance that lines up with the 50% Fibonacci retracement.
Take profit is at 0.17601, which is a swing low support.
High Risk Investment Warning
Trading Forex/CFDs on margin carries a high level of risk and may not be suitable for all investors. Leverage can work against you.
Stratos Markets Limited (tradu.com ):
CFDs are complex instruments and come with a high risk of losing money rapidly due to leverage. 65% of retail investor accounts lose money when trading CFDs with this provider. You should consider whether you understand how CFDs work and whether you can afford to take the high risk of losing your money.
Stratos Europe Ltd (tradu.com ):
CFDs are complex instruments and come with a high risk of losing money rapidly due to leverage. 66% of retail investor accounts lose money when trading CFDs with this provider. You should consider whether you understand how CFDs work and whether you can afford to take the high risk of losing your money.
Stratos Global LLC (tradu.com ):
Losses can exceed deposits.
Please be advised that the information presented on TradingView is provided to Tradu (‘Company’, ‘we’) by a third-party provider (‘TFA Global Pte Ltd’). Please be reminded that you are solely responsible for the trading decisions on your account. There is a very high degree of risk involved in trading. Any information and/or content is intended entirely for research, educational and informational purposes only and does not constitute investment or consultation advice or investment strategy. The information is not tailored to the investment needs of any specific person and therefore does not involve a consideration of any of the investment objectives, financial situation or needs of any viewer that may receive it. Kindly also note that past performance is not a reliable indicator of future results. Actual results may differ materially from those anticipated in forward-looking or past performance statements. We assume no liability as to the accuracy or completeness of any of the information and/or content provided herein and the Company cannot be held responsible for any omission, mistake nor for any loss or damage including without limitation to any loss of profit which may arise from reliance on any information supplied by TFA Global Pte Ltd.
The speaker(s) is neither an employee, agent nor representative of Tradu and is therefore acting independently. The opinions given are their own, constitute general market commentary, and do not constitute the opinion or advice of Tradu or any form of personal or investment advice. Tradu neither endorses nor guarantees offerings of third-party speakers, nor is Tradu responsible for the content, veracity or opinions of third-party speakers, presenters or participants.

DOGEUSDT (4h)The price has formed a bullish divergence on the 4-hour timeframe, which could lead to an upward move toward the resistance level.

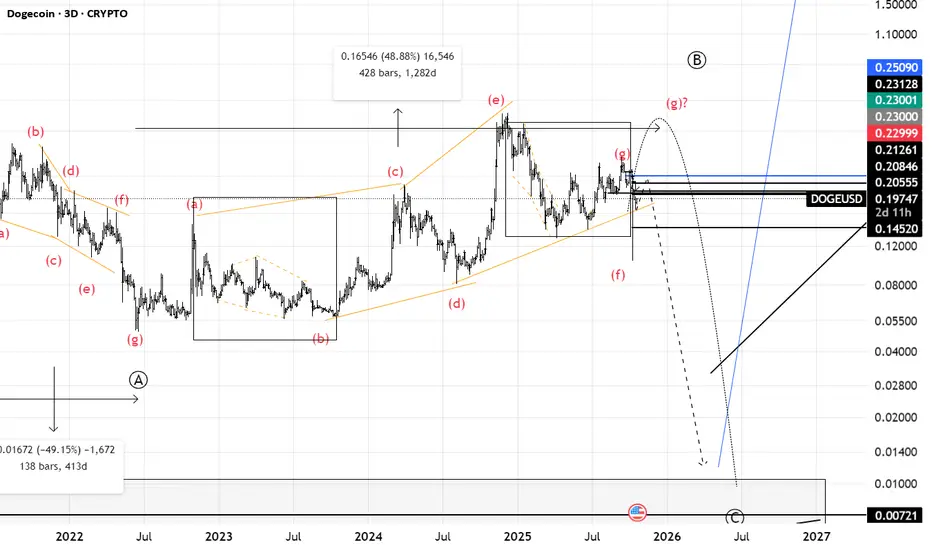
Doge(based on NEo wave)I think Its gonna be a flat and some how we will see a very strong bearish wave to 0.01$!
I dont see any bullish waves for long terms.
$DOGE Dogecoin 3rd cycle is being prepared.
History doesn't repeat itself.
It just continues its rhythm.
This time, the difference will be timing.

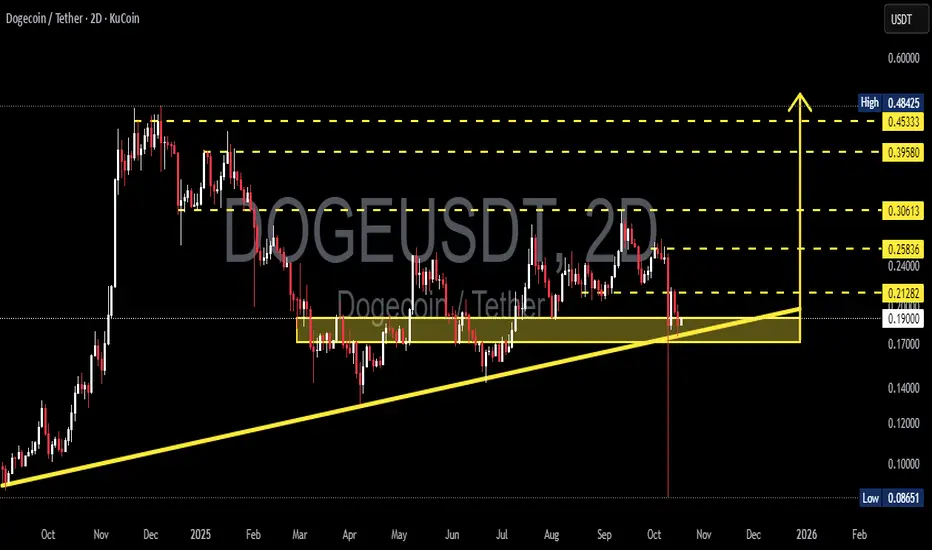
DOGE/USDT — On the Edge of a Major Reversal or a Deep Breakdown?DOGE is currently standing at the most critical zone of 2025. The price is testing the key confluence support area (0.171 – 0.190), reinforced by a mid-term ascending trendline.
This isn’t just a line — it’s the last stronghold for the bulls since early this year.
Each time DOGE has touched this yellow zone, buyers have stepped in aggressively. But this time feels different — selling pressure is intensifying, and the latest 2D candle shows a weak reaction at support.
The market is waiting for a major decision: reversal or deeper collapse.
---
🔹 Structure & Pattern
The chart shows a clear ascending accumulation base that has been forming for nearly a year.
The ascending trendline has acted as the backbone of accumulation since October 2024.
The horizontal range between 0.171–0.190 forms a macro demand zone that has repeatedly absorbed selling pressure.
However, the failure to break above the 0.258–0.306 resistance range reveals weakening bullish momentum.
At this point, price action is “dancing on the edge” — where just one decisive candle close could determine DOGE’s direction for the next few months.
---
🟢 Bullish Scenario: “The Bounce from the Abyss”
If the 0.171–0.190 zone holds and triggers a strong rejection, DOGE could launch a sharp reversal move.
Bullish confirmation:
Strong rejection from the yellow zone + 2D candle close above 0.2128.
Rising buy volume indicating re-entry by mid-term buyers.
Upside targets:
1. 0.2128 (initial confirmation)
2. 0.2583 (mid-range supply)
3. 0.3061 (key resistance)
4. 0.3958 – 0.45 (mid-term euphoria zone)
A breakout above 0.306 would likely trigger a trend continuation phase, targeting 0.45–0.48 as a mid-term expansion zone.
---
🔴 Bearish Scenario: “Crack in the Foundation”
If the price fails to hold above 0.171 and closes below the ascending trendline, this could signal the start of a large-scale distribution phase.
Bearish confirmation:
2D close below ~0.165 with strong sell volume.
Failed retest attempt back into the 0.171–0.190 zone.
Downside targets:
0.14 (minor support)
0.12 (final demand zone)
<0.10 (macro structural low at 0.0865)
If this scenario unfolds, DOGE may enter a long-term re-accumulation phase, awaiting fresh participation from institutional or “smart money” buyers.
---
⚖️ Technical Summary
DOGE is now at a macro trend decision point.
The yellow area (0.171–0.190) represents the last defensive wall for the bulls.
A breakdown below this zone = red alert for deeper correction.
But a strong rejection from this level could ignite a multi-week reversal rally toward 0.30+.
For swing traders, this is a golden zone to wait for confirmation.
For scalpers, this is a high-volatility range to capture short-term bounces.
---
#DOGE #DOGEUSDT #Dogecoin #CryptoAnalysis #TechnicalAnalysis #CryptoTrading #PriceAction #SupportResistance #Breakout #BullishScenario #BearishScenario #AltcoinAnalysis #TrendReversal #CryptoChart #SwingTrade
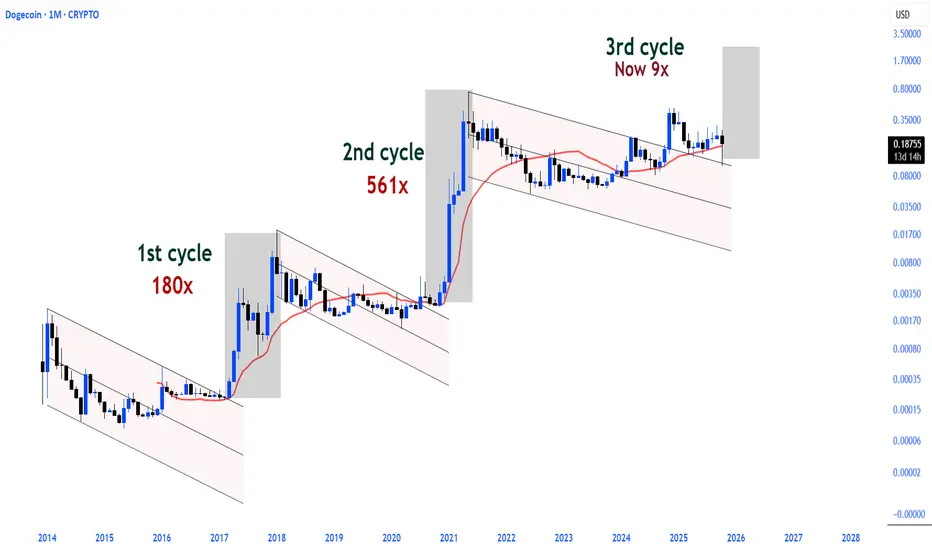
The storm is just beginning in $Doge 3rd cycle!The storm is just beginning in CRYPTOCAP:DOGE 3rd cycle!
Dogecoin gained 180x from bottom to top in its 1st cycle and 561x in its 2nd.
Now we're in our 3rd cycle so far it's only 9.7x, so that's probably nothing.
Doge never dies, it multiplies. 🔃
DOGE - BEARISH MOMENTUM. #DOGE - price analysis:
Main trend remain bearish & the current price is stuck under the H4 downtrend📉
H4 DOJI. .
Upper big resistances:
0.19500 - 0.200 - 0.2100$
Local support (double bottom D1): 0.1750 - 0.17600$
As long as bulls remain stuck under 0.200$ on the daily basis, we may see another could see another dump to visit the 0.1500$ support area! 📉
To sum up:
Indecision phase with big volatility, but momentum is bearish.

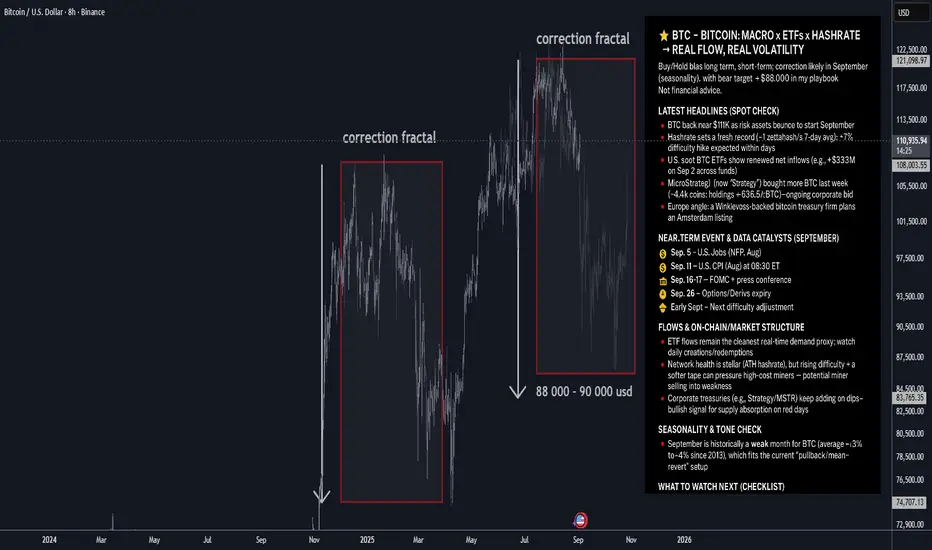
BTC — Bitcoin: Macro x ETFs x Hashrate → Real Flow, Real Volatil⭐️ BTC — Bitcoin: Macro x ETFs x Hashrate → Real Flow, Real Volatility
Buy/Hold bias long term; short-term: correction likely in September (seasonality), with bear target ≈ $88,000 in my playbook.
🔥 Latest headlines (spot check)
🔸BTC back near $111K as risk assets bounce to start September.
🔸Hashrate sets a fresh record (~1 zettahash/s 7-day avg); a >7% difficulty hike is expected within days. Network is the strongest ever, but miner margins tighten.
🔸U.S. spot BTC ETFs show renewed net inflows (e.g., +$333M on Sep 2 across funds). Flows remain a key daily demand gauge.
🔸MicroStrategy (now “Strategy”) bought more BTC last week (~4,4k coins; holdings ≈ 636.5k BTC)—ongoing corporate bid.
🔸Europe angle: a Winklevoss-backed bitcoin treasury firm plans an Amsterdam listing, signaling appetite for listed BTC exposure in the EU.
🗓 Near-term event & data catalysts (September)
🔸Fri, Sep 5 — U.S. Jobs (NFP, Aug) at 08:30 ET. Labor softness would bolster rate-cut odds and risk appetite; a beat could do the opposite.
🔸Wed, Sep 11 — U.S. CPI (Aug) at 08:30 ET. Inflation surprise drives real-rate expectations → BTC beta.
🔸Tue–Wed, Sep 16–17 — FOMC + press conference. Policy path & dot plot = macro volatility for BTC.
Fri, Sep 26 — Options/Derivs expiry:
• Deribit monthly BTC options expire 08:00 UTC (last Friday rule).
• CME Bitcoin monthly options settle Sep 26 as well.
These expiries often amplify gamma flows and spot-vol.
Early Sept — Next difficulty adjustment likely >7% up (tightens miner economics short-term).
Medium-dated overhang
Mt. Gox creditor deadline: Oct 31, 2025. Any schedule/details update could swing “supply overhang” narratives.
📈 Flows & on-chain/market structure
🔸ETF flows remain the cleanest real-time demand proxy; watch daily creations/redemptions. 🔸Sustained positives tend to align with spot strength; outsized outflows can weigh on price.
🔸Network health is stellar (ATH hashrate), but rising difficulty + a softer tape can pressure high-cost miners → potential miner selling into weakness.
🔸Corporate treasuries (e.g., Strategy/MSTR) keep adding on dips—bullish signal for supply absorption on red days.
🧠 Seasonality & tone check
September is historically a weak month for BTC (average ~−3% to −4% since 2013), which fits the current “pullback/mean-revert” setup.
📣 Social/flow buzz (signals, not noise)
🔸ETF flow posts (Farside, Bloomberg desks) are getting traction again—watch after U.S. close for prints.
🔸Saylor/Strategy buying headlines keep the “corporate bid” narrative front-and-center.
🧭 Levels & plan (author’s framework)
🔸Bias: Long-term constructive; near-term: correction mode likely extends through September (seasonality + event risk).
🔸Bear target: $88,000 (where I’d expect volatility to attract responsive buyers).
🔸Invalidation for bears (tactical): A strong reclaim/close above ~$113K–$115K with improving 🔸ETF inflows would weaken the pullback thesis.
🔸Sizing: Respect macro data days (NFP/CPI/Fed) and options expiry week—expect higher realized vol.
🗺 What to watch next (checklist)
🔸Daily U.S. spot BTC ETF flows (post-close updates). Momentum if creations persist; caution on redemptions clusters.
🔸Sep 5 — NFP (Aug) 08:30 ET. Risk-on if soft; risk-off if hot.
🔸Sep 11 — CPI (Aug) 08:30 ET. Headline/core surprises steer the FOMC tone.
🔸Sep 16–17 — FOMC + presser. Watch guidance on cuts, balance sheet, and growth.
🔸Sep 26 — Deribit & CME monthly expiries. Positioning/“max pain” dynamics into that Friday.
Difficulty adjustment (early Sept). If >7% up as projected, monitor miner behavior/sell pressure.
Doge- Support turned resistance. What's next?Friday’s crash took DOGE below two key support zones —
first, the ascending trendline around 0.23,
and then the horizontal support near 0.21.
After the drop, DOGE attempted a recovery that only brought it back to retest the broken 0.21 level, which has now turned into resistance. The price has since started to roll back down.
At this stage, if the negative sentiment across the crypto market continues, the probability of a deeper correction remains high — with the next significant target around 0.15.
Only a sustained move above 0.21 would neutralize this bearish scenario and open the path for a potential rebound.

DOGE Approaching Support – Potential Spot Long SetupDogecoin is currently trading around $0.1935, hovering near a key support zone ($0.18 – $0.20) that has historically held well. This area may offer an opportunity for a spot long entry, but the broader market remains fragile following last week's sharp sell-off. No clear higher-timeframe trend has emerged yet, so caution is warranted, and risk management must be prioritized.
💡 Trade Idea
Entry (Ladder In): $0.18 – $0.20
Take Profit Zones: $0.24 – $0.29 and $0.37 – $0.44
Stop Loss: Tight, just below $0.17

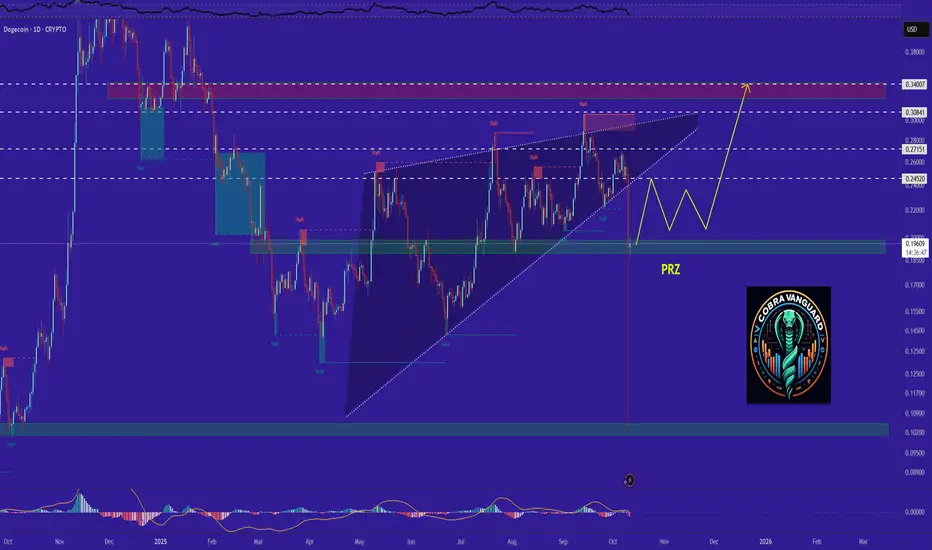
My only remaining hope for DOGE !!!My only remaining hope for dogecoin is this PRZ. If the price holds this level, it could rise above 0.25 otherwise, you know what will happen if this level breaked...
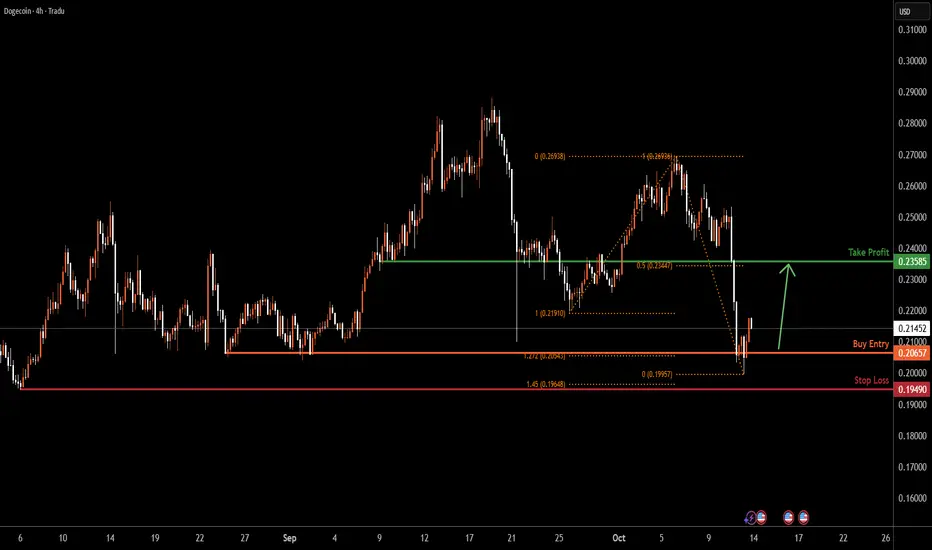
DOGEUSD H4 | Bullish ReversalBased on the H4 chart analysis, we can see that the price has bounced off the buy entry which is a multi-swings glow support that aligns with the 127.2% Fibonacci extension and could potentially rise from this level to the upside.
Buy entry is at 0.20657, which is a multi swing low support that aligns with the 127.2% Fibonacci extension.
Stop loss is at 0.19490, which is a pullback support that lines up with the 145% Fibonacci extension.
Take profit is at 0.23585, which is an overlap resistance that aligns with the 50% Fibonacci retracement.
High Risk Investment Warning
Trading Forex/CFDs on margin carries a high level of risk and may not be suitable for all investors. Leverage can work against you.
Stratos Markets Limited (tradu.com ):
CFDs are complex instruments and come with a high risk of losing money rapidly due to leverage. 65% of retail investor accounts lose money when trading CFDs with this provider. You should consider whether you understand how CFDs work and whether you can afford to take the high risk of losing your money.
Stratos Europe Ltd (tradu.com ):
CFDs are complex instruments and come with a high risk of losing money rapidly due to leverage. 66% of retail investor accounts lose money when trading CFDs with this provider. You should consider whether you understand how CFDs work and whether you can afford to take the high risk of losing your money.
Stratos Global LLC (tradu.com ):
Losses can exceed deposits.
Please be advised that the information presented on TradingView is provided to Tradu (‘Company’, ‘we’) by a third-party provider (‘TFA Global Pte Ltd’). Please be reminded that you are solely responsible for the trading decisions on your account. There is a very high degree of risk involved in trading. Any information and/or content is intended entirely for research, educational and informational purposes only and does not constitute investment or consultation advice or investment strategy. The information is not tailored to the investment needs of any specific person and therefore does not involve a consideration of any of the investment objectives, financial situation or needs of any viewer that may receive it. Kindly also note that past performance is not a reliable indicator of future results. Actual results may differ materially from those anticipated in forward-looking or past performance statements. We assume no liability as to the accuracy or completeness of any of the information and/or content provided herein and the Company cannot be held responsible for any omission, mistake nor for any loss or damage including without limitation to any loss of profit which may arise from reliance on any information supplied by TFA Global Pte Ltd.
The speaker(s) is neither an employee, agent nor representative of Tradu and is therefore acting independently. The opinions given are their own, constitute general market commentary, and do not constitute the opinion or advice of Tradu or any form of personal or investment advice. Tradu neither endorses nor guarantees offerings of third-party speakers, nor is Tradu responsible for the content, veracity or opinions of third-party speakers, presenters or participants.
DOGE - ASCENDING CHANNEL FORMATIONDOGE / GBP is forming an ascending channel pattern, many possible opportunities can be made with risk management from price action we currently have atm.

$Doge prepares quietly.In 2020, after breaking the major downtrend from its 2017 peak, Dogecoin experienced a brief period of accumulation and then began its own parabolic run.
A similar structure is forming again today.
The major downtrend from the 2021 ATH has already been broken, and it is currently undergoing a brief accumulation phase before its own bull run.
Short term fluctuations, panic, or euphoria...
It's all just noise.
In the big picture, the trend is moving in the right direction.
When the time comes, Dogecoin will once again begin its run "when no one expects it."

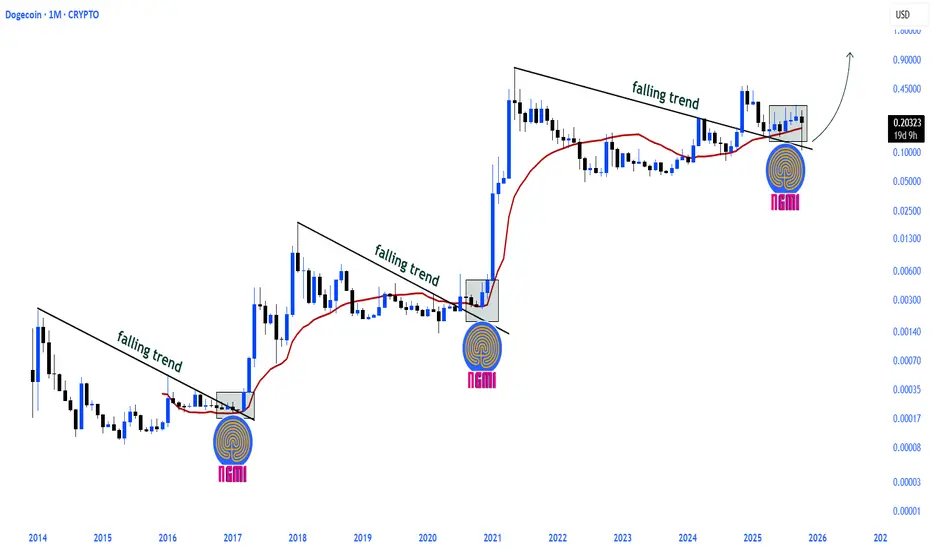
Zoom out $DOGEDogecoin entered each major run with similar structural signals throughout its history:
Persistence above the 25MA,
a long-term falling trend breakout,
and the subsequent retest phase.
Today, the chart is showing the same pattern again. The price is above the 25MA, the downtrend has been broken, and it is in the retest phase.
As in every cycle, this period is also a phase where the feeling of NGMI (Not Gonna Make It) is at its peak in the past, this sentiment coincided with the period immediately preceding parabolic runs.
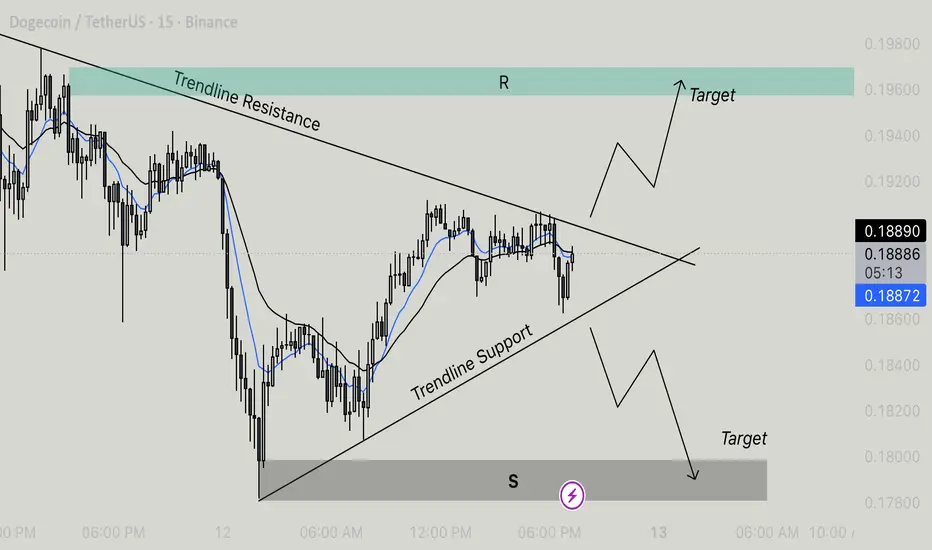
Doge Getting Ready For A Big MoveThe chart shows Dogecoin currently consolidating within a symmetrical triangle pattern — characterized by converging trendlines of resistance and support. This pattern typically signals an impending breakout, but the direction (upward or downward) depends on which boundary the price breaches first.
⸻
Key Levels
• Resistance Zone (R): Around 0.19600, marked by the upper trendline.
• Support Zone (S): Around 0.17800, marked by the lower trendline.
• Current Price: Approximately 0.1888 USDT.
⸻
Technical Outlook
• Trendline Resistance: Price has tested the upper boundary multiple times but has yet to break above it. A successful breakout above this line could trigger bullish momentum toward the 0.19600 target area.
• Trendline Support: The lower boundary is holding as dynamic support. A breakdown below this level would indicate bearish continuation, with a potential move toward the 0.17800 target zone.
• Moving Averages: The blue (short-term) moving average is closely tracking the black (medium-term) average, showing consolidation and indecision in the market. A crossover above or below could confirm breakout direction.
⸻
Scenarios
• Bullish Scenario:
If DOGE breaks above the resistance trendline, expect upside continuation toward 0.195–0.196 USDT. This would confirm a bullish breakout from the symmetrical triangle pattern.
• Bearish Scenario:
A decisive close below the trendline support could signal downward momentum, with a target near 0.178 USDT.
⸻
Summary
Dogecoin is at a critical decision point within a symmetrical triangle. Traders should watch for a confirmed breakout above resistance or breakdown below support for potential trade entries. Volume confirmation will strengthen the reliability of either breakout direction.
DOGEUSD Cycle Overview & Expectations🌀 Cycle Overview
The chart maps Dogecoin’s historical market structure through four major cycles, each divided into three internal phases (A, B, C).
Each full cycle represents a boom-and-correction pattern, with exponential price expansion followed by long consolidation — very typical of DOGE behavior across crypto macro cycles.
🟧 Cycle 1
Phases:
Cycle 1A: Accumulation near ~$0.00001
Cycle 1B: Gradual climb toward ~$0.0001
Cycle 1C: Speculative top near ~$0.00100
Color Theme:
Starts orange → represents early accumulation and small retail entry.
Behavior:
Initial market discovery, low liquidity.
Ended with a parabolic move that set the structural base for future channels.
🟩 Cycle 2
Phases:
Cycle 2A: Price stabilizes near ~$0.0001
Cycle 2B: Mid-runup toward ~$0.00100
Cycle 2C: Full speculative wave peaking near ~$0.01000
Color Theme:
Transitions into green, signaling mid-cycle growth and increasing participation.
Behavior:
This cycle mirrors the prior pattern — accumulation → lift-off → correction.
Each “bubble” expands roughly 10× compared to the last base.
The slope of the channel steepens slightly, reflecting higher volatility.
🟥 Cycle 3
Phases:
Cycle 3A: Base around ~$0.00100
Cycle 3B: Strong expansion to ~$0.01000
Cycle 3C: Mania phase to ~$0.70000–$0.80000 peak (2021 top)
Color Theme:
Transition from green → red, representing full speculative euphoria.
Behavior:
“Elon cycle” — exponential mania phase, extreme inflow, and retail frenzy.
The correction after red coincides with a long cooldown similar in length to past consolidation periods.
🟧 Cycle 4
Phases (projected):
Cycle 4A: Base around ~$0.10 (current region)
Cycle 4B: Target toward ~$1.00
Cycle 4C: Long-term extension possibly to ~$10.00
Color Theme:
Begins orange again — same tone as Cycle 1 → suggests we’re entering a new accumulation and launch sequence.
Behavior (expected):
Pattern implies exponential movement:
Base ($0.10) → 10× to $1 → 10× to $10
Each phase shows a repeating time rhythm (roughly 3–4 years per cycle).
🎨 Color Logic Summary
Color Meaning Emotional Tone Price Action Stage
🟧 Orange Accumulation Cautious optimism Flat or slow climb
🟩 Green Expansion Confidence, adoption Accelerating trend
🟥 Red Euphoria Overconfidence, peak Blow-off top → reset
📈 Price Progression by Cycle
Cycle Start Price Peak Price Gain Multiple
Cycle 1 $0.00001 $0.00100 ~100×
Cycle 2 $0.00010 $0.01000 ~100×
Cycle 3 $0.00100 $0.70000 ~700×
Cycle 4 (proj.) $0.10000 $10.00000 ~100× (est.)
🧭 Summary Insight
The structure repeats every 3–4 years, aligning with crypto macro liquidity cycles.
Each cycle begins orange (fear → disbelief), turns green (growth), and ends red (mania → collapse).
The current phase (Cycle 4A) marks the beginning of a new structural climb, with the next green phase likely around 2026–2027 if historical timing holds.

DOGE /;Hello friends
After a long time of suffering, Dogecoin finally made a move and collected good liquidity that can make it prone to good growth and the safest way, as I always tell you, is to buy in stages and with the observance of capital and risk management.
The goals are also specified.
*Trade safely with us*

$DOGE is reaffirming its historical cycle.The major falling trend breakout and again retest process is being completed.
As in previous cycles...
The price has maintained stability above the 25MA,
The RSI has regained momentum above the 50 level.
In the past, the simultaneous occurrence of these two conditions initiated a parabolic expansion phase for Dogecoin.
A similar technical structure is forming again.

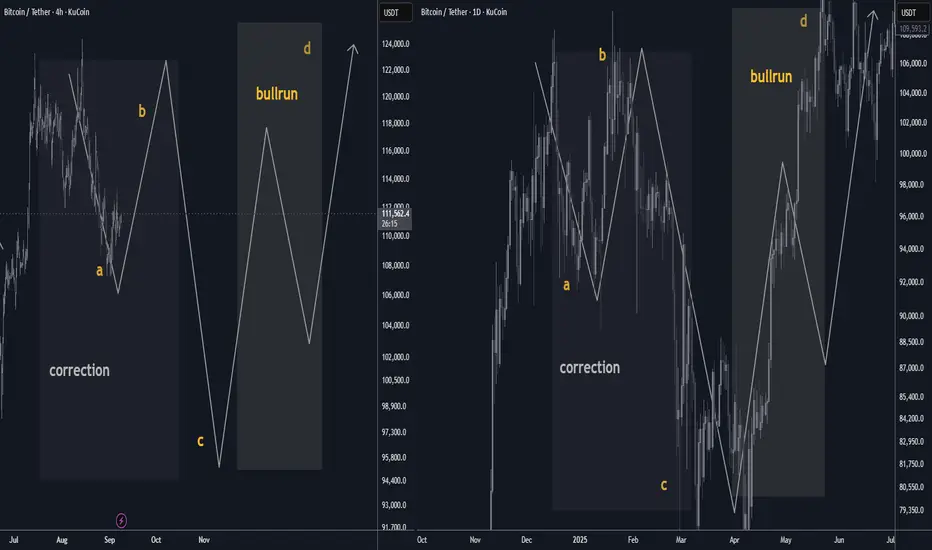
Bitcoin September 2025 Outlook: a/b/c price fractal structureBTC enters September post-ATH with a seasonal headwind. Base case: a ~10% A-leg dip toward $108k, a B-bounce into ~$122k, then a C-flush near ~$94k—echoing April’s ABC rhythm. Once complete, the uptrend should re-assert into year-end. 📉🔁📈 #Bitcoin #Seasonality #Crypto
🟠 Bitcoin September Outlook: Seasonality vs. Structure
After a fresh ATH, September’s historical bias skews mildly red. Base case is a ~10% A-leg dip that develops into an A/B/C correction before trend continuation. Think controlled pullback → consolidation → next markup. 📉➡️🔁➡️📈
________________________________________
🗓️ Seasonality Snapshot (2015–2024)
• Mean (10-yr): −2.55% · Median: −4.52%
• Red months: 6/10
• Worst September: 2019 (−13.88%)
• Best September: 2024 (+7.39%)
• Last 3 yrs avg: +2.8% (2024 +7.39%, 2023 +3.99%, 2022 −3.09%)
• Last 5 yrs avg (2020–2024): −1.3%
Read: September has tended to be weak, but the last two years printed green. Seasonality is a headwind—not a handbrake. 🌬️
________________________________________
🧩 Structure Thesis (Fractal Analog)
You’re looking for a repeat of April 2025’s A/B/C rhythm—scaled up:
• April 2025 reference: A ≈ $92k → B ≈ $106k → C ≈ $80k
• Now (projected):
o A ≈ $108k (≈ 10% pullback from recent highs) 📉
o B ≈ $122k (relief rally / lower high) 🔁
o C ≈ $94k (final flush into demand, completing the correction) 🧱
Interpretation: A measured September fade aligns with the A-leg. A reflexive B-bounce can follow as funding resets and late longs get cleaned up, with a C-leg completing the pattern before the next expansion. 🚀
________________________________________
📊 How Seasonality Supports the Call
• Typical drag: Median −4.5% and multiple red Septembers justify a down-bias.
• Volatility window: The historical 21-point spread (best +7.39% vs worst −13.88%) means a 10% dip sits well within normal bounds.
• Cycle context: With a new ATH just printed, a shallow corrective phase is constructive—not bearish regime change.
________________________________________
🧭 Levels & Triggers
• Bias line: Momentum cools into $108k → watch for seller absorption and open interest reset.
• Relief cap: $122k acts as B-rally resistance; sustained closes above $122k would invalidate the ABC idea and argue for immediate continuation. ✅
• Completion zone: $94k (C) is the buy-the-dip completion area; clean breaks below raise risk of a deeper time correction rather than a swift V-reversal. ⚠️
________________________________________
🧪 What to Monitor (Confirmation/Invalidation)
• Liquidity & OI: De-leveraging into A, controlled OI rebuild into B, washout into C.
• Spot-ETF flows / stablecoin issuance: Weakening into A, stabilizing by late month supports B→C rhythm.
• Funding/basis: Overheated → normalize during A; negative spikes near C often mark capitulation.
• Breadth (alts): Underperform into A/C; broad risk-on breadth usually returns post-C.
________________________________________
📝 Base Case Path (Textbook)
September: drift to $108k (A) → bounce toward $122k (B) → final tag of ~$94k (C) → reset + markup into Q4.
(If price reclaims and holds above $122k early, treat that as trend continuation—not a correction.)
________________________________________
🔒 Risk Notes
• Seasonality is a tendency, not a rule. Macro catalysts (CPI, policy, liquidity) can dominate calendar effects.
• This is market commentary, not financial advice. Manage risk and invalidation levels. 🛡️
A good and hopeful piece of news for Dogecoin !!As you can see, the price has completed its downward wave, and it has also closed above the trendline candle, which could be a sign of the beginning of upward waves.

DOGE's situation+next targets and expected movementsThe price can easily reach the shown targets from here.
Best regards CobraVanguard.💚