SHIBUSDTBINANCE:SHIBUSDT is now in first reaction to uptrend. I wait for pullback to breakout.
Please control risk management.⚠️
Doge

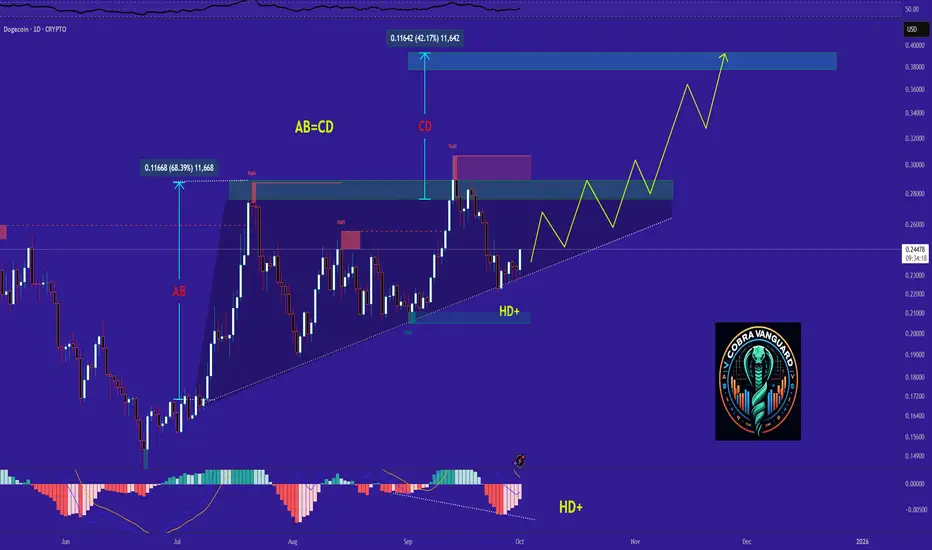
DOGE's situation+next targets and expected movementsThe price on the daily timeframe is within an ascending triangle, which can be promising. If the price breaks this pattern with bullish candles, it could easily rise by the distance of AB=CD, If my view is correct, DOGE will rise to 0.38 .
And if this pattern is correct and breaks, higher targets are possible.
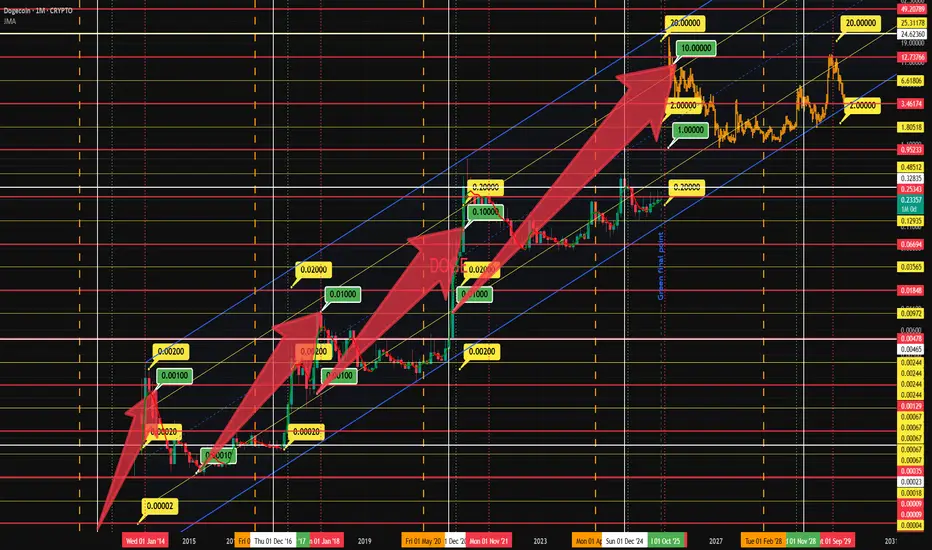
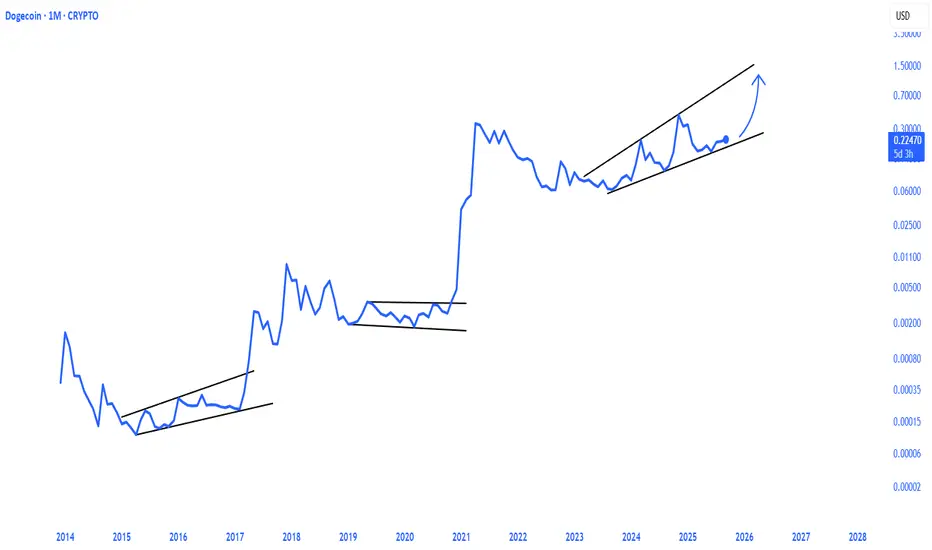
Pattern suggests DOGE will "remove two more zeros" this cycleThis Pattern has happeneD 3 cycles so far
cycle 1, a move from 0.0001 to 0.001 eliminating 2 Zeros (which is x1000)
cycle 2 a move from 0.0001 to 0.01 eliminating 2 Zeros (which is x1000)
cycle 3 a move from 0.001 to 0.1 eliminating 2 Zeros (which is x1000)
cycle 4 a move from 0.01 to 10$ eliminating 2 Zeros (which is x1000)
In other worDs
The chart projects Cycle 4-5 peaks up to $2-$20 (e.g., 2.0000, 5.0000, 20.0000), implying x100+ from current ~$0.23 (to $20 is ~x87, close to removing two zeros from 0.23 to 23).
This fits your examples: scaling from 0.0001 (early low) to 0.001 (x10, one zero), then to 0.01 (x100 total, two zeros), onward to 0.1-1 (x100-1000), and 1-10 (x10-100).
This pattern is driven by meme hype, Elon Musk endorsements, and broader crypto bull runs, but it's not uniform—gains have ranged from x45 to x430 historically. Projections to $10-20 (as in the chart) would require another x100-ish cycle.

DOGEUSD H4 | Bearish drop offBased on the H4 chart analysis, we can see that the price has rejected off the sell entry which is an overlap resistance that aligns with the 61.8% Fibonacci retracement and could drop from this level to our take profit.
Sell entry is at 0.23848, which is an overlap resistance that aligns with the 61.8% Fibonacci retracement.
Stop loss is at 0.25869, which is a pullback resistance that is slightly below the 61.8% Fibonacci retracement.
Take profit is at 0.2184, which is a pullback support.
High Risk Investment Warning
Trading Forex/CFDs on margin carries a high level of risk and may not be suitable for all investors. Leverage can work against you.
Stratos Markets Limited (tradu.com ):
CFDs are complex instruments and come with a high risk of losing money rapidly due to leverage. 65% of retail investor accounts lose money when trading CFDs with this provider. You should consider whether you understand how CFDs work and whether you can afford to take the high risk of losing your money.
Stratos Europe Ltd (tradu.com ):
CFDs are complex instruments and come with a high risk of losing money rapidly due to leverage. 66% of retail investor accounts lose money when trading CFDs with this provider. You should consider whether you understand how CFDs work and whether you can afford to take the high risk of losing your money.
Stratos Global LLC (tradu.com ):
Losses can exceed deposits.
Please be advised that the information presented on TradingView is provided to Tradu (‘Company’, ‘we’) by a third-party provider (‘TFA Global Pte Ltd’). Please be reminded that you are solely responsible for the trading decisions on your account. There is a very high degree of risk involved in trading. Any information and/or content is intended entirely for research, educational and informational purposes only and does not constitute investment or consultation advice or investment strategy. The information is not tailored to the investment needs of any specific person and therefore does not involve a consideration of any of the investment objectives, financial situation or needs of any viewer that may receive it. Kindly also note that past performance is not a reliable indicator of future results. Actual results may differ materially from those anticipated in forward-looking or past performance statements. We assume no liability as to the accuracy or completeness of any of the information and/or content provided herein and the Company cannot be held responsible for any omission, mistake nor for any loss or damage including without limitation to any loss of profit which may arise from reliance on any information supplied by TFA Global Pte Ltd.
The speaker(s) is neither an employee, agent nor representative of Tradu and is therefore acting independently. The opinions given are their own, constitute general market commentary, and do not constitute the opinion or advice of Tradu or any form of personal or investment advice. Tradu neither endorses nor guarantees offerings of third-party speakers, nor is Tradu responsible for the content, veracity or opinions of third-party speakers, presenters or participants.

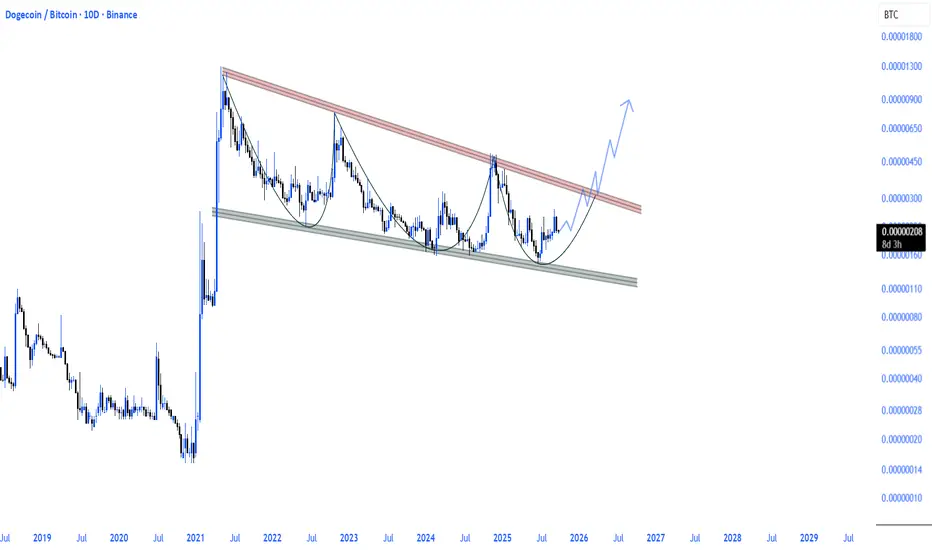
$DOGE / $BTC An upward movement is inevitable in the Dogecoin Bitcoin pair with a descending wedge formation.
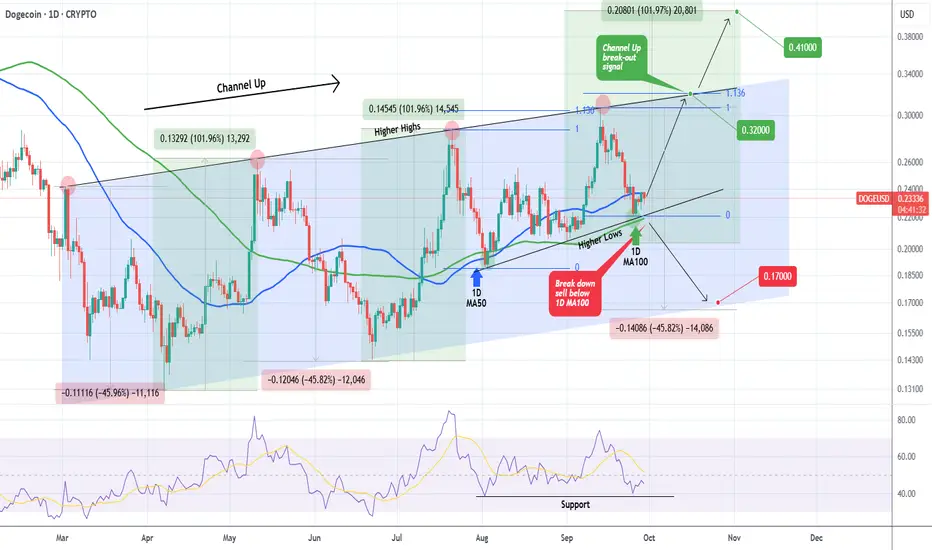
DOGE This is how to trade it in October.Dogecoin (DOGEUSD) has been trading within a Channel Up since March but recently has found a new Support on the Higher Lows trend-line that started on the August 03 Low. This price action has been additionally supported by the 1D MA100 (green trend-line).
As long as the 1D MA100 holds, October should see at least Doge testing the top (Higher Highs trend-line) of the pattern. Given that the previous Higher Lows rebound peaked on the 1.136 Fibonacci extension, our Target will be 0.3200.
If the Higher Highs trend-line breaks (1D candle close above it), extend buying to a total +101.96% rise from the bottom, targeting 0.41000.
If however the 1D MA100 breaks (candle close below it), we expect the Channel Up to go for a full pricing of a Higher Low bottom, on a similar -45.82% decline to both previous Bearish Legs, targeting 0.17000.
As a result, the current price action, which has Doge sitting just above the 1D MA100, offers a great reward on the lowest possible risk.
-------------------------------------------------------------------------------
** Please LIKE 👍, FOLLOW ✅, SHARE 🙌 and COMMENT ✍ if you enjoy this idea! Also share your ideas and charts in the comments section below! This is best way to keep it relevant, support us, keep the content here free and allow the idea to reach as many people as possible. **
-------------------------------------------------------------------------------
💸💸💸💸💸💸
👇 👇 👇 👇 👇 👇
LIGHT CONFIRMS THE MAIN TREND - BREAK VIEWAfter the confirmation of the main trend zone, there is a good chance this coin is able to break to a new trend level, with the possibility of up $2

Doge parabolicThe parabolic run of CRYPTOCAP:DOGE is inevitable.
Dogecoin hasn't actually pumped up in the current cycle yet.

Dogecoin $DOGE dominance is reversing.Dogecoin dominance is nearing completion of a breakout from a falling trend and retest ahead of a major upward wave.

usdt.d 4hHello friends
I am Mehdi and I wanted to say that if you are currently in profit compared to the position we announced
It is better to have a save profit and move the stop loss to the entry point
I would appreciate it if you support me with likes and comments

DOGE 1D Analysis - Key Triggers Ahead❄️ Welcome to the cryptos winter , I hope you’ve started your day well.
⏰ We’re analyzing BINANCE:DOGEUSDT on the 1-Day timeframe .
👀 Daily timeframe on Dogecoin shows it’s moving inside a strong ascending channel. Right now, price is sitting below the midline resistance of the channel, while holding support from an uptrend line. DOGE is in a decision zone, and because it’s the weekend, volume has dropped. Breaking out of the structure it has formed may happen with the new weekly open.
If Dogecoin loses the trendline support, it can head toward the bottom of the channel at $0.17. If it breaks the resistance it’s reacting to, price could move toward the top of the channel at $0.30, and even break to higher levels.
🧮 RSI shows two key zones the 70 level acts as resistance and marks entry into OverBuy, and the 38 level is a static support zone. If price crosses below that 38 level, short-side volatility can increase heavily and push RSI into Oversell.
🕯 Candle size and volume behavior from the start of the channel show volume and candle size decrease near the top and increase near the bottom. Right now, because price is at the midline area, it has rejected this level with a stronger red candle and bigger volume, moving lower. For price to move back above the midline and break that resistance, we need to see an increase in buying volume and larger bullish candles so a trend reversal can form toward higher resistances.
💸 BINANCE:DOGEBTC pair shows price moving along an ascending trendline similar to the DOGE/USDT pair. This trendline acts as a confluence: every touch so far has pushed price upward. Now we are on the fourth touch. If the daily candle closes below this trendline, a deeper correction can happen and push Dogecoin to lower support areas.
🧠 For trading DOGE, patience is needed and we should wait for higher timeframe candle closes. Once price confirms at the marked levels, the new trend and breakout from current structure will be clear and we can open positions. That gives us two possible scenarios:
1️⃣ Short position scenario : Break and close below the trendline that overlaps on both DOGE pairs, RSI dropping under the 38 zone, volume increase, and a confirmed breakout from the current structure on multi-timeframe view.
2️⃣ Long position scenario : A reaction from the overlapping trendline support on both pairs, RSI holding above the 38 zone, then a break of the nearest multi-timeframe resistance to build a higher low and higher high. If that plays out, I’ll update this scenario.
❤️ Disclaimer : This analysis is purely based on my personal opinion and I only trade if the stated triggers are activated .


DOGE 1D Analysis – Key Triggers Ahead💀 Hey , how's it going ? Come over here — Satoshi got something for you !
⏰ We’re analyzing DOGE on the 1-Day timeframe timeframe.
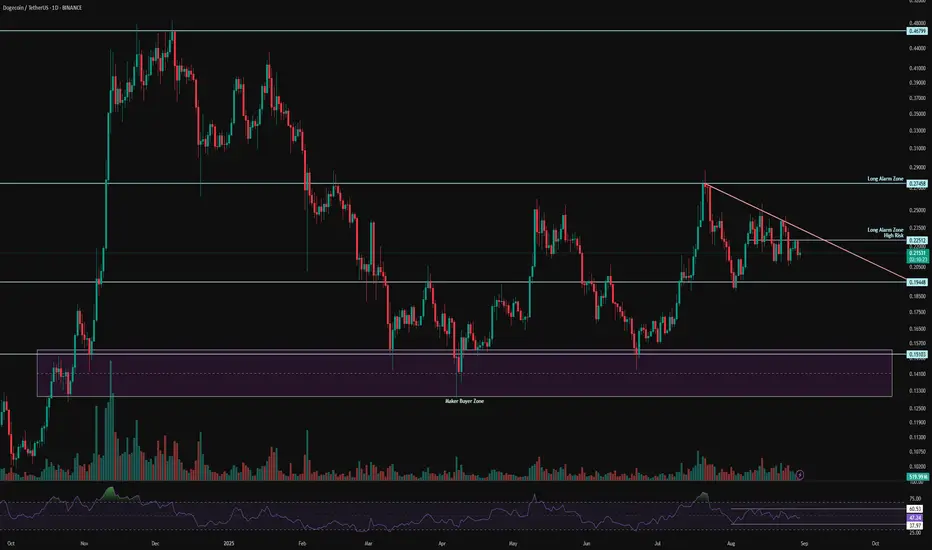
👀 In the daily timeframe of Dogecoin, DOGE is within a 170-day box with a ceiling at $0.27 and a floor at $0.15. With a breakout of this box, Dogecoin can experience a parabolic move. DOGE is currently in a triangle-like compression, and with an exit from this compression, DOGE can start its upward movement.
💰 In the daily timeframe of DOGEBTC , We observe that the volume has significantly decreased, and much less Bitcoin is being converted into DOGE! This is quite interesting. The reason DOGE has a box-like behavior against Tether is due to its pairing with Bitcoin. Bitcoin has gained more value against Dogecoin, and DOGE has entered an accumulation phase. Breaking out of this box can help DOGE experience a price jump.
⚙️ Two key RSI zones have been considered: 60 and 38. Exceeding these levels can help DOGE break out of the compression. The 60 level coincides with the break of the $0.22 area and the top of the compression.
🕯 There is a micro buyer zone around $0.15, where every time the price reaches this area, a reversal occurs, accompanied by an increase in the size and volume of green candles. Currently, during the holidays, we are in a compression with lower volume. As the new week begins, we need to see what happens next.
🔔 The alarm zone for Dogecoin is $0.22, which can present some risky trading opportunities, and the next zone is $0.27, which is a strong price action level. Breaking this ceiling can allow DOGE to reach higher recovery levels against Bitcoin.
❤️ Disclaimer : This analysis is purely based on my personal opinion and I only trade if the stated triggers are activated .
usdt.d 4husdt.d 4h
🔎 A few notes from the chart:
The chart is located on the PRZ (Potential Reversal Zone) or the harmonic pattern completion zone.
The candles have reached an important resistance zone after rising.
At PRZ, we usually expect a reversal (return to the bottom), especially when it overlaps with Fibonacci levels and the trend line.
It is characteristic that a green rectangle (probably a sell position) has been drawn on the chart, which indicates that we expect a decline.
📌 Conclusion:
Due to the harmonic structure + PRZ support, the probability of a price reversal and a downward move is higher ✅

IMX/USDT THE BREAK IS NOT FAR 26/09/2025 update📊IMX/USDT Update
On the low time frame, IMX is rebounding from the 0.705 – 0.709 support zone and is now testing the main trend zone at 0.728.
Key levels:
0.728 → main trend resistance. A breakout and hold above this level would shift momentum bullish.
0.782 → breakout target zone. If 0.728 is cleared with volume, price could accelerate toward 0.78+ quickly.
0.705 → key support. As long as price holds above, structure stays intact.
Upside scenario:
If IMX breaks 0.728 with confirmation (strong candle + volume), expect bullish momentum into 0.782.
📌 Summary
Above 0.728 → breakout possibility target 0.782 - 0.88
And in whale+ breakout could enter up $1
Hold above 0.705 → trend support remains strong.
Risk zones
correction risk toward 0.63
Cycle hold target up $0,47

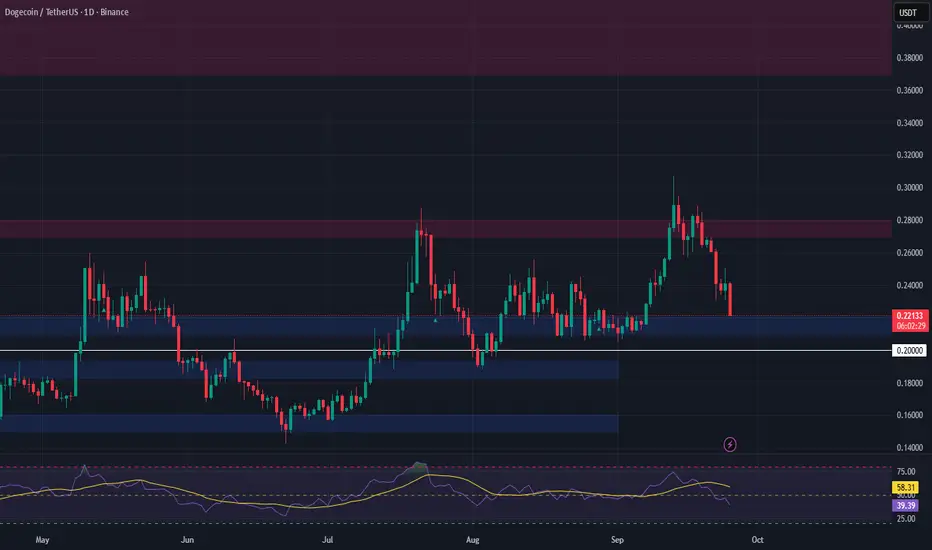
DOGEUSDT Slightly Up, Targeting New HighsIn recent days, DOGEUSDT has seen a slight increase, recovering after hitting its lowest point in several weeks. The growth of DOGE is mainly driven by buying activity at lower levels and improved market sentiment, although the USD remains strong due to positive economic data from the US.
The DOGEUSDT chart is currently trading within a clear upward price channel . The price has found strong support at 0.1950 and is showing signs of recovery. If DOGE can continue to break through the resistance at 0.2730, there is a high likelihood of reaching the target of 0.2730 or higher in the short term.
DOGEUSDT has the potential to continue rising due to the current recovery and strong technical support. Keep an eye on market confirmation to capitalize on trading opportunities.

DOGEUSD H4 | bearish drop offfBased on the H4 chart analysis, we could see the price rise to the sell entry which is an overlap resistance and could potentially drop from this level to the downside.
Sell entry is at 0.23848, which is an overlap resistance.
Stop loss is at 0.25869, which is a pullback resistance.
Take profit is at 0.20629, which is a pullback support.
High Risk Investment Warning
Trading Forex/CFDs on margin carries a high level of risk and may not be suitable for all investors. Leverage can work against you.
Stratos Markets Limited (tradu.com ):
CFDs are complex instruments and come with a high risk of losing money rapidly due to leverage. 65% of retail investor accounts lose money when trading CFDs with this provider. You should consider whether you understand how CFDs work and whether you can afford to take the high risk of losing your money.
Stratos Europe Ltd (tradu.com ):
CFDs are complex instruments and come with a high risk of losing money rapidly due to leverage. 66% of retail investor accounts lose money when trading CFDs with this provider. You should consider whether you understand how CFDs work and whether you can afford to take the high risk of losing your money.
Stratos Global LLC (tradu.com ):
Losses can exceed deposits.
Please be advised that the information presented on TradingView is provided to Tradu (‘Company’, ‘we’) by a third-party provider (‘TFA Global Pte Ltd’). Please be reminded that you are solely responsible for the trading decisions on your account. There is a very high degree of risk involved in trading. Any information and/or content is intended entirely for research, educational and informational purposes only and does not constitute investment or consultation advice or investment strategy. The information is not tailored to the investment needs of any specific person and therefore does not involve a consideration of any of the investment objectives, financial situation or needs of any viewer that may receive it. Kindly also note that past performance is not a reliable indicator of future results. Actual results may differ materially from those anticipated in forward-looking or past performance statements. We assume no liability as to the accuracy or completeness of any of the information and/or content provided herein and the Company cannot be held responsible for any omission, mistake nor for any loss or damage including without limitation to any loss of profit which may arise from reliance on any information supplied by TFA Global Pte Ltd.
The speaker(s) is neither an employee, agent nor representative of Tradu and is therefore acting independently. The opinions given are their own, constitute general market commentary, and do not constitute the opinion or advice of Tradu or any form of personal or investment advice. Tradu neither endorses nor guarantees offerings of third-party speakers, nor is Tradu responsible for the content, veracity or opinions of third-party speakers, presenters or participants.

DOGE — Watching for a Relief Bounce from SupportDogecoin has pulled back into a key support zone at $0.21–$0.22, a level that has historically acted as both resistance and support. With the broader market showing signs of consolidation, this area could offer a short-term bounce opportunity.
That said, this is likely a relief rally within a broader downtrend, so managing risk is critical. A failure to hold this support could lead to a deeper correction later this month.
🔹 Trade Plan:
• Entry Zone: $0.21–$0.22
• Targets: $0.27–$0.28, $0.37–$0.44
• Stop Loss: Below $0.20
This is a spot-only setup with an asymmetric risk-reward profile if the bounce materializes. Avoid overleveraging and stick to your plan.
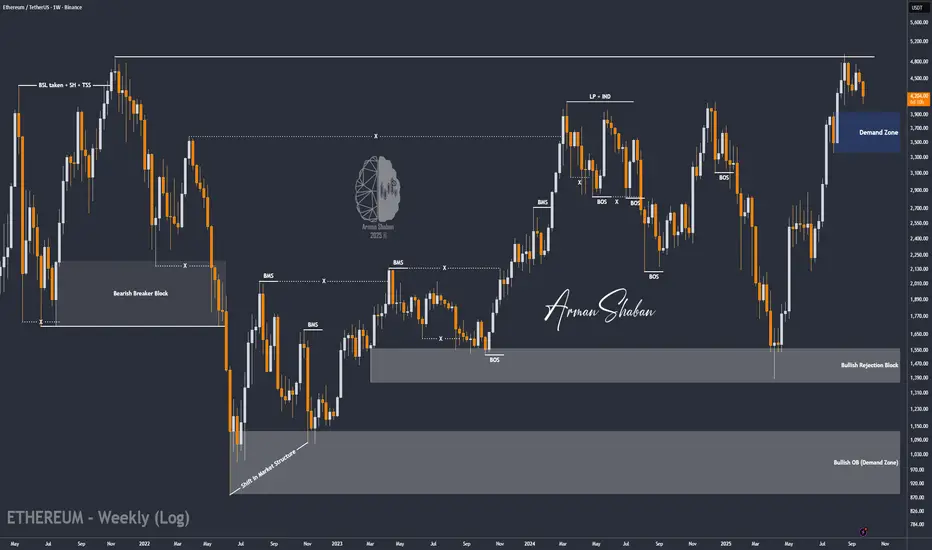
ETH/USDT | Correction Over? Big Rally Loading After Demand ZoneBy analyzing the Ethereum chart on the weekly timeframe, we can see that after Bitcoin’s heavy dump , ETH also corrected and is now trading around $4,200 .
Based on the previous analysis, the $3,300–$3,900 zone is still a key demand area. If the price enters this zone, I expect Ethereum to start its next bullish wave.
The possible upside targets for this rally are $5,100, $5,500, and $6,000.
Please support me with your likes and comments to motivate me to share more analysis with you and share your opinion about the possible trend of this chart with me !
Best Regards , Arman Shaban
Doge(based on NEo wave)according to last counting of doge, under 0.23$ it means its a bow-tie diametric and it takes about 1 more week for correction.

Don’t Underestimate Dogecoin!Dogecoin is one of my favorite setups. I’m loving this market cycle — it looks exactly like Bitcoin before 2017 happened. I believe it’s setting up for a huge parabolic run that could make people very rich. I’m extremely excited about this setup.
As always, stay profitable.
— Dalin Anderson
