DOGE rejected on its 6-month Resistance. What's next?Dogecoin (DOGEUSD) eventually made the bullish break-out we talked about on our last analysis above the top (Lower Highs trend-line) of the Triangle but got emphatically rejected on its 6-month Higher Highs trend-line.
That is the main Resistance holding since March 03. Last time it delivered a rejection that tested the 1D MA50 (red trend-line) before a new rebound. As a result, if the price closes a candle below the 4H MA50 (blue trend-line), it is more likely to see a new 1D MA50 test around 0.23000 before the decisive rebound that might attempt to break above the 6-month Resistance.
If the 4H MA50 holds, we could go for the Resistance break-out immediately. In either case, our 0.4100 medium-term Target stands.
-------------------------------------------------------------------------------
** Please LIKE 👍, FOLLOW ✅, SHARE 🙌 and COMMENT ✍ if you enjoy this idea! Also share your ideas and charts in the comments section below! This is best way to keep it relevant, support us, keep the content here free and allow the idea to reach as many people as possible. **
-------------------------------------------------------------------------------
💸💸💸💸💸💸
👇 👇 👇 👇 👇 👇
Doge

DOGE Explodes After Every BTC Milestone – Is 124,000 Next?History doesn’t just rhyme — it barks! Every time Bitcoin breaks a major psychological level (124 → 1,240 → 12,400), DOGE launches into a parabolic move shortly after. The pattern is clear: as BTC enters a new order of magnitude, DOGE follows with exponential gains — from fractions of a cent to over $0.70.
With BTC eyeing 124,000, the setup is eerily similar to past cycles. As smart money rotates from BTC into altcoins, DOGE historically becomes one of the biggest beneficiaries. If history repeats (or even rhymes), we could be staring down the next meme-fueled rocket ride.
📈 Keep your eyes on BTC — when it breaks the next big level, DOGE may not wait around.

DOGE/USDT - H4 - Breakout (17.08.2025)The DOGE/USDT pair on the H4 timeframe presents a Potential Buying Opportunity due to a recent Formation of a Breakout Pattern. This suggests a shift in momentum towards the upside and a higher likelihood of further advances in the coming Days.
Possible Long Trade:
Entry: Consider Entering A Long Position around Trendline Of The Pattern.
Target Levels:
1st Resistance – 0.2809
2nd Resistance – 0.3062
🎁 Please hit the like button and
🎁 Leave a comment to support for My Post !
Your likes and comments are incredibly motivating and will encourage me to share more analysis with you.
Best Regards, KABHI_TA_TRADING
Thank you.

The Power of 50 & DOGEThis chart beautifully illustrates how DOGE’s growth trajectory mirrors an exponential scale structured around multiples of 5. These levels aren’t arbitrary — they have acted as pivot points across cycles, reinforcing the theory that in crypto, round numbers — especially multiples of 5 — matter more than most think.
🔹 Key Observations:
✅ Price Milestones in 5s
The chart emphasizes repeating and powerful price zones built around multiples of 5:
Key Level Meaning/Context
$0.00005 Historic early low (2014)
$0.00500 Mid-cycle breakout zone (2017 & 2020)
$0.05000 Psychological resistance-turned-support (2021)
$0.50000 Next major mid-range resistance — half dollar psychological level
$5.00000 Long-term bullish target — marks a full 100x move from $0.05
$25.00000 Final upper-bound projection within the “power curve”
Each of these levels acts as magnet zones where price tends to pause, consolidate, or reverse, revealing their psychological and cyclical importance in DOGE’s market behavior.
🔹 Channel Structure & Fibonacci Alignment
The blue logarithmic channel anchors DOGE’s macro trend, with sub-divided levels (1.0, 1.1, 1.2... to 1.5) marking growth acceleration zones.
The yellow/gold diagonal lines intersect key “5-level” prices, showing that exponential rallies often align with them.
Green final point marks a confluence zone between structure and the 1.0 channel line, suggesting potential accumulation or pivot.
🔹 Cycle Timing
The orange/red vertical lines mark historical macro tops and bottoms.
Each major run-up (2017, 2021) has seen price skyrocket through 0.005 → 0.05 → 0.50 within 1–2 years.
The next zone of interest sits at $5.00, mirroring this "power of 5" progression in both price and time structure.
🔹 Psychological Impact
Each “5-level” is not just technical — it represents investor psychology milestones:
Sub-penny to $0.005 = speculative risk
Crossing $0.05 = early mainstream recognition
$0.50 = media hype + retail rush
$5.00+ = mass adoption or mania phase

DOGE USDT is break out Doge breaks through the resistance
Targets for the traders
0.36$
0.48$
0.7$
A break above $0.74 will open the way for larger targets of up to $4

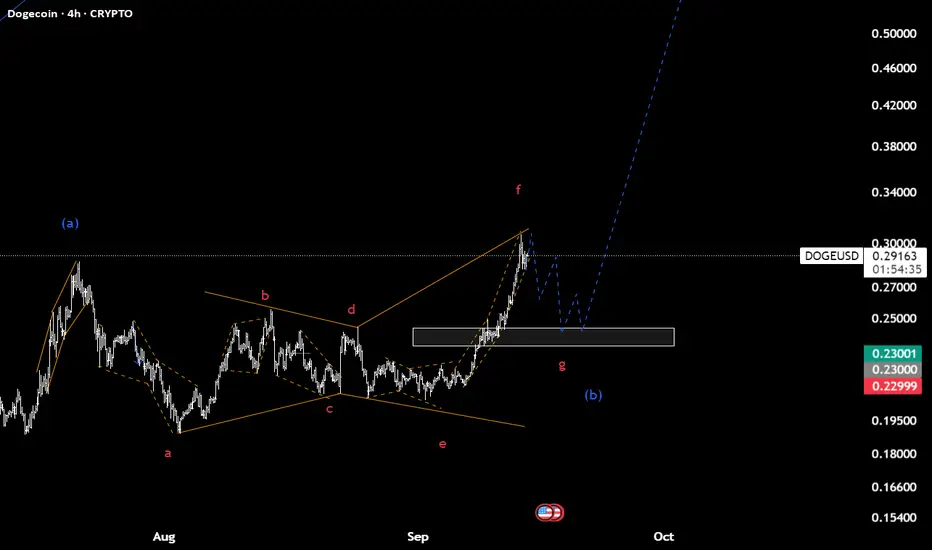
Doge(based on NEo wave)wave (b) is at the end and last chance to buy in low price.
I think a heavy bullish wave is coming and you can see targets on cycle analysis which I reply on that.
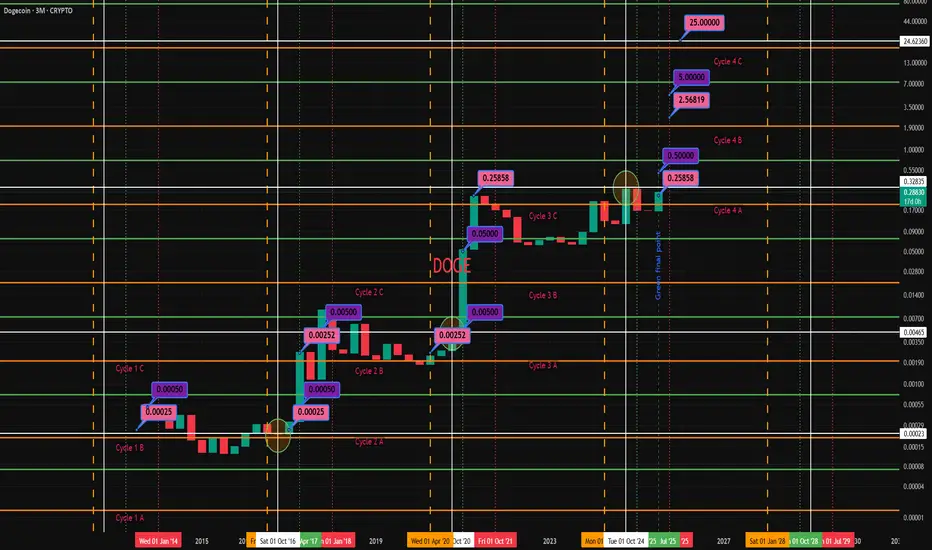
DOGE Cycle Analysis | Play It Safe | Wicks Removed Key Price LevDOGE Cycle Analysis | 3M Log View | No Wicks
This chart explores historical DOGE price action through macro cycles (3M candles). Wickless candles are used to eliminate noise and focus on clean body closes for better decision-making. Key support/resistance levels and psychological targets are labeled.
📌 Currently entering Cycle 4
🔍 Important Price Levels to Watch:
(Without wicks; body closes only)
Targets:
$0.50
$2.56 – $5.00
$25.00 (final blow-off top target?)

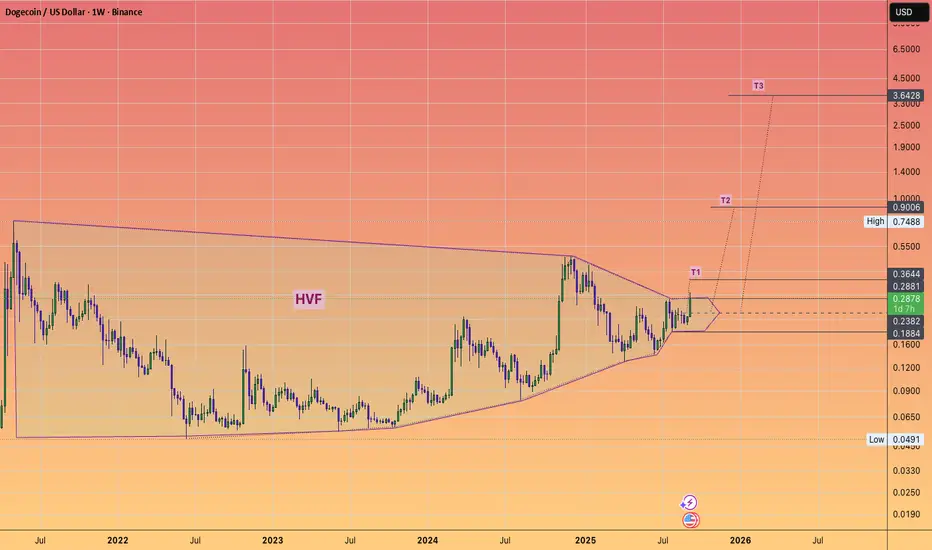
DOGECOIN can go higher than you think.#DOGE
Can get to around 4 Bucks a coin.
Yea I know thats around half a trillion of marketcap.
What does the @TheCryptoSniper think of this #HVF
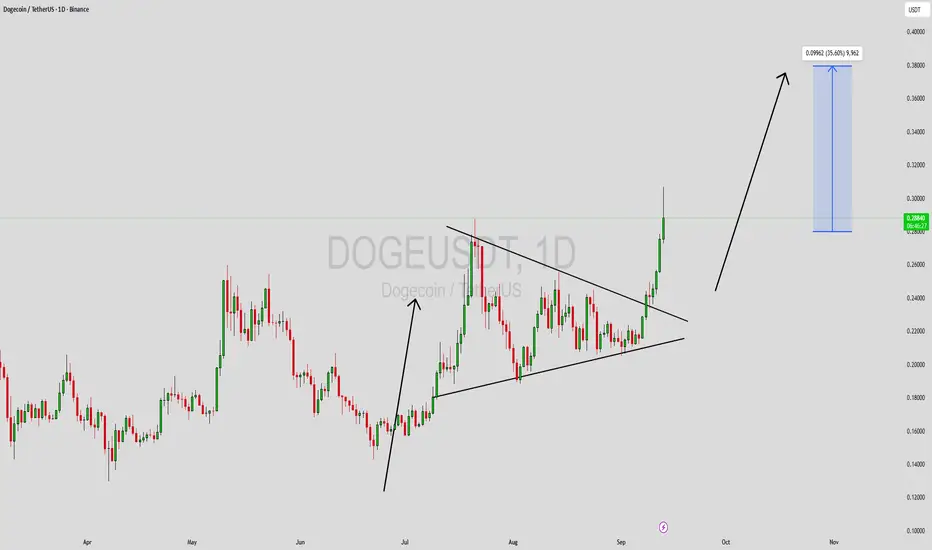
DOGEUSDT Forming Bullish WaveDOGEUSDT is currently forming a bullish wave pattern, signaling strength and potential upside momentum. The price action has been supported by good trading volume, indicating active participation from buyers and growing interest in this asset. This setup suggests that a breakout move could push DOGE toward higher resistance levels in the short term.
With expectations of a 30% to 35% potential gain, DOGE is well-positioned for traders looking for medium-term opportunities. The bullish wave formation often reflects strong accumulation phases before a decisive upward push, making this a key moment to monitor price action closely.
Investor sentiment is also turning positive as DOGE continues to attract both retail and institutional attention. If momentum holds and market conditions remain favorable, DOGE could deliver a strong rally that aligns with the projected technical targets.
✅ Show your support by hitting the like button and
✅ Leaving a comment below! (What is You opinion about this Coin)
Your feedback and engagement keep me inspired to share more insightful market analysis with you!

DOGE's Situation, A Comprehensive Analysis !!!It appears that the price is forming a cup and handle pattern, and if this occurs, it could push the price above $0.50.
DOGE Long Idea - MemecoinDOGE Swing Long Idea
📊 Market Sentiment
Market sentiment remains strongly bullish as the FED is expected to deliver a 0.25% rate cut, with speculation building for a possible 0.5% cut in September. Monetary policy shifts are being driven by both inflation trends and weakening labor market data. The latest August and September job reports were soft, signaling that the economy is cooling rapidly. This environment continues to fuel expectations for a major bullish run in the weeks ahead.
📈 Technical Analysis
Price recently broke and closed above the bearish trendline with strong bullish candles, confirming the breakout.
This is a key technical shift that aligns with my previous outlook. (I mentioned this scenario in my last DOGE analysis — check the linked idea for more context.)
📌 Game Plan
I entered the trade at $0.24841 immediately after the breakout confirmation.
📋 Trade Management
Stoploss: $0.22900
Target: $0.28779
💬 Like, follow, and comment if you find this setup valuable!
⚠️ Disclaimer: This content is for informational and educational purposes only and does not constitute financial, investment, or trading advice. Always do your own research before making any financial decisions.

Doge...Is a 50% Pump Coming?Hello guys!
Trend Structure:
The price is moving within a broad ascending channel, with both upper and lower boundaries acting as dynamic resistance and support. The midline (dotted blue) appears to function as a short-term pivot zone.
Recent Movement:
After a mid-July decline from around $0.29, the price found support just above $0.17 and has since rallied sharply, now trading around $0.2367.
Projection Shown in Chart:
The drawn black curved arrow suggests a potential short-term pullback from the current levels before resuming the uptrend toward the $0.314 resistance, which corresponds to the upper boundary of the channel.
Key Levels:
Immediate resistance: $0.24 – $0.25 zone
Major resistance target: $0.314
Immediate support: Around $0.21 (midline of channel)
The outlook here is bullish, assuming that the midline support holds during any pullback. A break and close above $0.25 would strengthen the likelihood of a move toward $0.31.

DOGEUSDTBINANCE:DOGEUSDT is now trading-renge in 0.2240$ resistance and 0.20800$ support.
I wait do to break any support and resistance for buy or sell.
Best support: 0.19100
Best resistance: 0.2450 - 0.26560 - 0.28200
⚠️ Please control risk management.

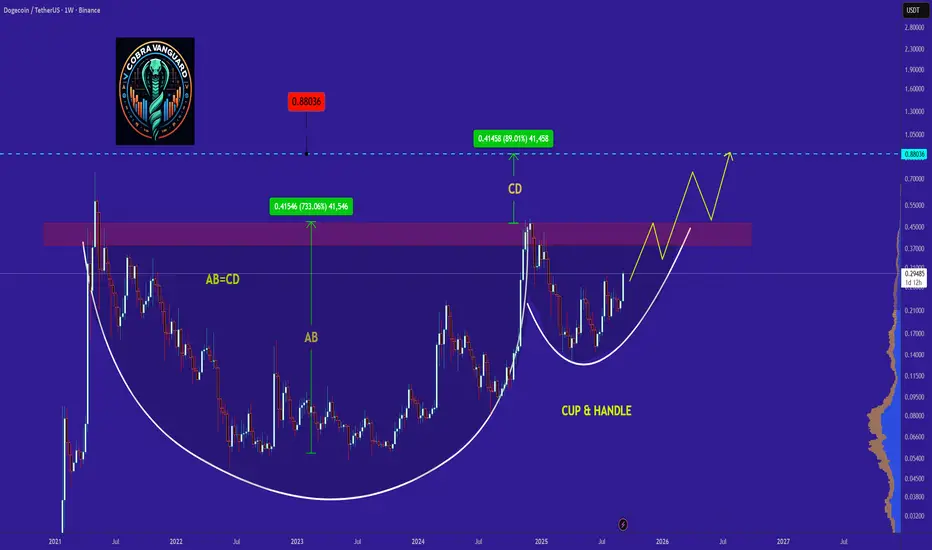
DOGE's situation+next targets and expected movementsThe price on the daily timeframe is within an ascending triangle, which can be promising. If the price breaks this pattern with bullish candles, it could easily rise by the distance of AB=CD .
Best regards CobraVanguard.💚

Doge - follow the trendDoge - follow the trend
Nearly 500m entered the market - follow it to make money

DOGE season is coming!The structure, price action, and catalysts all look incredibly bullish.
That’s why I rotated half of my CRYPTOCAP:PEPE stack into $DOGE. My overall target for this barbell distribution is a 3x from current levels.
⦿ Key Highlights
- Breaking out after a very long-term consolidation
- Breakout + retest seems complete
- Crypto may be entering the late bull phase
- Altcoins could soon enter the mania stage
- DOGE, as the top and most established memecoin, is well-positioned to lead the pack
- Treasury and ETF launches add strong tailwinds
- DOGE Digital Asset Treasuries (DATs) have started purchasing CRYPTOCAP:DOGE
- CleanCore bought $500M worth of DOGE this week, with another $500M planned in the coming weeks
- Rex-Osprey Dogecoin ($DOJE) goes live today
✅ What’s your read on this move?
Is this the real rotation to alts, or just another fakeout? Drop your take or send this to someone trading memecoins this week. 📢
⚠️ Disclaimer: Crypto products, NFTs, Memecoins are unregulated and can be highly risky. There may be NO regulatory recourse for any losses arising from such transactions.
This content is for educational and informational purposes only and does NOT constitute financial, investment, tax, or legal advice. Cryptocurrencies are highly volatile and speculative — you may lose part or ALL of your investment. I am NOT liable for your losses.
Please do NOT copy my trades. Always consult YOUR financial advisor before making any investment or trading decisions. Or at the very least, consult your cat. 🐱

[b]New All Time High for DOGE [/b]New All Time High for DOGE
Cup & handle on weekly timeframe on $DOGEUSD. This aligns perfectly with a squeeze from Bollinger Bands, top of Elliot Waves, solid support from next Fibonacci level and the launch of the ETF tomorrow! Run DOJE Run!

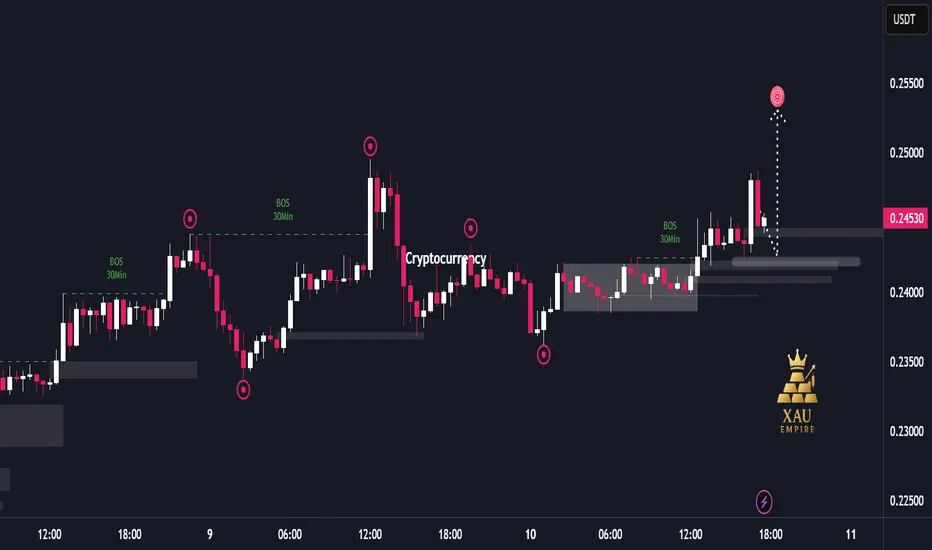
Institutional Flow Driving DOGE Upside Liquidity Hunt📊 Report-Based Analysis
Market Structure:
The chart shows multiple “Break of Structure (BOS)” events, indicating that institutional orders are driving the market direction. Frequent upside BOS suggests that the bullish trend is currently dominant.
Liquidity Movements:
Price has repeatedly hunted liquidity around major highs and lows (sharp wicks and sudden moves triggering stop losses) before returning to its intended direction. This behavior reflects strong institutional control over market flow.
Price Action Dynamics:
First, the market expanded upward with strong bullish momentum.
A sharp correction followed, creating volatility.
Afterwards, price entered a consolidation phase, which later broke to the upside.
Despite a recent rejection, the bullish structure remains intact.
Current Situation:
Price is trading around the 0.245 area. A large bullish candle was followed by a quick rejection, but the broader structure continues to lean bullish. Projections on the chart suggest a potential push higher as liquidity targets remain above.
Market Bias:
Short-term bias remains bullish. The consistent BOS and formation of higher lows show that the market is more likely to continue seeking upside liquidity in the near term.
DOGE Breakout Trade IdeaDOGE is building momentum after a long awaited "alt season". Could be an interesting trade setup if we can breakout from this year's resistance. I'm eyeing a 2x-3x move.

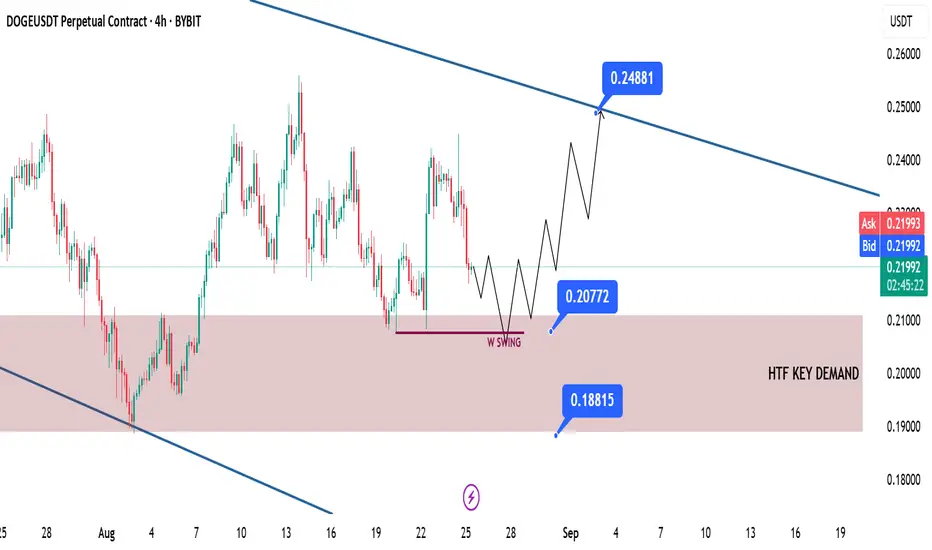
DOGE Swing Long Idea DOGE Game Plan
📊 Market Sentiment
Overall sentiment remains bullish, supported by expectations of a 0.25% rate cut in the upcoming FOMC meeting. A weakening USD and increasing global risk appetite are creating favorable conditions for further upside in crypto assets.
📈 Technical Analysis
Price is retracing towards the HTF Demand zone, which I expect to act as a bounce area.
Moreover, price currently seems to be seeking liquidity to fuel its next bullish move. That liquidity could be the weekly swing low at $0.207.
📌 Game Plan
Wait for price to reach the HTF Demand zone.
Look for price to sweep liquidity and close back above the $0.207 level.
🎯 Setup Trigger
I will be waiting for a 4H market structure shift before entering the trade.
📋 Trade Management
Stoploss: Daily close below HTF support zone — $0.188
Target: $0.248
💬 Like, follow, and comment if you find this setup valuable!
⚠️ Disclaimer: This content is for informational and educational purposes only and does not constitute financial, investment, or trading advice. Always do your own research before making any financial decisions.