SOL/USDT | Continuing the trend? (READ THE CAPTION)By analysing the 4H chart of SOLUSDT, we can see that After weeks of struggling with the Demand Zone, not being able to break through it, Solana has finally gone out of there. It went on to just over $140 and it is currently being traded at 137.70 level, just above the IFVG High, it may touch the high of it again and then going higher.
There's relative equal highs here as I have pinpointed, and I believe that eventually Solana will take over them by reaching the $147.
For the time being, the targets are: 140, 143, 146 and 147.
Dogecoin

ADA/USDT | $ADA Demand Zone Played Out Perfectly – 33% Surge!CRYPTOCAP:ADA dropped into the $0.32–$0.36 demand zone exactly as forecasted. Once it hit the zone, strong buying pressure kicked in, launching the price above $0.43 and delivering a sharp 33% rally. The main analysis remains valid. As long as price holds above $0.38–$0.40, new bullish targets are $0.46, $0.50, and potentially $0.54.
Please support me with your likes and comments to motivate me to share more analysis with you and share your opinion about the possible trend of this chart with me !
Best Regards , Arman Shaban

BTC/USDT | More Bullish Move Ahead ? Let's See!By analyzing the CRYPTOCAP:BTC chart on the Daily timeframe, we can now confirm a powerful breakout above previous resistance. Bitcoin surged to $94,800 and is currently trading around $92,500.
If price manages to sustain above the key $90,000 level, the bullish scenario strengthens, and we may see an extension toward higher targets. The next key resistance zones to watch are $97,000, $99,000, $101,400, and $104,000.
The bias has shifted from bearish to bullish, but only if $90K holds as new support. Momentum remains in buyers’ hands as long as structure and volume confirm this shift.
Please support me with your likes and comments to motivate me to share more analysis with you and share your opinion about the possible trend of this chart with me !
Best Regards , Arman Shaban

LTC/USDT | Retesting incoming (READ THE CAPTION)As you can see in the 2h chart of LTCUSDT, it made it out of the FVG last night and gone up as high as 84.57, sweeping the BSL there, but it returned to the FVG and it is now being traded at 83.10. I expect Litecoin to to retest the high of the FVG again and then go on to sweep the liquidity above the 84.57 level.
Targets for LTCUSDT: 83.50, 84, 84.5 and 85.

DOGE It will grow soon...So if you pay attention to the DOGE chart you can see that the price has formed a Ascending wedge which means it is expected to price move as equal as the measured price movement.( AB=CD )
NOTE: wait for break of the WEDGE .
Best regards CobraVanguard.💚

ETH/USDT | Testing the FVG! (READ THE CAPTION)By analysing the 2h chart of ETHUSDT we can see that after struggling with the high of the FVG for a while, it finally managed to break free and go up to 3265, $8 lower than the low of the FVG. I'd like to see ETHUSDT test the FVG and then make a decision on which way to go.
For the time being, the bullish targets are: 3223, 3265 and 3297.
Bearish Targets: 3200, 3170, 3140.

Dogecoin could have another rally (4H)The chart shows a clear bullish Change of Character (CHoCH), formed by strong and aggressive buying pressure. This shift in market structure suggests that buyers are currently in control and that bullish momentum is building.
At the moment, price is holding and trading around an important key level, an area that has historically acted as a major decision zone. The ability of price to remain supported here strengthens the bullish outlook.
Above the current price action, a large liquidity pool has formed near the highs. This liquidity remains untapped and may be taken soon, which often acts as fuel for continuation toward higher levels rather than a reversal.
Two potential entry zones have been clearly marked on the chart. Instead of entering all at once, it is recommended to scale into positions using a DCA (Dollar-Cost Averaging) approach, allowing for better risk control during pullbacks.
All targets are marked on the chart.
Once price reaches the first target, it is advised to secure partial profits and then move the stop loss to break-even, ensuring a risk-free trade while allowing the remaining position to aim for higher targets.
If you would like us to analyze a coin or altcoin for you, first like this post, then comment the name of your altcoin below.

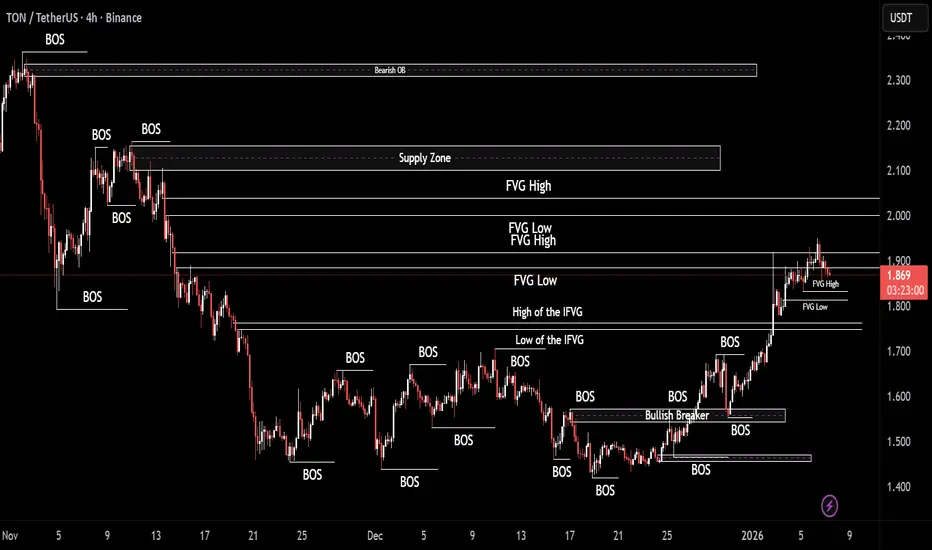
TONUSDT | Where is it headed? (READ THE CAPTION)As you can see in the 4H chart of TONUSDT, yesterday it made it out of the FVG zone, going as high as 1.950, but then it dropped and went below the FVG at 1.852, and currently being traded 1.875. I'd like to see it drop to the FVG High below it at 1.833 to see a reaction.
Bullish targets, if it bounces back up: 1.880, 1.895, 1.910 and 1.925.
If it fails and drops further, the targets are: 1.865, 1.850 and 1.835.
#DOGE/USDT - Only One Scenario Left: UP#DOGE
The price is moving in a descending channel on the 1-hour timeframe. It has reached the lower boundary and is heading towards breaking above it, with a retest of the upper boundary expected.
We have a downtrend on the RSI indicator, which has reached near the lower boundary, and an upward rebound is expected.
There is a key support zone in green at 0.1470. The price has bounced from this zone multiple times and is expected to bounce again.
We have a trend towards consolidation above the 100-period moving average, as we are moving close to it, which supports the upward movement.
Entry price: 0.1490
First target: 0.1500
Second target: 0.1522
Third target: 0.1550
Don't forget a simple principle: money management.
Place your stop-loss order below the support zone in green.
For any questions, please leave a comment.
Thank you.

BTC/USDT | BTC is finally free of shackles! (READ THE CAPTION)BTCUSDT has finally managed to break through the IFVG, going as high as 91,810. It has hit the low of the Bearish Breaker and has dropped in price, currently being traded at 91,360. I expect BTC to retest the bearish breaker, eventually breaking through it.
Current targets for BTCUSDT: 91,400, 91,800, 91,200, 92,600 and 93,000.

SOLUSDT | Finally breaking through? (READ THE CAPTION)Solana finally made a small upwards move, barely getting through the demand zone it has been stuck in for a long while. After going out a little bit, it fell in the demand zone again, but it is now being traded at 134, which is slightly in the Demand Zone. I expect Solana to make it out of that zone and going to test the low of the FVG at 135.43.
Targets for Solana: 136, 137.50 and 139.

ETH/USDT | Going higher! (READ THE CAPTION)As you can see in 2h chart of ETHUSDT, it has broken through the FVG, and it is now being traded at 3135. It went down near the high of the FVG, but it went back up before barely hitting the high of the FVG.
Current targets for ETHUSDT: 3144, 3170, 3195, 3120.

DOGE Analysis (1D)Dogecoin has entered the correction phase from the point we marked on the chart.
Based on the structure, an ABC pattern has been identified on the chart, and after wave C is completed, we expect retracement movements to the upside.
Wave C still needs more time to complete, and it is expected to finish between the two vertical time lines drawn on the chart.
Within the time lines and the green zone, one can consider buy/long positions.
As long as wave C has not finished, buying is not wise
For risk management, please don't forget stop loss and capital management
When we reach the first target, save some profit and then change the stop to entry
Comment if you have any questions
Thank You

DOGEUSDT | On a bullish run! (READ THE CAPTION)As you can see, same as the other cryptocurrencies, DOGEUSDT has been on bullish run, going from 0.11782 all the way to 0.14498, and reaching the low of the Supply Zone and a little bit of correction afterwards. Currently Doge is being traded at 0.14270, and I expect it to test the supply zone again.
Targets for Doge: 0.14350, 0.14500, 0.14650 and 0.14800.

ROAD TO 15 CENTS (4h)ROAD TO 15 CENTS
We can be hopeful that after breaking out of the wedge, we will see significant price growth.AB=CD
Best regards CobraVanguard.💚
Give me some energy !!
✨We spend hours finding potential opportunities and writing useful ideas, we would be happy if you support us.
Best regards CobraVanguard.💚

DOGEUSDT – 4H Chart UpdateDOGEUSDT – 4H Chart Update
Still bearish, but momentum is weakening
The price is holding a strong demand zone (0.120 – 0.115) after a prolonged downtrend.
Descending trendline is being tested
Volatility compression near support → decision zone
Repeated rejections from lower levels show selling pressure exhaustion
Support: 0.120 – 0.115 (critical)
Invalidation: Below 0.112
Resistance: 0.135 – 0.150
Breakout zone: 0.160+ → opens room toward 0.20
⚠️ Extreme fear environment = patience > prediction
DYOR | NFA

TON/USDT | Weak momentum (READ THE CAPTION)In the 4H chart of TONUSDT we can see that after it hit the Bullish Breaker, it went up and it is now being traded at 1.635. However, the bullish momentum is still weak and we are yet to see a strong move from TON.
Current bullish targets: 1.693, 1.761 and 1.830.

#DOGE/USDT is about to blast off! Study internet bubble stocks.#DOGE
The price is moving within a descending channel on the 1-hour frame, adhering well to it, and is heading for a strong breakout and retest.
We have a bearish trend on the RSI indicator that is about to be broken and retested, which supports the upward breakout.
There is a major support area in green at 0.2520, representing a strong support point.
We are heading for consolidation above the 100 moving average.
Entry price: 0.2658
First target: 0.2727
Second target: 0.2835
Third target: 0.2947
Don't forget a simple matter: capital management.
When you reach the first target, save some money and then change your stop-loss order to an entry order.
For inquiries, please leave a comment.
Thank you.

DOGE Bullish Structure in Play (4H)Market makers have aggressively dumped and pumped the price in sharp moves. They don’t want you to easily ride profitable waves; instead, they aim to stop you out or lure you into entering at a point where, after getting in, you’ll feel psychological pressure. The goal is to make you uncomfortable so that during the next bullish move, you exit the trade prematurely before the real bullish expansion begins due to stress or doubt.
That’s why patience is essential when entering a position. You need to wait and select optimal entry zones. Even if the price moves higher and doesn’t give you a clean entry, that is still far better than chasing the market emotionally and then suffering psychological pressure afterward.
You need to think more strategically. The natural behavior of candles and price action is constant movement up and down. The key is to enter positions intelligently, not emotionally.
At the moment, the price is trading above key levels, and we’ve recently seen a strong bullish move with solid momentum on the chart. In addition, there is a bullish CH (Change of Character) present. Both the price structure and momentum clearly support buy/long positions.
There is also a liquidity pool above the current price action, which DOGE can potentially sweep. For this reason, we are looking for buy/long opportunities around support zones.
We have identified two potential entry points for buy/long positions, where we should enter using a DCA (Dollar Cost Averaging) approach directly on the chart.
The targets have already been clearly marked on the chart as well.
A daily candle closing below the invalidation level will negate this analysis.
If you have a coin or altcoin you want analyzed, first hit the like button and then comment its name so I can review it for you.
This is not a trade setup, as it has no precise stop-loss, stop, or target. I do not publish my trade setups here.

BTCUSDT | Current targets! (READ THE CAPTION)As you can see in the 2H chart of BTCUSDT, it has been going up and down between the IFVG and the Demand Zone, no clear view of how and when it'll make a move.
In a prior analysis, I had mentioned that the bullish target were 88400, 89000 and 90400. BTC reached the first 2 targets but failed to go for the 3rd one.
For the time being, these are the bullish targets for BTC: 88,225, 88700, 89200 and 89700.
Bearish targets: 87,700, 87,250, 86,700 and 86,250.

DOGE/USDT | Where is it headed? (READ THE CAPTION)As you can see, DOGEUSDT has plummeted in price, currently being traded at 0.12330 and has been consolidating in the same region for a while now.
For now, there's no strength in Doge.
Current upside targets for Doge: 0.12430, 0.12620 and 0.12800.

DOGE road map (weekly) !After the drop, the price can slightly bounce back up if buyers support it and we have a price correction. If the red trendline is broken, the price can move to the ranges we have specified.

DOGECOIN Monthly Chart Using the Gaussian Channel indicator price can be seen continually breaking out at the middle line of the indicator. Right now price is testing this line.
Big break out soon?
This is a long term view
