DOGE – Downtrend Channel + Bearish Head & Shoulders BreakdownDogecoin continues to move inside a large multi-year descending channel, respecting both the upper and lower boundaries. Recently, the chart has formed a clear bearish Head and Shoulders pattern , which has already broken down and is currently playing out.
At this stage, I expect a small relief retest toward the $0.15–$0.175 zone , which corresponds to the broken neckline area. If this retest confirms resistance, DOGE may enter a deeper correction phase.
The main downside target lies at the $0.04–$0.03 zone , aligned with the lower boundary of the long-term descending channel.
From this area, I expect the beginning of a new bullish cycle for DOGE, potentially initiating a macro trend reversal.
Future bullish targets:
$0.80–$1.00
$1.70–$2.20
Dogecoinusd

DOGE near term TARGET $0,34Dogecoin is likely on it's way to more bullish prices.
Since around 22 June, there's been a near "up-only" trend on DOGE, where the price is continuously making higher highs and the corrections are all still higher lows.
In terms of technical indicators, we see strong bullish indication in the weekly timeframe as the price trade above all moving averages:
The daily timeframe's price is trading above the moving averages as well. A good place to watch for SHORT term corrections is the first and second band of the moving averages here:
OKX:DOGEUSDT BINANCE:DOGEUSDT

DOGE is meme legend Here we have a slightly different angle of view on Dogecoin with ASO.
We can see that ASO is very accurate in this setting on Dogecoin and does exactly what we want — it always signals a shift, an exchange of momentum.
We cannot fully estimate what lows or highs the price will hit or reach, but it helps us a lot to see that now, based on history, it is literally “the worst is behind us”, and a dead phase is coming.
Yes, we can see that the price could still drop a bit lower and revisit the $0.09–$0.10 area. That is very likely.
But the red curve on ASO — together with the price of Dogecoin — has always experienced the biggest fall exactly when the curve started to break upward from the bottom, meaning the red line rises and the blue line falls.
See you soon, good luck. Don’t give up.
This is the kind of momentum where some memes may be forgotten, but the stronger coins will survive.
Maybe we are already at the bottom maybe the bottom is not far from reality.

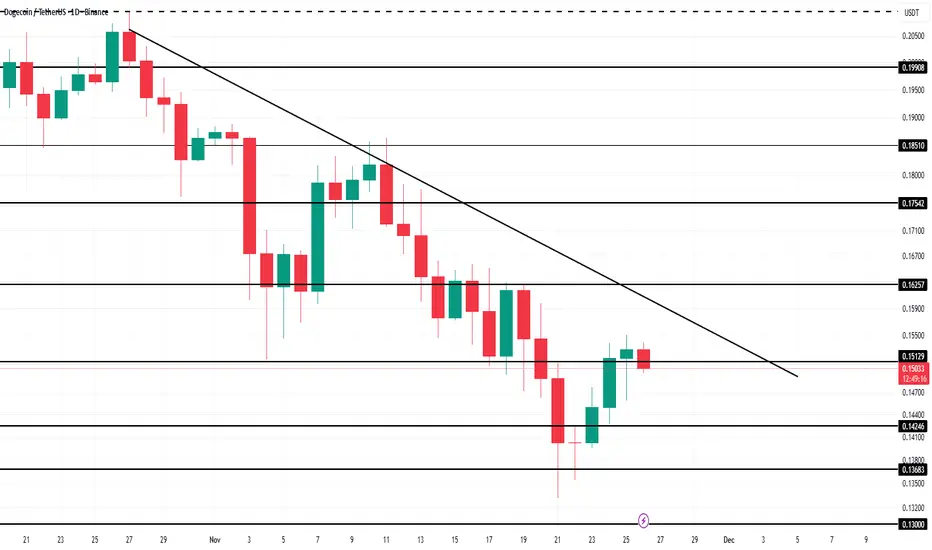
Did Dogecoin ETF Fail At Launch? Where Is Price Headed?Dogecoin is trading at $0.149, sitting just below the $0.151 resistance. The meme coin remains trapped under a persistent downtrend that has lasted nearly a month, with little evidence of a breakout forming.
Given the weak ETF inflows and bearish on-chain signals, breaking above this downtrend could be difficult. DOGE may continue oscillating under the trendline and could fall toward $0.142 if selling pressure increases.
If Dogecoin manages to attract fresh demand, however, the picture changes. A decisive breach of the downtrend could push the price above $0.162 and potentially toward $0.175. This would invalidating the bearish thesis and setting the stage for renewed momentum.
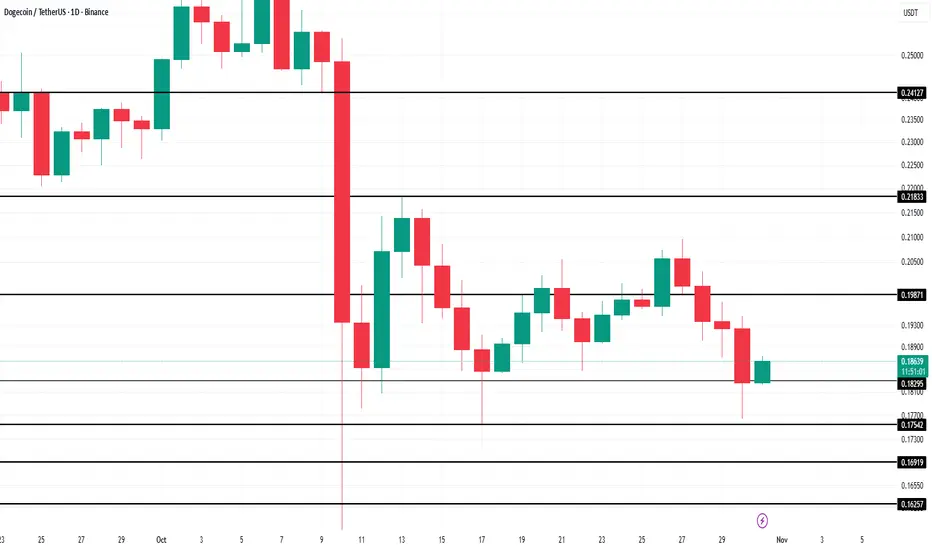
Dogecoin Witnesses Death Cross After 3 Months As Price Falls BelAt the time of writing, Dogecoin’s price sits at $0.185, holding just above its immediate support level. However, the bearish signals from both EMAs and whale behavior suggest a continued slide may be ahead.
If momentum weakens further, Dogecoin’s price could drop to $0.175 or even $0.165. This decline may trigger panic selling among retail traders, intensifying market losses and delaying any potential recovery.
Alternatively, a swift rebound could see Dogecoin reclaim $0.199 and potentially breach $0.209. Such a move would invalidate the bearish thesis and restore some investor confidence, signaling renewed market participation and short-term stability.
Dogecoin - This is just insane!🧠Dogecoin ( CRYPTO:DOGEUSD ) is incredibly strong:
🔎Analysis summary:
During the end of last week, we literally saw a flash crash on Dogecoin, correcting about -50% in just a couple of minutes. However, bulls actually took their chance and bought the dip accordingly. This is just another sign that Dogecoin remains totally bullish now.
📝Levels to watch:
$0,5
SwingTraderPhil
SwingTrading.Simplified. | Investing.Simplified. | #LONGTERMVISION

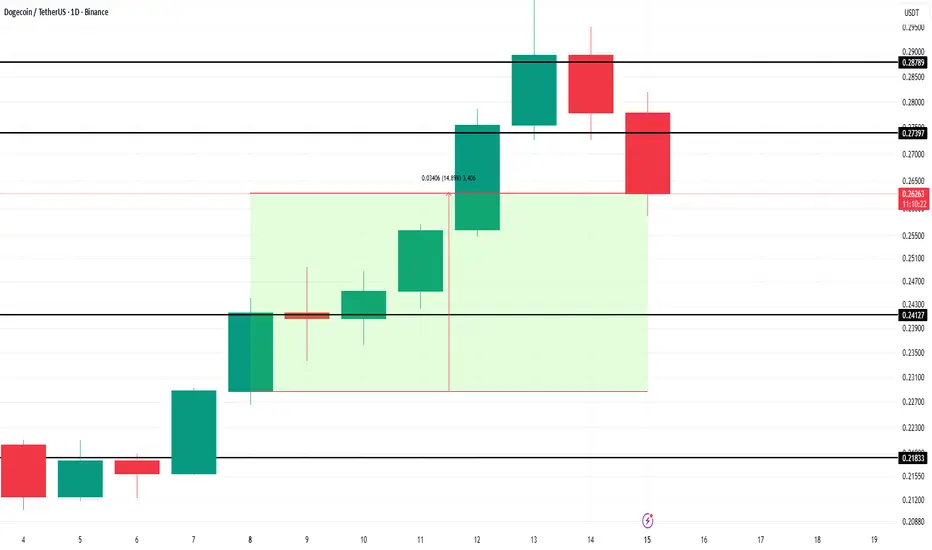
3 Meme Coins To Watch In The Second Week Of SeptemberDogecoin price is trading at $0.262 after slipping below the $0.273 support level. Despite this decline, the meme coin leader continues to flash bullish cues, suggesting momentum could still favor recovery. Investors remain focused on whether DOGE can reclaim lost ground and restart its upward trajectory.
The 50-day EMA is diverging upward from the 200-day EMA, a signal of strengthening bullish momentum. This technical pattern often precedes price rebounds. If momentum holds, Dogecoin could reclaim $0.273 as support and push higher toward the $0.287 resistance, attracting stronger investor confidence in the short term.
However, risks remain if DOGE holders decide to offload their positions. Profit-taking could weigh heavily on the token, driving its price lower. In that scenario, Dogecoin could fall toward the $0.241 support level, invalidating the bullish thesis and potentially sparking further downside pressure.
Dogecoin - The all time high will follow!🎁Dogecoin ( CRYPTO:DOGEUSD ) prepares new all time highs:
🔎Analysis summary:
Dogecoin has been creating bullish cycles for the past decade. Following these cycles, it is quite likely that Dogecoin will break the previous all time high soon. And with the recent bullish break and retest, bulls are picking up momentum for the next bullish cycle to continue.
📝Levels to watch:
$0.4
SwingTraderPhil
SwingTrading.Simplified. | Investing.Simplified. | #LONGTERMVISION

Dogecoin - It is all totally expected!🐶Dogecoin ( CRYPTO:DOGEUSD ) will break out soon:
🔎Analysis summary:
Just this month, Dogecoin perfectly retested a significant confluence of support and is starting the expected rejection. With bullish momentum picking up, there is a very high chance that Dogecoin will break the all time high in the near future.
📝Levels to watch:
$0.5
🙏🏻#LONGTERMVISION
SwingTraderPhil

DOGE COIN made a bottom ? start of a new trend ?preferred counts
everything is on the chart , for this dogecoin if not holding then it will move down more
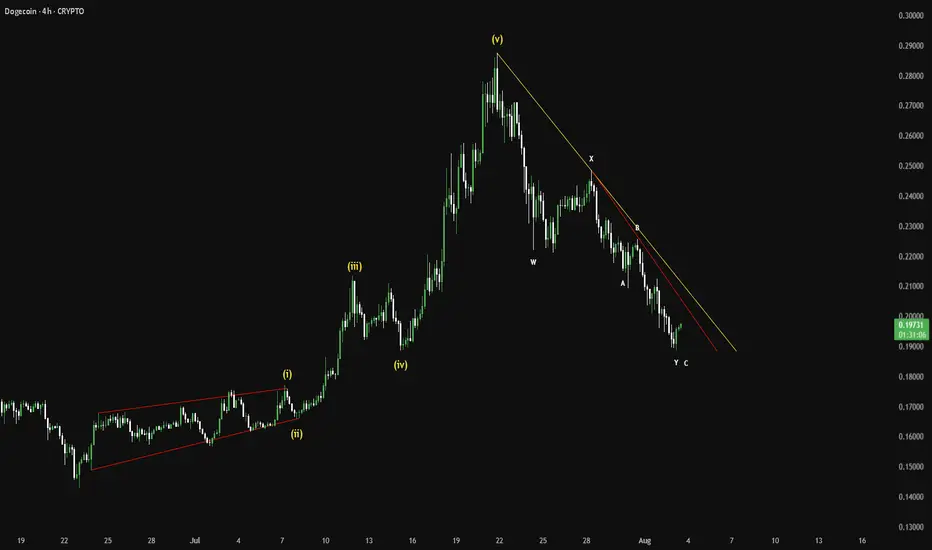
Dogecoin - This is the key structure!Dogecoin - CRYPTO:DOGEUSD - has to reverse now:
(click chart above to see the in depth analysis👆🏻)
A couple of months ago Dogecoin retested the previous all time high. We have been seeing a harsh correction of about -65% thereafter. However Dogecoin still remains in a bullish market with bullish structure. In order to validate this trend, a reversal must happen now.
Levels to watch: $0.15, $0.5
Keep your long term vision🙏🙏
Philip (BasicTrading)

"DogeCoin" Crypto Heist - Bullish Breakout Plan!🌍 DOGEUSDT Crypto Heist Plan: Unleash the Thief Trading Style! 🤑💸🚀
Dear Market Mavericks & Crypto Bandits, 🏴☠️
Get ready to pull off the ultimate DOGEUSDT market heist with our Thief Trading Style, blending razor-sharp technical analysis and cunning fundamental insights! 📊🔥 Our mission? Storm the market, grab those bullish profits, and escape before the Dangerous Red Zone traps us in overbought chaos, consolidation, or a bearish reversal. 💥 Let’s outsmart the market and cash out like legends! 🏆🎉
📈 The Heist Blueprint: Long Entry Strategy
Entry Point 🚪:
The breakout is your signal! Wait for DOGEUSDT to smash through the Moving Average (MA) at 0.28000—that’s your green light for bullish glory! 🌟
Pro Tip:
Set Buy Stop Orders just above the MA for breakout confirmation.
OR place Buy Limit Orders at the most recent 15M/30M swing low/high for pullback entries.
Set an ALERT on your chart to catch the breakout in action! 🔔
Stop Loss (SL) 🛑:
Breakout traders: Hold off on setting your SL until the breakout confirms. Place it at the recent 1D swing low (0.2000) for swing/day trades.
Risk Management: Adjust SL based on your lot size, risk tolerance, and multiple orders. Play it smart—this is your safety net! ⚠️
Rebels beware: If you stray from the plan, you’re dancing with fire. Own the risk! 🔥
Take Profit (TP) 🎯:
Aim for 0.42000 — our golden exit.
Escape Plan: If the market screams overbought or shows reversal signs, get out early! Don’t get caught in the Red Zone trap. 🚨
🧲 Scalpers’ Corner 👀
Scalp LONG only—ride the bullish waves! 🌊
Got big capital? Dive in now. Smaller stack? Join the swing traders for the full heist.
Use Trailing Stop-Loss to lock in gains and protect your loot. 💰
📡 Market Pulse: Why DOGEUSDT?
The DOGEUSDT market is in a neutral trend with a high probability of bullish momentum. Here’s the intel driving our heist:
Fundamentals: Dive into macroeconomic data, COT reports, geopolitical events, and news sentiment.
Intermarket Analysis: Watch correlated assets for clues.
Seasonal & Positioning Trends: Align with the market’s rhythm.
Future Targets: Check the Overall Score for a full breakdown! 👉🌏🔗
⚠️ Trading Alert: News & Risk Management 📰
News releases can flip the market like a switch! Protect your positions:
Avoid new trades during high-impact news.
Use Trailing SL to secure profits and minimize losses.
Stay sharp—volatility is our friend, but only if we’re prepared!
💪 Join the Heist & Boost the Plan!
Hit the Boost Button to supercharge our Thief Trading Style and make this heist legendary! 🚀 Every boost strengthens our crew, helping us plunder profits daily with ease. 💥 Let’s dominate the DOGEUSDT market together! 🤝
Stay tuned for the next heist plan! 🐱👤 Keep your charts locked, your alerts set, and your trading spirit wild. See you in the profits, bandits! 🤑🎉
#ThiefTrading #DOGEUSD #CryptoHeist #TradingView #MakeMoney

"DogeCoin vs Tether" Crypto Market Heist Plan (Swing / Day)🌟Hi! Hola! Ola! Bonjour! Hallo! Marhaba!🌟
Dear Money Makers & Robbers, 🤑 💰💸✈️
Based on 🔥Thief Trading style technical and fundamental analysis🔥, here is our master plan to heist the DOGE/USDT "DogeCoin vs Tether" Crypto Market. Please adhere to the strategy I've outlined in the chart, which emphasizes long entry. Our aim is the high-risk Red Zone. Risky level, overbought market, consolidation, trend reversal, trap at the level where traders and bearish robbers are stronger. 🏆💸"Take profit and treat yourself, traders. You deserve it!💪🏆🎉
Entry 📈 : "The vault is wide open! Swipe the Bullish loot at any price - the heist is on!
however I advise to Place buy limit orders within a 15 or 30 minute timeframe most recent or swing, low or high level. I Highly recommended you to put alert in your chart.
Stop Loss 🛑:
Thief SL placed at the recent/swing low level Using the 2H timeframe (0.16000) Day trade basis.
SL is based on your risk of the trade, lot size and how many multiple orders you have to take.
🏴☠️Target 🎯: 0.22000 (or) Escape Before the Target
🧲Scalpers, take note 👀 : only scalp on the Long side. If you have a lot of money, you can go straight away; if not, you can join swing traders and carry out the robbery plan. Use trailing SL to safeguard your money 💰.
DOGE/USDT "DogeCoin vs Tether" Crypto Market Heist Plan (Swing / Day Trade) is currently experiencing a bullishness,., driven by several key factors.
📰🗞️Get & Read the Fundamental, Macro, COT Report, On Chain Analysis, Sentimental Outlook, Intermarket Analysis, Future trend targets.. go ahead to check 👉👉👉
⚠️Trading Alert : News Releases and Position Management 📰 🗞️ 🚫🚏
As a reminder, news releases can have a significant impact on market prices and volatility. To minimize potential losses and protect your running positions,
we recommend the following:
Avoid taking new trades during news releases
Use trailing stop-loss orders to protect your running positions and lock in profits
💖Supporting our robbery plan 💥Hit the Boost Button💥 will enable us to effortlessly make and steal money 💰💵. Boost the strength of our robbery team. Every day in this market make money with ease by using the Thief Trading Style.🏆💪🤝❤️🎉🚀
I'll see you soon with another heist plan, so stay tuned 🤑🐱👤🤗🤩

JUST IN: Elon Musk's DOGE Blocks $52 Mln Payment to WEFThe Department Of Government Efficiency (D.O.G.E) a mechanism set up by the President Donald Trump headed by Elon Musk in a shocking news has block $52 million payments intended to be given to the World Economic Forum (WEF). This and many more blockage and unnecessary spendings was tracked and blocked by the DOGE team.
Now, knowing Elon Musk's unwavering support to the altcoin Dogecoin ( CRYPTOCAP:DOGE ) a token that is based on the popular "doge" Internet meme and features a Shiba Inu on its logo, CRYPTOCAP:DOGE coin price is fundamentally tied to The Department Of Government Efficiency (D.O.G.E).
Somehow this mechanism set up by Donald Trump might be the catalyst needed by CRYPTOCAP:DOGE coin to break the psychological $1 resistant with traders eyeing a $1 move this year. As more frivolous spendings and wasting of government funds are unravel, CRYPTOCAP:DOGE coin might be on the verge of a breakout amidst a falling wedge pattern formed since the 2nd week of February, 2025.
Dogecoin Price Live Data
The live Dogecoin price today is $0.169289 USD with a 24-hour trading volume of $1,053,328,921 USD. Dogecoin is down 2.66% in the last 24 hours, with a live market cap of $25,141,281,592 USD. It has a circulating supply of 148,510,656,384 DOGE coins and the max. supply is not available.
DOGECOIN SELL BREAKOUTDOGECOIN on H1 timeframe presents a selling opportunity due its bearish momentum from a semi-brearish channel breakout which is about to be formed.This suggests a potential sell

Dogecoin at $0.402: Sit, Stay, or Fetch the Moon?Dogecoin is currently trading around a key support level at $0.40, with the market poised for its next major move. This level will likely play a crucial role in determining the short-term trend, as the balance between buyers and sellers tightens.
A dip toward $0.394 followed by a strong recovery could signal that bullish sentiment remains intact, with buyers likely targeting higher resistance level (Dashed Green Projection).
A break above the $0.432 mark would confirm a shift in momentum, opening the door to further upside toward the critical resistance at $0.485 and possibly beyond (Solid Green Projection).
Conversely, a failure to hold the $0.394 support may indicate weakness, increasing the probability of a deeper decline. In this case, the next significant support lies around $0.374, and a breach of this zone could accelerate bearish pressure, pushing prices closer to $0.342 (Red Projection).

Dogecoin parabolic moves have always started when BTC breaks ATHYes we will se a parabolic move on Dogecoin again. Just be patient

Aligning cycles between Doge and Bitcoin!Take a close look when aligning these two correlated crypto assets. See how the top on doge matched with the previous cycle bottom on btc. This suggest an ambitious target of around 6 dollars for this cycle?

BB suggesting a second pump above the 1 dollar level?!I am standing with doge and still see a feasible 10x to come in the coming months.

Dogecoin analysis in depthKey Observations from Historical Data BINANCE:DOGEUSDT BINANCE:DOGEUSD :
After July 9, 2016 (BTC halving to 12.5 BTC):
Dogecoin rose 10,062% in 550 days.
Key takeaways: A steady rise occurred over a prolonged period after Bitcoin's halving, benefiting from the general bullish market sentiment.
After May 11, 2020 (BTC halving to 6.25 BTC):
Dogecoin rose 18,693% in 362 days.
Key takeaways: The price skyrocketed faster and more aggressively, possibly due to increased retail interest, the rise of meme coins, and Dogecoin-specific catalysts.
Post-2024 Halving Projections:
If Bitcoin's April 2024 halving (to 3.125 BTC per block) follows similar patterns, historical precedent suggests a significant price surge for Dogecoin. However, the extent and timing depend on various factors.
Projection Based on Historical Patterns:
If Dogecoin repeats the 10,062% rise (2016 pattern): This would imply a 100-fold increase from current levels. Assuming Dogecoin's price is around $0.07 at halving, the price could theoretically reach $7-$8.
If Dogecoin replicates the 18,693% rise (2020 pattern): This implies a 187-fold increase, pushing the price into the $12-$14 range.
Extrapolating Higher Growth (24–30 USD): This requires a compounded acceleration beyond prior patterns. While ambitious, it assumes higher adoption, widespread FOMO, and a stronger meme culture fueled by media and influential endorsements.
Timing to New ATH:
1)The 2016 halving saw Dogecoin take 550 days to peak.
2) The 2020 halving saw Dogecoin take 362 days to peak.
3) Given the shortening cycles, 300–500 days post-halving for a new ATH seems plausible.
Factors That Could Impact Growth:
Bitcoin's Dominance: The overall crypto market typically follows Bitcoin's lead. If BTC establishes a strong bull run, altcoins like Dogecoin tend to outperform during later phases of the cycle.
Market Conditions: Macroeconomic factors (interest rates, liquidity, regulations) and overall sentiment toward cryptocurrencies could amplify or dampen growth.
Dogecoin-Specific Catalysts:
Increased adoption (e.g., more merchant acceptance).
Continued celebrity endorsements or community-driven initiatives.
Development of utility beyond memes (e.g., real use cases, Layer 2 solutions).
Retail and Institutional Interest:
In 2020-2021, Dogecoin benefited from a meme-stock culture and retail FOMO. A similar sentiment, fueled by a strong community and media coverage, could reignite.
Competition from Newer Meme Coins: The meme coin market is increasingly crowded, which might dilute Dogecoin's dominance in this space.
Feasibility of $24-$30:
While Dogecoin reaching $24–$30 implies an extremely aggressive growth trajectory, it is not entirely implausible given crypto's volatile nature and history of extraordinary rallies.
Conclusion:
1) A 300–500 day timeline for a significant peak is reasonable based on prior patterns.
2) The price target of $24–$30 is an ambitious upper limit and assumes exponential adoption and exceptional market conditions. A more conservative range of $7–$14 could more aligns with historical data, but Dogecoin is about exception and future.

Its a matter of days for Dogecoin going parabolic againSee the same pattern with 2021. Once the LMACD cools off around that level we might be spiking as crazy. People are mentally prepared for what is coming.

DOGE/USD "DOGE COIN" Crypto Market Bullish Heist PlanHola! Ola! My Dear Robbers / Money Makers & Losers, 🤑 💰
This is our master plan to Heist DOGE/USD "DOGE COIN" Crypto Market based on Thief Trading style Technical Analysis.. kindly please follow the plan I have mentioned in the chart focus on Long entry. Our target is Red Zone that is High risk Dangerous level, market is overbought / Consolidation / Trend Reversal / Trap at the level Bearish Robbers / Traders gain the strength. Be safe and be careful and Be rich.
Entry 📈 : Can be taken Anywhere, What I suggest you to Place Buy Limit Orders in 15mins Timeframe Recent / Nearest Low Point take entry should be in pullback.
Stop Loss 🛑 : Recent Swing Low using 4H timeframe
Target 🎯 : 0.55000
Attention for Scalpers : Focus to scalp only on Long side, If you've got a lot of money you can get out right away otherwise you can join with a swing trade robbers and continue the heist plan, Use Trailing SL to protect our money 💰.
Warning : Fundamental Analysis news 📰 🗞️ comes against our robbery plan. our plan will be ruined smash the Stop Loss 🚫🚏. Don't Enter the market at the news update.
Loot and escape on the target 🎯 Swing Traders Plz Book the partial sum of money and wait for next breakout of dynamic level / Order block, Once it is cleared we can continue our heist plan to next new target.
💖Support our Robbery plan we can easily make money & take money 💰💵 Follow, Like & Share with your friends and Lovers. Make our Robbery Team Very Strong Join Ur hands with US. Loot Everything in this market everyday make money easily with Thief Trading Style.
Stay tuned with me and see you again with another Heist Plan..... 🫂

DOGEUSD Crypto Market Money Heist Plan on Bullish SideHii! My Dear Robbers / Money Makers & Losers, 🤑 💰
This is our master plan to Heist "DOGEUSD" Crypto Market based on Thief Trading style Technical Analysis.. kindly please follow the plan I have mentioned in the chart focus on Long entry. Our target is Red Zone that is High risk Dangerous level, market is overbought / Consolidation / Trend Reversal / Trap at the level Bearish Robbers / Traders gain the strength. Be safe and be careful and Be rich.
Entry 📈 : Can be taken Anywhere, What I suggest you to Place Buy Limit Orders in 15 mins Timeframe Recent / Nearest Low Point take entry in pullback.
Stop Loss 🛑 : Recent Swing Low using 2H timeframe
Attention for Scalpers : Focus to scalp only on Long side, If you've got a lot of money you can get out right away otherwise you can join with a swing trade robbers and continue the heist plan, Use Trailing SL to protect our money 💰.
Warning : Fundamental Analysis news 📰 🗞️ comes against our robbery plan. our plan will be ruined smash the Stop Loss 🚫🚏. Don't Enter the market at the news update.
Loot and escape on the target 🎯 Swing Traders Plz Book the partial sum of money and wait for next breakout of dynamic level / Order block, Once it is cleared we can continue our heist plan to next new target.
💖Support our Robbery plan we can easily make money & take money 💰💵 Follow, Like & Share with your friends and Lovers. Make our Robbery Team Very Strong Join Ur hands with US. Loot Everything in this market everyday make money easily with Thief Trading Style.
Stay tuned with me and see you again with another Heist Plan..... 🫂
