Dollar_index


US Dollar Index (DXY) *BEARs are INThis will be my views of US Dollar Index (DXY) (Oct 2018)
Please make sure to read the "update" comment as there will be changes along the way.
Cheers.
S0nic
Disclaimer:
The information contained in this presentation is solely for educational purposes and does not constitute investment advice. We may or We may not take the trade.
The risk of trading in securities markets can be substantial. You should carefully consider if engaging in such activity is suitable to your own financial situation.
We, Sonicr Mastery dot com is not responsible for any liabilities arising from the result of your market involvement or individual trade activities.
You should be aware of all the risks associated with foreign exchange trading, and seek advice from an independent financial advisor if you have any doubts.


Dollar Index Can Strengthen MomentaryAs seen on the chart above, there are 2 limited confirmation of the strengthening of the dollar namely : harmonic patterns & chart patterns. Watch out for dollar sellers, use your MM wisely.


NFP data is one of the most important on the market.Statistics on the US labor market has traditionally caused an increased interest among investors and traders around the world and leads to spikes in volatility across all ranges of the financial market. Statistics on the US labor market includes the following set of indicators:
Pre-Forecast
15:30 USA NFP 201K 188K
15:30 USA Average hourly earnings (m / m) 0.4 % 0.3 %
15:30 USA Unemployment rate 3.9 % 3.8 %
The importance of these data is primarily since the labor market is one of the main barometers of the state of the country's economy. In addition, in the conditions of tightening the monetary policy of the Fed, the data is even acquiring a double value. Since the figures for the NFP and the unemployment rate give an idea to the Central Bank of what the overall state of economic activity in the country. And the average hourly wage allows you to estimate the current and future trends in inflation in the country. A salary increase means an increase in inflationary pressure, and a decrease in salary means a decrease in it. The growth of inflationary pressure is a signal for the Central Bank to tighten monetary policy.
Recall that in 2018, the US economy and the labor market, feel just great. Unemployment is at 16-year lows, the average NFP is around 200K, and hourly wages show steady growth.
There are quite a few reasons for this:
- Trump's tax reform and increased economic activity in the country;
- Trump's trade wars are ultimately aimed at protecting domestic producers, which again improves their positions and positively affects the labor market;
- High oil prices stimulate an increase in production, open wells and ultimately create additional demand for labor.
Traditionally, on the eve of promulgation of official statistics from the Department of Labor, they publish data on employment in the US private sector from ADP. This time they turned out to be much better than forecasts: + 230K with a forecast of + 184K. This is the maximum increase over the past six months.
Today we are waiting for good data in general, and the NFP, in our opinion, will be better than expected. All this - the reason for buying the dollar.


Weekly Outlook On DXYDXY got picked up at 150 day EMA. Odds are there will be a testing of that gap area around 98 if bulls manage to close above the D point. Bears see a larger high 2 double top sell setup, there's a 61.80% reaction on last bear leg. Though at this point there is no clear indication of a breakdown in lower timeframes, staying tuned for further tells might be the best option.

DXY Ending Soon The Elliott Wave Flat Correction?!DXY short-term Elliott wave view suggests that the index is doing a Flat correction coming from 8/28/2018 low within cycle red wave II. Meaning that the internal distribution of cycle from that low is showing the sub-division of 3-3-5 wave structure. Where black wave ((A)) ended in 3 swings at 95.73 on 9/04 peak. Down from there the decline to 93.81 low ended black wave ((B)) lower as double three structure with the sub-division of 3 wave corrective sequence in blue wave (W),(X) & (Y).
The initial decline to 94.43 low ended blue wave (W) as zigzag structure. Up from there, the bounce to 94.99 high ended blue wave (X). Down from there, the decline to 93.81 low ended blue wave (Y) as zigzag structure & also completed the black wave ((B)) as well. Above from 93.81 low, the rally higher is taking place as an impulse in black wave ((C)) of II with the sub-division of 5 waves structure in blue wave (1),(3) & (5).
Where the first leg higher to 94.40 high ended blue wave (1). And pullback to 93.95 low ended blue wave (2).
A rally to 95.36 high ended blue wave (3). Then a pullback to 94.99 low ended blue wave (4). Near-term bluee wave (5) remain in progress and may or may not extend higher 1 more time within the blue box area by holding below the 95.93 invalidation level before ending the Flat correction in cycle red wave II.
Afterwards, the index is expected to resume the downside or should react lower in 3 swings at least. We don’t like buying the index.


DXY - buy the confirmed breakout DXY is in consolidation with C wave still left to be formed. It can either breakout from here for a retest of the top or make another small leg down then retest the top.
Long the breakout after confirmation with correction.

Warning Bearish Continue DollarAs chart, dollar have a chart pattern head & shoulder, now pullback on neckline...

Dollar Index analysis towards FOMC The Dollar Index chart with all the relevant elements towards today's rate decision
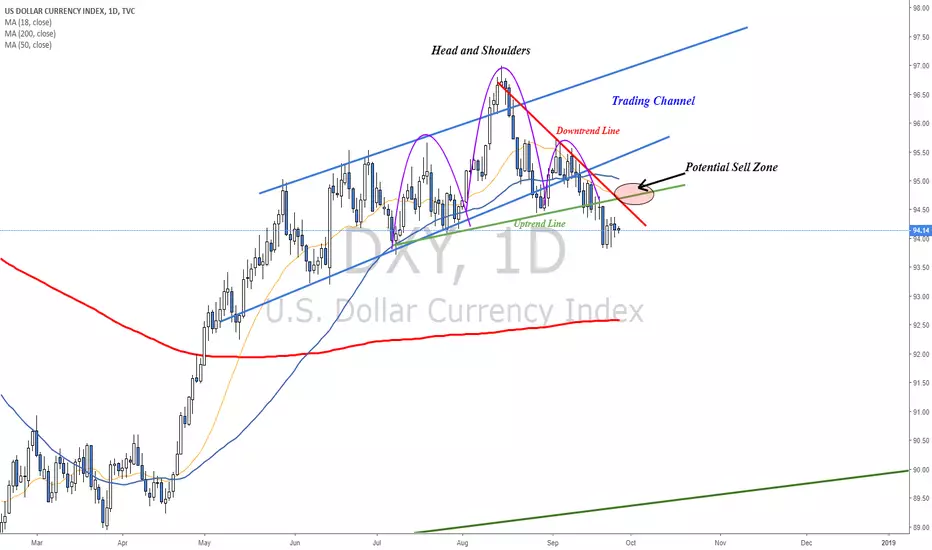
Dollar Index on its way to 93I've been bearish Dollar for a while now.
I've recognize the Dollar's weakness and was glad to get a confirmation when the Dollar broke below the rising channel.
Today, we get another bearish confirmation signal as the Dollar breaks below the neckline of a Head and Shoulders pattern

The US dollar can't go up forever.*** THIS IS NOT AN ADVICE, DO YOUR RESEARCH AND TRADE WITH YOUR OWN RESPONSIBILITY***
The US dollar index has been going up but seems to be losing stream and has formed topping patterns as well.
I see a lot of people not looking at it, but often good traders will always keep an eye on all sorts of correlations.


MONTHLY ANALYSIS ON DXY(US DOLLAR INDEX)I believe that the Dollar Index is still bullish on the monthly perspective at the present moment @15/09/2018(UK DATE) but it is losing steam and will look to reverse around the 98 -100 region. This will give traders an opportunity to go long for the time being i'm expecting in the upcoming months. As we reach the levels of resistance i will expect a reversal and price should look to fill more of the market inefficiency to the downside( along the way turning support into resistance).
I will be updating it as price goes along in the upcoming months...

Dollar is testing support as Investors wait for Draghi and CPIThe Dollar Index is back near support after a failed rally that we saw in August.
The support zone includes the bottom of a rising channel, MA line and a structure zone (previously resistance, now potential support)
On Thursday we will have the ECB meeting and the U.S CPI data - Two events that can (and probably will) impact the Dollar.
The bearish scenario shows potential to reach 93
The bullish scenario shows potential to reach back to the top of the channel
What do you think?


DXY-SHORT AT BREAK RULE WAVEAfter falling to X (94.90), rising to XI (95.68), then reversing to the reversal point at 120% (94.60), confirming the bearish trend.
At present, the H4 wave group (1) (2) (3) has the rule of recovery at wave (2), according to symmetry wave theory waiting for adjustment of waiting zone (80-100%: 95.08-95.32). Hit down the Weekly timeframe
The 3 Elliot rule targets are:
- 38.2 fibo: 93.64
- 23.6 fibo: 92.85
- 0 fibo: 91.57
stop loss: at wave (2) 95.74

DXY Future Sep 2018Price was smash down in previous daily candle... indicate a bear attack move mode on..
watch out any bull fight back on coming days.. as in long term bull is still in charge upward.
Let's see...
